Energy Benchmarking of Double-Skin Façade Buildings
R. Duarte and M. de Matos
ISQ, R. Prof. Dr. Cavaco Silva, 33, Taguspark – Oeiras 2740 – 120 Porto Salvo; Portugal
ABSTRACT
This paper describes ongoing energy benchmarking studies of double-skin façade buildings. Benchmarking methodology is discussed. Some preliminary results are presented.
KEYWORDS
Double Skin-Façade (DSF), Benchmarking.
1. INTRODUCTION
One building-related technology that has gained significant acceptance among architects and promoters of high-rise glazed office buildings is the double-skin façade (DSF). In spite of the acceptance gained among architects and promoters, and of the number of European buildings that were built using DSF technology, the actual energy performance of DSF buildings is still lacking a more in-depth evaluation; there is a great variety in DSF typologies and wide variations in energy performance between different DSF buildings. In addition, the technological progress enables the continuous development of alternative façade systems that can prove to be more energy efficient. It is therefore important to assess the circumstances for which the DSF technology has energetic advantages, and based on actual examples discover the best practices.
Energy benchmarking studies enable the highlighting of the differential performance of different technologies and help in the identification of the underlying causes of this difference, promoting, in this manner, a transfer of best practices.
Within the Bestfaçade Project “Best Practices for Double Skin Façades” supported by the European Commission’s IEE Programme and spanning over 2005 to 2007 a benchmarking analysis of DSF buildings is considered.
Generic benchmarking process consists in five main steps; namely plan, search, observe, analyse and adapt. Looking into work packages (WP) 1 to 6 of the Bestfaçade Project:
WP 1 - State of the art;
WP 2 - Cut-back of non technological barriers;
WP 5 - Best practice guidelines; WP 6 - Dissemination;
one can notice that different tasks will comprise some of the benchmarking steps described above. It becomes clear that the planning, search and observe steps were included in the first stages of the project. Specifically the identification of the goals, definition of determinants that need to be known, the development of a framework to allow the gathering of necessary data; which included the filling of questionnaires (Streicher, 2005), visits to DSF buildings, talks/interviews with architects, promoters, façade designers, management, maintenance or commercial persons somehow involved with DSF buildings or DSF technology. Analysis, interpretation and (preparation for) adaptation stages were included in later stages of the project.
The current paper relates to the work performed mainly within WP3 and deals specifically with the analysis and interpretation of energy performance data. It is structured in the following way: Section 2 presents the benchmarking data; Section 3 discusses the determinants of energy performance that were considered; Section 4 presents a preliminary analysis of the data. Section 5 includes the conclusions and comments on the experience gathered so far.
2. THE BENCHMARKING DATA
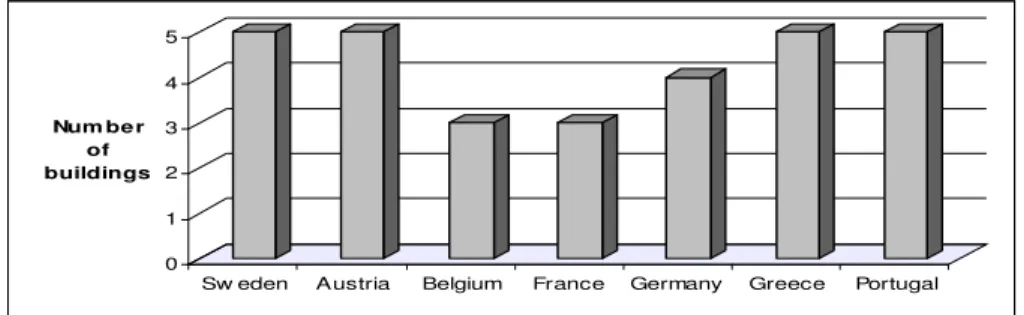
The target group directly addressed by this project were DSF buildings in European countries, namely in Austria, Belgium, France, Germany, Portugal, Greece and Sweden.
Initially it was proposed that analysis would involve 27 DSF buildings plus 3, which were suggested later on, during meetings between Project partners. Figure 1 presents the number of buildings from each country.
0 1 2 3 4 5
Num be r of buildings
Sw eden Austria Belgium France Germany Greece Portugal
Figure 1: Number of buildings per country.
Within the project a combination of data collection tools (questionnaires, additional documentation research, interviews and technical visits) was used to gather sufficient data to fully analyse and interpret building’s performance and critical success factors.
The referred above difficulties in obtaining energy performance data were attributed to the building managers fear for loss of confidentiality and to the lack of monitoring devices, specially to assess cooling, ventilation and lighting demands.
Since the DSF buildings analysed in the reference sample are not sufficient to constitute a reasonably representative sample of the DSF buildings in European cities, it was decided to include in the energy benchmarking analysis single skin façade office buildings. Sample rose to 58 buildings. The total studied amount of buildings energy performance data was 47 buildings, where 17 have supplied annual data energy consumption indexes for both heating and cooling systems.
Energy data collected for DSF buildings were annual figures for years 2004 and 2005. The data was verified as far as possible by identifying any anomalies outside the expected range of results.
3. DETERMINANTS OF ENERGY PERFORMANCE
Energy benchmarking in DSF buildings is the statistical analysis of energy consumption related to one or more variables in order to allow a meaningful comparison between buildings with different DSF typologies, subject to different (internal and external) environments, management conditions, etc.
Determining the isolated influence of the DSF on the building’s energy consumption is an extremely complex task. Therefore, whenever the influence of the DSF in the buildings energy balance is significant an alternative approach is to assess the DSF technology indirectly using instead the whole building energy needs.
Buildings energy needs are (easily) obtained from energy billing accounting procedures. For purposes of comparing energy needs it is common to define indicators. A frequently used indicator is annual energy delivered per m2 useful pavement area, an indicator that normalizes energy consumption by building size. When this indicator is calculated for each building and the relative positions compared to the average of the sample, good and poor performers are easily identified.
Energy performance of buildings is determined by a wide range of factors, some of which are outside the control or influence of DSF technology, therefore data on the background, utilization and managing characteristics for each DSF building was also considered to understand their relative energy performance. The background characteristics are the climate or cultural, institutional and regulatory framework in which the building is built. The utilisation determinants are related to the use of the façade and building. The energy management determinants are related to the façade’s and buildings operational procedures, including systems and building management.
DSF building will depend also on internal gains and HVAC system used, therefore, some normalization has to be considered in order to account for these aspects. The normalization methods that were considered are presented in the following sections.
3.1 Climate Normalization
The normalization procedure that was considered in the energy benchmarking was based in the heating and cooling degree day method.
The degree day method considers that climatic conditions can be related to the temperature difference between a base indoor temperature and the outdoor temperature multiplied by the duration of the temperature difference. This can be expressed in the following equations for heating and cooling degree days (the summing is made for non negative values only).
(
−)
=
end
start
t
t
e base HDD
HDD θ _ θ ; =
(
−)
end
start
t
t
base CDD e
CDD θ θ _ Eqn. 1.1 ; Eqn.1.2
Where: HDD stands for heating degree days [ºC days]; CDD stands for cooling degree days [ºC days]; θHDD_base stands for the base heating season space
temperature [ºC]; θCDD_base stands for the base cooling season space temperature [ºC];
e
θ stands for the average outdoor temperature on daily basis [ºC]; tstart stands for the
starting day of heating or cooling season [day]; tend stands for the end day of heating
or cooling season [day].
In general the length of the heating and cooling season and the base space temperatures are defined at a national level and differ from country to country, therefore it was necessary to use a methodology that allowed for a European climate normalization level. This methodology considered the establishment of reference conditions for HDD and CDD values in different European cities. For these cities a computational model (Hurley, 2005) that considers actual climate data was used to determine average values of normalized heating degree days (HDDN) and cooling degree days (CDDN) from 2000 to 2006. In these calculations a 21ºC base indoor temperature for heating and cooling seasons was considered; it was also assumed that heating or cooling could occur during the entire year.
A reference for both the normalized HDD and CDD was defined (based on the HDDN and CDDN of the city closer to the average European HDDN and CDDN values) and a European climatic normalization factor was defined for each European city as below in Eqn.2.
City N
RefCity N City
HDD
HDD HDD
f ,
,
= ; NCity
RefCity N City
CDD
CDD CDD
f ,
,
= Eqn. 2.1 ; Eqn. 2.2
In terms of European city normalization of heating and cooling energy delivered to a space, the following Eqn.3 was considered.
City HDD Heat Deliv City
N Heat
Deliv Q f
Q , = , ⋅
, ;
City CDD Cool Deliv City
N Cool
Deliv Q f
Q , = , ⋅
Energy consumption data considered in Bestfaçade Project was obtained for different years, although in some cases computational simulation was used, so, a normalization procedure similar to the one presented for the European climate had to be considered to account for specific annual city climatic variations.
3.2 “Systems” Normalization
When comparing buildings energy performance, an important internal environment normalization that needs to be considered is the type of HVAC system (or the supply energy conversion system normalization). Since energy consumption magnitude that is used to determine the building energy performance indicator is the necessary delivered energy to maintain certain indoor environmental conditions and since the supplied energy relates to the delivered energy through a HVAC system (the supply energy conversion system), a supply-delivered energy conversion was considered. Values of HVAC systems efficiency may be obtained from pre-standard series DIN V 18599 or in Schmidt et al (2004).
Based on the above considerations the following normalization for the supply energy was established (for space heating or space cooling).
(
⋅ ⋅)
= PrimaryEquip HVACsystem Supply
Building
Delivered Q CF
Q η Eqn. 4
Where: Building Delivered
Q is the energy delivered in the building (heating and/or cooled) [kWh]; ip
PrimaryEqu Supply
Q is the energy supplied to the primary building equipments [units vary]; CF
is the type of energy conversion factor [units vary]; ηHVACsystem is the efficiency of the supply energy conversion system (or HVAC system) [non dimensional].
4. PRELIMINARY ANALYSIS
Preliminary results on ongoing studies have shown some general interesting features revealed by tendencies in benchmarking analysis. Raw energy data on heating and cooling demands for all the buildings, which supply useful data, highlight maximum values between 150 and 175kWh/m2a for heating and about 75 to 100kWh/m2a for cooling, and minimum values in the range 25 to 50kWh/m2a as one can see in Figure 2. These limits are alike in DSF and SSF buildings, but although all the DSF buildings are equipped with heating and cooling systems some of the SSF buildings in sample do not have any cooling system. As it was expected buildings all over Europe have bigger heating energy needs. But when taking in account the climate region the scenario should be quite different. Unfortunately this was not possible to do because the used sample of DSF buildings comprises 5 buildings in the Nordic and in the Mediterranean region and 4 in Moderate region. Very few data to make firm conclusions based on a benchmarking analysis.
correspond to a good energy performance for satisfaction of cooling needs. This could be associated with lack or ineffective shading devices or even with the impracticality of manual free-cooling by means of opening windows. Future work will focus in these more detailed aspects, as some few preliminary results for buildings in Mediterranean region shows that exists an interesting tendency to occur the opposite in terms of energy consumption, i.e., a tendency to the increase of heating demands to very high values.
0 50 100 150 200 250
0 1 2 3 4 5
E n er g y C o n su m p ti o n I n d ex [k W h /m 2a ]
DSF buildings SSF buildings
heating cooling heating cooling
Figure 2: Energy needs for heating and cooling purposes: Raw data.
0 100 200 300 400 500 600
0 1 2 3
E n er g y C o n su m p ti o n I n d ex C li m a te N o rm a li z e d [k W h /m 2a ]
DSF buildings
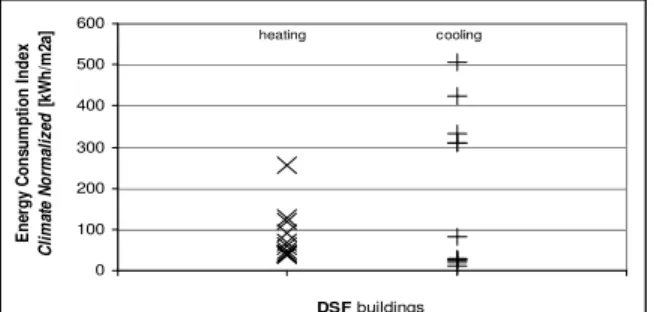
cooling heating
Figure 3: Energy needs for heating and cooling purposes: Climate normalized.
5. CONCLUSIONS
The work carried out so far and the experience gathered enables two main conclusions: The former is that it was very difficult to obtain sufficient data to perform detailed benchmarking and the latter is that the best solution is to perform generic benchmarking and set a scheme that allows for future collection of data and a continuous improvement of the benchmarking tool. Meanwhile a specific dedicated benchmarking can be made for successful DSF buildings.
References
Hurley, P.J. (2005). The Air Pollution Model (TAPM) version3. Part 1: Technical Description, CSIRO Atmospheric Research Technical Paper No.71, Australia.
Schmidt, F., Sucic, D., Khan, J., Haller, R., Wössner, S., Kluttig, H., Erhorn, H. Pietilainen, J., Cantin, R., Guarracino, G., and Mroz, T.M. (2004). Calculation Tools for the Energy Concept Adviser, Report of IEA ECBCS Annex 36: Retrofitting in Educational Buildings – REDUCE, Juli 2004.
Streicher, W. (2005). BESTFAÇADE – Best Practice for Double Skin Façades EIE/04/135/S07.38652: WP1 Report “State of the Art”, Reporting Period: 1.1.2005 – 31.12.2005.
With the support of EIE/04/135/S07.38652