Fermentation of Salted Shrimp (Saeu-Jeot) with Different
Salt Concentrations
Se Hee Lee, Ji Young Jung, Che Ok Jeon*
Department of Life Science, Research Center for Biomolecules and Biosystems, Chung-Ang University, Seoul, Republic of Korea
Abstract
To investigate the effects of salt concentration on saeu-jeot (salted shrimp) fermentation, four sets of saeu-jeot samples with 20%, 24%, 28%, and 32% salt concentrations were prepared, and the pH, bacterial and archaeal abundances, bacterial communities, and metabolites were monitored during the entire fermentation period. Quantitative PCR showed that Bacteriawere much more abundant thanArchaeain all saeu-jeot samples, suggesting that bacterial populations play more important roles than archaeal populations even in highly salted samples. Community analysis indicated that Vibrio, Photobacterium,Psychrobacter,Pseudoalteromonas, andEnterovibriowere identified as the initially dominant genera, and the bacterial successions were significantly different depending on the salt concentration. During the early fermentation period, Salinivibriopredominated in the 20% salted samples, whereasStaphylococcus,Halomonas, andSalimicrobiumpredominated in the 24% salted samples; eventually, Halanaerobium predominated in the 20% and 24% salted samples. The initially dominant genera gradually decreased as the fermentation progressed in the 28% and 32% salted samples, and eventually Salimicrobiumbecame predominant in the 28% salted samples. However, the initially dominant genera still remained until the end of fermentation in the 32% salted samples. Metabolite analysis showed that the amino acid profile and the initial glycerol increase were similar in all saeu-jeot samples regardless of the salt concentration. After 30–80 days of fermentation, the levels of acetate, butyrate, and methylamines in the 20% and 24% salted samples increased with the growth of Halanaerobium, even though the amino acid concentrations steadily increased until approximately 80–107 days of fermentation. This study suggests that a range of 24–28% salt concentration in saeu-jeot fermentation is appropriate for the production of safe and tasty saeu-jeot.
Citation:Lee SH, Jung JY, Jeon CO (2014) Microbial Successions and Metabolite Changes during Fermentation of Salted Shrimp (Saeu-Jeot) with Different Salt Concentrations. PLoS ONE 9(2): e90115. doi:10.1371/journal.pone.0090115
Editor:Hauke Smidt, Wageningen University, Netherlands
ReceivedSeptember 11, 2013;AcceptedJanuary 26, 2014;PublishedFebruary 28, 2014
Copyright:ß2014 Lee et al. This is an open-access article distributed under the terms of the Creative Commons Attribution License, which permits unrestricted use, distribution, and reproduction in any medium, provided the original author and source are credited.
Funding:This work was supported by the Technology Development Program for Agriculture and Forestry (TDPAF) of the Ministry for Agriculture, Food and Rural Affairs, Republic of Korea. The funders had no role in study design, data collection and analysis, decision to publish, or preparation of the manuscript.
Competing Interests:The authors have declared that no competing interests exist.
* E-mail: [email protected]
Introduction
Jeotgal, Korean traditional fermented seafood, is made by the fermentation of sea animals such as shrimp, anchovy, pollack intestines, corvina, and squid under high salt conditions. Jeotgal is consumed as fermented seafood by itself or as an additive to other foods such as kimchi to improve the taste (flavor) or fermentation efficiency. Processing of jeotgal by fermentation without the sterilization of raw materials leads to the growth of various microorganisms, derived from the raw materials, during fermen-tation [1,2]. It has been generally accepted that diverse microorganisms, includingBacteriaas well asArchaeaare involved in jeotgal fermentation because jeotgal is fermented under highly salted conditions, [3] and many studies have been performed to isolate Bacteria and Archaea to understand jeotgal fermentation processes [4–6]. At the time of writing, more than 25 novel bacterial and archaeal species have been isolated from jeotgal (http://bacterio.net) [7]. However, it has been recently reported thatArchaeamay not play important roles in jeotgal fermentation [8,9].
Culture-based approaches have been widely applied to com-munity analysis of fermented seafood [5–11], but these studies
and 1H NMR has been suggested to be one of the best ways to better understand the relationships between bacterial successions and metabolite changes during food fermentation [8,25–29].
Saeu-jeot, made by fermentation of tiny shrimp (Acetes japonicus), is the most representative and best-selling jeotgal in Korea. Saeu-jeot fermentation is processed under uncontrolled conditions without the sterilization of raw materials, which may cause the growth (or survival) of pathogens or putrefaction during fermen-tation. Therefore, saeu-jeot is generally fermented at low temperatures under highly salted conditions to prevent pathogenic growth and putrefaction. It has been generally thought that temperature and salt concentration are the most important factors to affect microbial growth and enzyme activity and low temperatures and high salt conditions lead to a long saeu-jeot fermentation time [30–32]. Many Korean companies have taken an interest in increasing fermentation temperature and reducing salt concentration to produce saeu- jeot economically. In the previous paper [9], the effects of fermentation temperature on saeu-jeot fermentation were investigated, but until now the effects of salt concentration on microbial successions and metabolite changes during saeu-jeot fermentation have not yet been explored. Therefore, the main objective of this study was to investigate the effects of different salt concentrates on saeu-jeot fermentation by investigating microbial successions and metabolite changes. This study may provide a greater understanding of saeu-jeot fermen-tation processes for the economical production of safe and high quality saeu-jeot.
Materials and Methods
Ethic Statement
A field test was not performed in this study. Salted saeu-jeot samples were prepared in the laboratory using shrimp that was bought from a market near the Yellow Sea in Korea. No specific permissions were required for this study because the shrimp was not protected or endangered species.
Preparation of saeu-jeot samples with different salt concentrations
Four sets of saeu-jeot samples with different salt concentrations [approximately 20%, 24%, 28%, and 32% (w/v)] were prepared in triplicate using shrimp (A.japonicas) as described previously [8,9]. Briefly, fresh tiny shrimp (about 4–6 cm in length) caught from the Yellow Sea in South Korea were equally dispensed into twelve plastic containers to include 1.5 kg shrimp and 307 g, 381 g, 461 g, and 548 g of solar salts (Shinan, Korea), and 600 ml of 20%, 24%, 28%, and 32% (w/v) solar salt solution were added to each container in triplicate, respectively. The four sets of saeu-jeot samples were incubated at 15uC. Four milliliters of saeu-jeot soups (liquid parts of saeu-jeot) were intermittently sampled from the twelve containers, and their pH values were measured. Large particles from the saeu-jeot soups were removed by filtration using four layers of sterile coarse gauze (Daehan, Korea), and microorganisms were harvested from the filtrates by centrifugation (8,000 rpm for 20 min at 4uC). Microorganisms harvested from three containers with the same salt concentration were combined and stored at 280uC for bacterial community analysis, but the supernatants were stored separately at 280uC for respective metabolite analyses. Two milliliters of saeu-jeot soups were also sampled and centrifuged for measuring 16S rRNA gene copies using quantitative real-time PCR (qPCR). The NaCl concentra-tions of the saeu-jeot samples with different salt concentraconcentra-tions were measured by titration with silver nitrate according to the Mohr method [33].
qPCR
The abundance ofBacteriaandArchaeain the saeu-jeot samples was estimated using qPCR according the method described previously with some modifications [8]. Briefly, 100 ng of salmon testes DNA (Sigma) was added as an exogenous and internal standard into the pellet derived from 2.0 ml of saeu-jeot soup, and the total genomic DNA was then extracted using a FastDNA Spin kit (MPbio, USA) according to the manufacturer’s instructions. To measure the total number of 16S rRNA gene copies inBacteriaand Archaea, two qPCR primer sets, bac340F/bac758R and arch109F/ arch344R [34,35], respectively, were used. Sample-to-sample variations caused by different genomic DNA recoveries and PCR amplification efficiencies were normalized on the basis of qPCR results using the primer set, Sketa2-F (59-GGT TTC CGC
AGC TGG G-39)/Sketa2-R (59-CCG AGC CGT CCT GGT
CTA-39), targeting the internal transcribed spacer region 2 of the rRNA gene operon in salmon testes DNA, as described previously [36]. The qPCR amplifications were conducted as described previously [25]. Two standard curves for the calculations of the bacterial and archaeal 16S rRNA gene copies were generated using pCR2.1 vectors (Invitrogen, USA) carrying bacterial (Salimicrobium) and archaeal (Halarchaeum) 16S rRNA genes derived from a saeu-jeot sample [8].
PCR amplification for barcoded pyrosequencing
Total genomic DNA of the combined pellets from the triplicate samples was extracted using the Fast-DNA Spin kit (MPbio) according to the instructions of the manufacturer. Bacterial 16S rRNA genes containing hypervariable regions were amplified using the universal primer set, Bac27F (59-adaptor B-AC-GAG
TTT GAT CMT GGC TCA G-39)/Bac541R (59-adaptor
A-X-AC-WTT ACC GCG GCT GCT GG-39), where X denotes
unique 7,11 barcode sequences inserted between the 454 Life Sciences adaptor A sequence and the common linker, AC (Table S1). All PCR amplifications were performed as described previously [37], and the PCR products were purified using a PCR purification kit (Bioneer, Korea). The purified PCR products were quantified using a SynergyMx ELISA reader equipped with a Take3 multivolume plate (BioTek, USA), and a composite sample for pyrosequencing was prepared by pooling equal amounts of the purified PCR products.
Pyrosequencing and data analysis
Pyrosequencing of the pooled sample was performed using a 454 GS-FLX Titanium instrument (Roche, Germany) at Macro-gen (Korea). Sequencing reads Macro-generated from the pyrosequencing were processed using the RDP pyrosequencing pipeline (http:// pyro.cme.msu.edu/)[38]. Sequencing reads were grouped by saeu-jeot sample based on their unique barcodes, and the barcodes were then removed. Sequencing reads with more than two ‘N’ (undetermined nucleotide), shorter than 300 bp read length, or average quality values below 20 (error rate 0.01) were excluded from further analysis. Putative chimeric reads were removed by the chimera.slayer command within the MOTHUR program [39]. The numbers of the high quality reads were normalized to the lowest number of reads (844 reads) by randomly deleting reads from the sequencing fasta files using a perl script calledselector.pl [41]. The original and normalized sequencing reads were aligned using the RDP pyrosequencing aligner and the resulting aligned sequences were clustered at a 3% dissimilarity level using the complete-linkage clustering tool. Rarefaction curves [40] from the original sequencing reads were generated by the RDP pyrose-quencing pipeline. Operational taxonomic units (OTU), Shannon-Weaver [41] and Chao1 indices [42], and evenness from the
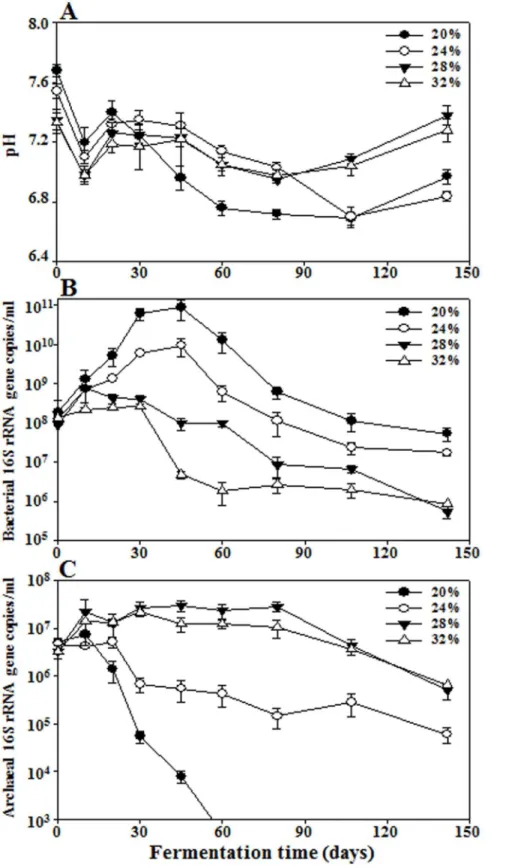
Figure 1. Profiles of pH (A) and bacterial (B) and archaeal (C) 16S rRNA gene copies in saeu-jeot samples with 20%, 24%, 28%, and 32% salt concentrations during saeu-jeot fermentation.Measurements of pH values and bacterial and archaeal 16S rRNA gene copies were performed in triplicate and the error bars represent the standard deviations.
original and normalized sequencing reads were calculated using the RDP pyrosequencing pipeline.
To compare bacterial successions in saeu-jeot samples with different salt concentrations, taxonomic assignments of the bacterial high quality reads were performed at the phylum and genus levels using the RDP naı¨ve Bayesian rRNA Classifier 2.5 trained on 16S rRNA training set 9 [43] at an 80% confidence threshold. The bacterial successions were confirmed using principal coordinate analysis (PCoA) based on representative sequences derived from the respective saeu-jeot samples. Briefly, the representative sequences were selected using CD-HIT [44], with an identity cutoff of 97%, and aligned using the RDP pyrosequencing pipeline based on the Silva database (v102). A neighbor-joining tree was constructed using the Kimura two-parameter model [45] within the PHYLIP software (ver. 3.68) and the NEXUS tree file was used as an input file for the weighted PCoA. The weighted PCoA was also performed using the sequencing data sets before and after removing singletons as described previously [46].
Metabolite analysis using 1H NMR and statistical redundancy analysis
The profiles of the metabolites, including amino acids, monosaccharides, organic acids, and methylamines, during the saeu-jeot fermentation were analyzed using a Varian Inova 600-MHz NMR spectrometer (Varian, USA) according to a method described previously [8]. Identification and quantification of individual metabolites from the1H NMR spectra were performed using the Chenomx NMR suite program (ver. 6.1, Chenomx, Canada) with 2,2-dimethyl-2-silapentane-5-sulfonate (DSS) as the
internal standard. To investigate the metabolite changes and their correlations with bacterial abundances during saeu-jeot fermenta-tion, statistical redundancy analysis (RDA) was performed using the vegan package [47] in the R programming environment (http://cran.r-project.org/) on the basis of all metabolites anno-tated from the1H NMR spectra and the bacterial abundances in saeu-jeot samples with different salt concentrations, which was plotted as a triplot.
Nucleotide sequence accession number
The pyrosequencing data of the 16S rRNA genes are publicly available in the NCBI Short Read Archive (SRA) under accession no. SRA039814.
Results
General features of saeu-jeot fermentation
Four sets of saeu-jeot samples with approximately 20%, 24%, 28%, and 32% (w/v) salt concentrations were incubated at 15uC for 142 days, and the NaCl concentrations were maintained at 19.961.1%, 24.760.3%, 28.161.1%, and 32.161.3% (w/v), respectively. The initial pH values of the saeu-jeot samples were approximately 7.3–7.7 (Fig. 1A). After the slight decrease of the pH values during the early fermentation period (day 10), the pH values increased a little for all saeu-jeot samples. After 20 days of fermentation, the pH values of the 20% and 24% salted samples decreased again to approximately pH 6.7, whereas those of the 28% and 32% salted samples were relatively constant.
A qPCR approach was used to estimate the abundance of BacteriaandArchaeain saeu-jeot samples. The initial bacterial 16S Figure 2. Rarefaction analysis of 16S rRNA gene sequences for the analysis of bacterial diversity in saeu-jeot samples with 20% (A), 24% (B), 28% (C), and 32% (D) salt concentrations during saeu-jeot fermentation.The rarefaction curves were constructed by the RDP pipeline at a 97% identity cutoff. The x- and y-axes indicate the numbers of sequencing reads sampled and the cumulative numbers of OTU (operational taxonomic units) recorded, respectively. Numbers beside the curves represent the fermentation time (days).
doi:10.1371/journal.pone.0090115.g002
rRNA gene copies were approximately 1.36108copies/ml. The
bacterial 16S rRNA gene copies increased during the early fermentation period in all saeu-jeot samples (Fig. 1B), but the increases were much greater in saeu-jeot samples with lower salt concentrations. The 16S rRNA gene copies of the 20% and 24% salted samples increased to the highest values of,8.861010and
9.56109copies/ml, respectively, at 45 days, while those of the
28% and 32% salted samples only increased to,7.86108 and
2.66108copies/ml, respectively. The initial 16S rRNA gene
copies of Archaea were approximately 4.06106copies/ml. The
archaeal 16S rRNA gene copies of the 28% and 32% salted samples increased during the early fermentation period although
Table 1.Summary of the barcoded pyrosequencing data sets derived from the saeu-jeot samples and statistical analysis of microbial diversity.
Subject Total reads High qualityreads Average readlength OTU* Shannon-Weaver* Chao1* Evenness*
Salt conc. Days
0 6866 4662 477 610 (177) 4.9 (4.3) 1013 (282) 0.76 (0.82)
10 12766 9353 490 714 (143) 4.3 (3.7) 1236 (358) 0.65 (0.74)
20 6231 3649 477 323 (119) 3.8 (3.2) 557 (227) 0.66 (0.67)
30 2170 1536 461 174 (125) 4.1 (3.8) 293 (201) 0.80 (0.80)
20% 45 2903 2249 439 215 (95) 4.1 (3.6) 333 (165) 0.76 (0.79)
60 3743 2892 435 229 (94) 4.1 (3.6) 397 (147) 0.76 (0.79)
80 6033 4328 476 161 (53) 2.9 (2.0) 251 (69) 0.56 (0.50)
107 1712 1348 442 150 (107) 3.9 (3.7) 244 (157) 0.78 (0.79)
142 1424 1129 432 131 (88) 3.9 (3.5) 193 (131) 0.80 (0.78)
0 5653 4105 477 518 (161) 4.8 (4.1) 918 (251) 0.77 (0.81)
10 2206 1718 484 187 (129) 3.5 (3.3) 295 (195) 0.66 (0.68)
20 4817 3252 474 188 (88) 3.2 (3.2) 300 (141) 0.61 (0.71)
30 6210 4564 473 280 (86) 3.5 (3.0) 444 (168) 0.62 (0.67)
24% 45 5129 3755 476 301 (99) 3.8 (3.1) 459 (135) 0.67 (0.67)
60 1732 1307 477 124 (94) 3.3 (3.6) 185 (147) 0.68 (0.79)
80 7700 5418 453 521 (143) 4.6 (3.9) 917 (247) 0.74 (0.78)
107 7228 5344 438 524 (145) 4.8 (4.1) 820 (226) 0.76 (0.82)
142 4108 3107 431 266 (109) 4.2 (3.6) 373 (232) 0.75 (0.76)
0 9769 6638 482 630 (172) 5.0 (4.2) 885 (302) 0.77 (0.82)
10 1432 1101 481 216 (180) 4.2 (4.1) 355 (323) 0.79 (0.80)
20 1914 1598 479 248 (163) 4.3 (3.9) 487 (279) 0.77 (0.78)
30 1062 888 482 182 (169) 4.1 (4.1) 437 (359) 0.79 (0.79)
28% 45 2972 2480 492 238 (118) 3.5 (3.2) 371 (190) 0.64 (0.68)
60 959 844 500 74 (74) 2.4 (2.4) 118 (118) 0.55 (0.55)
80 4397 3950 505 122 (38) 2.2 (1.7) 203 (53) 0.47 (0.46)
107 2482 1824 503 86 (52) 2.6 (2.4) 110 (91) 0.58 (0.61)
142 3408 2938 500 94 (51) 2.3 (2.4) 127 (68) 0.50 (0.62)
0 1478 1047 484 134 (112) 3.9 (3.7) 205 (155) 0.79 (0.79)
10 1635 1250 478 218 (165) 4.4 (4.2) 405 (307) 0.81 (0.83)
20 2202 1658 481 246 (155) 4.4 (4.2) 468 (243) 0.79 (0.83)
30 6191 4611 479 465 (152) 4.6 (3.9) 702 (350) 0.75 (0.78)
32% 45 1853 1542 488 301 (218) 4.3 (4.4) 584 (489) 0.76 (0.81)
60 3401 2477 479 309 (160) 4.4 (4.0) 451 (239) 0.77 (0.80)
80 1195 1007 480 197 (165) 4.3 (4.2) 370 (398) 0.82 (0.82)
107 1167 853 476 163 (158) 4.1 (4.1) 267 (247) 0.80 (0.80)
142 2530 2149 485 259 (152) 4.2 (3.8) 423 (339) 0.75 (0.75)
Abbreviation: OTU, operational taxonomic unit.
* The numbers of the high quality reads were normalized to 844 reads and OUT numbers and diversity indices from the original and normalized (in parentheses) sequencing reads were calculated by the RDP pyrosequencing pipeline.
the increases were not large, whereas those of the 20% and 24% salted samples decreased rapidly with a short lag time (Fig. 1C). The archaeal 16S rRNA gene copy number was much lower than the bacterial 16S rRNA gene copy number in the 20% and 24% salted samples during the entire fermentation period, as reported
previously [8,9]. The 16S rRNA gene copies of Bacteria were
higher than those ofArchaeain the 28% and 32% salted samples during the early fermentation period although the copy number of Archaea exceeded that of Bacteria during the late fermentation period.
Bacterial diversity in saeu-jeot samples with different salt concentrations
A total of 138,678 sequencing reads were obtained from barcoded pyrosequencing of 36 PCR amplicons for bacterial 16S rRNA genes. After trimming of the barcoded PCR primers and removal of the low-quality and chimera reads, a total of 102,571 high quality reads were obtained, with more than 473 bp average read length and an average of approximately 2,849 reads per sample. The rarefaction curves and microbial diversity indices were generated statistically for each sample (Fig. 2 and Table 1).
The rarefaction curves showed that the bacterial diversities in the 20% and 24% salted samples decreased during the early fermentation period (the decrease was faster in the 24% salted samples than in the 20% salted samples) and the diversities increased during the late fermentation period, whereas in the 28% salted samples the bacterial diversities were relatively constant during the early fermentation period and the diversities decreased continually until the late fermentation period. In the 32% salted samples, the bacterial diversities of the samples fermented were higher than those of the initial samples, indicating no evident bacterial growth. The OTU, Shannon-Weaver diversity estimates, and Chao1 nonparametric richness estimator (Table 1) also supported the results of the rarefaction curve analysis that bacterial community changes were different depending on the salt concentrations of the saeu-jeot samples.
Bacterial successions in saeu-jeot samples with different salt concentrations
The bacterial sequencing reads were classified at the phylum and genus levels (Fig. 3). At the phylum level, the phyla Proteobacteria and Firmicutes were predominant in all saeu-jeot Figure 3. Bacterial taxonomic compositions showing the bacterial successions of saeu-jeot samples with 20%, 24%, 28%, and 32% salt concentrations at the phylum (A) and genus levels during saeu-jeot fermentation.Others are composed of the phyla or the genera, each showing a percentage of reads,3.0% of the total reads in all samples of each panel.
doi:10.1371/journal.pone.0090115.g003
samples (Fig. 3A). Proteobacteria was predominant in the initial samples, but was rapidly replaced withFirmicutesas the fermen-tation progressed, as reported previously [8,9]. The bacterial succession generally occurred more rapidly under low salt conditions than under high salt conditions.Firmicutes predominat-ed, with more than 93% abundance after only 45 days in the 20% salted samples, whereas Proteobacteria remained as a dominant phylum until the end of fermentation in the 32% salted samples.
However, at day 10, Firmicutes increased more quickly with a
decrease ofProteobacteriain the 24% salted samples than in the 20% salted samples, even though Proteobacteria was maintained abun-dantly in the 24% salted samples until the late fermentation period.
The genus level analysis showed that Vibrio, Photobacterium, Phychrobacter, Enterovibrio, andPseudoalteromonasbelonging to Proteo-bacteria were dominant in the initial saeu-jeot samples, but the bacterial successions were significantly different depending on the salt concentrations (Fig. 3B). In the 20% salted samples, the initially dominant genera disappeared within only 10 days, and Salinivibrio became the most prevalent genus, followed by Staphylococcus, and eventually Halanaerobiumpredominated during the late fermentation period. The growth ofSalimicrobium, which was a predominant genus in other salt concentrations and in other studies [8,9], was not observed in the 20% salted samples. In the 24% salted samples, the initially dominant genera also disappeared quickly andStaphylococcus (of theFirmicutes) became predominant, explaining the rapid decrease ofProteobacteriaat 10 day sample in
the phylum level. Members ofHalomonasbelonging toProteobacteria were predominant after 20 days and remained even until the late fermentation period, which explained the high abundance of Proteobacteriaduring the late fermentation period compared to the 20% salted samples (Fig. 3A). Eventually,Halanaerobium became predominant during the late fermentation period, similar to the 20% salted samples. In the 28% salted samples, the initially dominant genera, except forPhychrobacter, gradually decreased as the fermentation progressed; Salimicrobium became predominant after 45 days (Fig. 3B). In the 32% salted samples, the initially dominant genera remained until the end of the fermentation and the bacterial community was not predominated by particular genera, which might suggest thatBacteriadid not grow well in 32% salted samples. In the 28% and 32% salted samples, the growth of Salinivibrio,Staphylococcus,Halomonas, andHalanaerobium, which were predominant in the 20% and 24% salted samples, was not observed.
PCoA also supported the successional patterns ofBacteria(Fig. 4). The bacterial successions in the 20% and 24% salted samples occurred quite differently from 10 days of fermentation, but eventually the bacterial communities became similar during the late fermentation period. Bacterial successions in the 28% and 32% salted samples occurred similarly, but the bacterial succession in the 28% salted samples occurred more rapidly than in the 32% salted samples. Because it has been demonstrated that community analyses can be biased by noises associated with singletons [46], PCoA was also performed using the sequence data sets without Figure 4. The weighted principle coordinate analysis (PCoA) plot showing the bacterial successions in saeu-jeot samples with 20%, 24%, 28%, and 32% salt concentrations during saeu-jeot fermentation.Numbers beside the symbols represent the fermentation time (days). The curved arrows indicate the routes of the bacterial successions on the PCoA plot during saeu-jeot fermentation. Saeu-jeot samples inside the circle includedHalanaerobiumas the predominant genus.
singletons representing 0.6,10.0% of the high quality reads; the analysis showed that the presence of singletons did not affect the PCoA results (data not shown).
Metabolite changes in saeu-jeot samples with different salt concentrations
A1H NMR technique was applied to analyze metabolites such as amino acids, nitrogen compounds, organic acids, and methyl-amines in saeu-jeot samples. Interestingly, the concentrations of amino acids increased in all saeu-jeot samples as the fermentation progressed regardless of salt concentrations (Fig. 5). However, the
concentration-fermentation time profiles of some amino acids and nitrogen compounds were a little different depending on the salt concentrations. The concentrations of arginine and lysine increased more rapidly during the early fermentation period in the saeu-jeot samples with lower salt concentrations; however, after the rapid increase, the concentration of these amino acids decreased rapidly.
Glycerol, acetate, butyrate, and lactate were identified as the primary carbonic compounds in saeu-jeot fermentation (Fig. 6). Interestingly, the glycerol level increased rapidly in all saeu-jeot samples, regardless of the salt concentrations, during the early Figure 5. Changes in the major amino acids and nitrogen compounds identified from saeu-jeot samples with 20%, 24%, 28%, and 32% salt concentrations during saeu-jeot fermentation.Data are presented as average values6standard deviations, measured in triplicate. doi:10.1371/journal.pone.0090115.g005
fermentation period (Fig. 6A), and the glycerol level decreased quickly in the 20% and 24% salted samples after approximately 20 days and 60 days, respectively. However, in the 28% and 32% salted samples, the glycerol level was relatively constant until the end of fermentation. The levels of acetate and butyrate increased quickly in the 20% and 24% salted samples after approximately 20 days and 60 days, respectively (Figs. 6B and C), which was related to the glycerol decrease. However, in the 28% and 32% salted samples, the concentrations of acetate and butyrate were very low until the end of the fermentation. The lactate concentrations in all saeu-jeot samples were almost constant over the entire fermenta-tion period (Fig. 6D). Methylamines, including trimethylamine (TMA) and dimethylamine (DMA), which cause the unique odors of fermented fish products, are generated by the reduction and/or
demethylation of trimethylamine N-oxide (TMAO) [48]. In the
20% salted samples, TMAO rapidly decreased after approximate-ly 20 days, with an increase in TMA and DMA (Figs. 6E, F, and
G). In the 24% salted samples, TMAO also decreased with an increase in TMA, but an increase in DMA rarely occurred. However, in the 28% and 32% salted samples, the concentration of TMAO was almost constantly maintained, without the increase in TMA and DMA, until the end of the fermentation. To statistically assess the metabolite changes during the fermentation, RDA was performed on the basis of metabolites and bacterial abundances of the saeu-jeot samples (Fig. 7). The RDA triplot showed that the metabolite changes occurred similarly, with rapid rates during the early fermentation period, independent of the salt concentration. However, the RDA triplot also demonstrated that the metabolite profiles of the 20% and 24% salted samples during the late fermentation period were distinct from those of the other samples by the production of acetate, butyrate, dimethylamine, and trimethylamine, which were clearly related to the growth of Halanaerobiumin the 20% and 24% saeu-jeot samples during the late fermentation stage (Fig. 7).
Figure 6. Changes in major organic compounds [glycerol (A), acetate (B), butyrate (C), and lactate (D)] and methylamines [trimethylamineN-oxide (E), trimethylamine (F), and dimethylamine (G)] identified from saeu-jeot samples with 20%, 24%, 28%, and 32% salt concentrations during saeu-jeot fermentation.Data are presented as average values6standard deviations, measured in triplicate.
Discussion
It is generally thought thatBacteriaandArchaeaplay important roles in jeotgal fermentation because jeotgal is fermented under highly salted [20–32% (w/w)] conditions [3]. Isolation of novel archaeal species from fermented jeotgal (http://bacterio.net) [7] and functional roles of archaeal members such as histamine degradation and improved organoleptic acceptance in salted fermented seafood [49,50] have been also reported. However, it was recently reported thatArchaeaare much less important than Bacteria in jeotgal fermentation [8,9]. Our qPCR analysis also showed thatBacteriawere more abundant thanArchaeain all saeu-jeot samples, for all salt concentrations (Figs. 1B and C), suggesting that bacterial members may make a greater contribution to jeotgal fermentation than archaeal members even in high salt conditions (28% and 32%). However, in highly salted saeu-jeot samples the archaeal abundance increased, whereas the bacterial abundance decreased. This observation suggests thatArchaeamay play more important roles in highly salted jeot than in lower salted saeu-jeot.
Community analysis was performed for onlyBacteria because Bacteria were in greater abundance than Archaea in all salted samples. Bacterial community and metabolite analyses showed that the growth of Halanaerobium, observed only in the 20% and 24% salted samples during the late saeu-jeot fermentation period, was associated with the metabolism of glycerol and TMAO as well as the production of acetate, butyrate, TMA, and DMA as
reported previously (Figs. 3B, 4, 6, and 7) [8,9].Halanaerobiumis a potential indicator for the putrefaction or over-fermentation of seafood by the production of acetate, butyrate, and methylamines [8,9,51]. BecauseHalanaerobiumbecame predominant after 30–80 days of fermentation in the 20% and 24% salted samples (Fig. 3B), saeu-jeot fermentation should be stopped within 30–80 days to produce good quality saeu-jeot. In the 28% salted samples, the initially dominant genera Vibrio, Photobacterium, Psychrobacter, Pseudoalteromonas, and Enterovibrio, which may include potentially pathogenic strains [52], decreased as the fermentation progressed. Salimicrobium, known as a genus of non-pathogenic bacteria, predominated during the late fermentation period (Fig. 3B). During the late fermentation period, the bacterial diversity was quite low (the asymptotes nearly converged, Fig. 2C), suggesting that Salimicrobium predominated, with the extinction of initially dominant genera. However, in the 32% salted samples, the initially dominant genera still remained as dominant genera, even until the end of fermentation (Fig. 3B). These results suggest that 32% salt concentration may not be appropriate for the production of safe saeu-jeot.
The generation of amino acids from proteins by proteolysis during seafood fermentation is important because it influences taste and flavor [30,53–55]. The concentration of amino acids steadily increased until approximately 80–107 days of the saeu-jeot fermentation at all salt concentrations, which indicated that the concentration of amino acids affecting saeu-jeot taste in the 20% salted samples increased continually, even after the appearance of Figure 7. An RDA (redundancy analysis) triplot showing correlations among saeu-jeot samples, bacterial abundances, and metabolite concentrations during fermentation of saeu-jeot with 20%, 24%, 28%, and 32% salt concentrations.Numbers beside the symbols represent the fermentation time (days). The primary organic compounds and methylamines are highlighted in bold, and the directions and lengths of the straight arrows indicate their influences on the jeot samples. The curved arrow indicates the route of metabolite changes in saeu-jeot samples on the RDA triplot during saeu-saeu-jeot fermentation. Saeu-saeu-jeot samples inside the circle contained acetate, butyrate, TMA, and DMA as the major products.
doi:10.1371/journal.pone.0090115.g007
Halanaerobium (30 days) and the production of acetate, butyrate, and methylamines. These results suggest that saeu-jeot with 20% salt concentration may not be appropriate in view of the production of good quality and tasty saeu-jeot. The fermentation of the 24% salted saeu-jeot might be stopped within 80 days before Halanaerobiumdominated, while the fermentation of the 28% salted saeu-jeot might be progressed at least for 80 days, maximizing amino acid concentrations, until the initially dominant genera disappeared. These results suggest that a salt concentration in the range of 24–28% in saeu-jeot fermentation may be appropriate for the production of safe and tasty saeu-jeot based on the bacterial community and metabolite composition.
Interestingly, our metabolite analysis showed that the profiles of amino acids were relatively similar during the entire saeu-jeot fermentation period, regardless of the salt concentrations. How-ever, the bacterial growth and successions were considerably different depending on the salt concentration, suggesting that proteolysis to amino acids might not be related to the bacterial population (Figs. 1B and 5). Previous results also showed that bacterial proteinases isolated from saeu-jeot had very weak proteinase activities under high salt conditions [5,56]. Besides the concentrations of the amino acids, the level of glycerol, which might be derived from lipid hydrolysis, also increased with a similar rate regardless of the salt concentrations during the early fermentation period (Fig. 6A), which indicated that the increase might not be related to the bacterial population. Diverse
endogenous enzymes such as carboxypeptidase A and B, chymotrypsin, cathepsin, and lipase have been identified from shrimp or fish [22,57–59], but the activities of the endogenous enzymes have not been tested under high salt conditions. Therefore, further studies will be necessary to investigate whether these endogenous enzymes are responsible for the increase in amino acids and glycerol during the saeu-jeot fermentation.
To the best of our knowledge, this was the first study to investigate the effects of salt concentration on the microbial succession and metabolite changes during saeu-jeot fermentation. However, additional studies of the relationship among microbial communities, metabolites, sensory characteristics (e.g., taste and flavor), and food safety are necessary to produce high quality and tasty saeu-jeot.
Supporting Information
Table S1
primer sets used in this study. (DOCX)
Author Contributions
Conceived and designed the experiments: COJ. Performed the experi-ments: SHL. Analyzed the data: JYJ. Contributed reagents/materials/ analysis tools: COJ. Wrote the paper: SHL COJ.
References
1. Lee CH (1993) Fish fermentation technology in Korea. In Fish fermentation technology. Seoul: United Nations University Press.
2. Hur SH (1996) Critical review on the microbiological standardization of salt-fermented fish product. J Korean Soc Food Sci Nutr 25: 885–891.
3. Roh SW, Kim KH, Nam YD, Chang HW, Park EJ, et al. (2010) Investigation of archaeal and bacterial diversity in fermented seafood using barcoded pyrosequencing. ISME J 4: 1-16. doi:10.1038/ismej.2009.83 PubMed: 19587773.
4. Roh SW, Lee ML, Bae JW (2009)Haladaptatus cibariussp. nov., an extremely halophilic archaeon from seafood, and emended description of the genus Haladaptatus. Int J Syst Evol Microbiol 60: 1187–1190. doi: 10.1099/ ijs.0.013037-0 PubMed: 19667394.
5. Guan L, Cho KH, Lee JH (2011) Analysis of the cultivable bacterial community in jeotgal, a Korean salted and fermented seafood, and identification of its dominant bacteria. Food Microbiol 28: 101–113. doi: 10.1016/j.fm.2010.09.001 PubMed: 21056781.
6. Choi EJ, Lee SH, Jung JY, Jeon CO (2013)Brevibacterium jeotgalisp. nov., isolated from jeotgal, a traditional Korean fermented seafood. Int J Syst Evol Microbiol 63: 3430–3414. doi:10.1099/ijs.0.049197-0 PubMed: 23543497.
7. Euze´by JP (1997) List of bacterial names with standing in nomenclature: a folder available on the internet. Int J Syst Bacteriol 47: 590–592. doi: 10.1099/ 00207713-47-2-590 PubMed: 9103655.
8. Jung JY, Lee SH, Lee HJ, Jeon CO (2013) Microbial succession and metabolite changes during fermentation of saeu-jeot, traditional Korean salted seafood. Food Microbiol 34: 360–368. doi: 10.1016/j.fm.2013.01.009 PubMed: 23541203.
9. Lee SH, Jung JY, Jeon CO (2014) Effects of temperature on microbial succession and metabolite change during saeu-jeot fermentation. Food Microbiol 38: 16– 25.
10. Kim MS, Park EJ, Jung MJ, Roh SW, Bae JW, et al. (2009) Analysis of prokaryote communities in Korean traditional fermented food, jeotgal, using culture-dependent method and isolation of a novel strain. Korean J Microbiol 45: 26–31.
11. An D, Lee JH (2011) Isolation of bacteria from Jeotgal using high-salt-content media and their growths in high-salt condition. Korean J Microbiol Biotechnol 39: 294–300.
12. An C, Takahashi H, Kimura B, Kuda T (2010) Comparison of PCR-DGGE and PCR-SSCP analysis for bacterial flora of Japanese traditional fermented fish products,aji-narezushiandiwashi-nukazuke. J Sci Food Agric 90: 1796–1801. doi: 10.1002/jsfa.4015 PubMed: 20572057.
13. Broekaert K, Heyndrickx M, Herman L, Devlieghere F, Vlaemynck G (2011) Seafood quality analysis: Molecular identification of dominant microbiota after ice storage on several general growth media. Food Microbiol 28: 1162–1169. doi: 10.1016/j.fm.2011.03.009 PubMed: 21645815.
14. Matsui H, Tsuchiya R, Isobe Y, Narita M (2013) Analysis of bacterial community structure inSaba-Narezushi(Narezushiof Mackerel) by 16S rRNA gene clone library. J Food Sci Technol 50: 791–796. doi: 10.1007/s13197-011-0382-4 15. Humblot C, Guyot J (2009) Pyrosequencing of tagged 16S rRNA gene amplicons for rapid deciphering of the microbiomes of fermented foods such as pearl millet slurries. Appl Environ Microbiol 75:4354–4361. doi: 10.1128/ AEM.00451-09 PubMed: 19411407.
16. Dobson A, O’Sullivan O, Cotter PD, Ross P, Hill C (2011) High-throughput sequence-based analysis of the bacterial composition of kefir and an associated kefir grain. FEMS Microbiol Lett 320: 56–62. doi: 10.1111/j.1574-6968.2011.02290.x PubMed: 21517943.
17. Sakamoto N, Tanaka S, Sonomoto K, Nakayama J (2011) 16S rRNA pyrosequencing-based investigation of the bacterial community in nukadoko, a pickling bed of fermented rice bran. Int J Food Microbiol 144: 352–359. doi: 10.1016/j.ijfoodmicro.2010.10.017 PubMed: 21084126.
18. Kiyohara M, Koyanagi T, Matsui H, Yamamoto K, Take H, et al. (2012) Changes in microbiota population during fermentation ofnarezushias revealed by pyrosequencing analysis. Biosci Biotechnol Biochem 76: 48–52. doi: dx.doi.org/10.1271/bbb.110424 PubMed: 22232244.
19. Quigley L, O’Sullivan O, Beresford TP, Ross RP, Fitzgerald GF, et al. (2012) High-throughput sequencing for detection of subpopulations of bacteria not previously associated with artisanal cheeses. Appl Environ Microbiol 76: 5717– 5723. doi: 10.1128/AEM.00918-12 PubMed: 22685131.
20. Ercolini D (2013) High-throughput sequencing and metagenomics: moving forward in the culture-independent analysis of food microbial ecology. Appl Environ Microbiol 79: 3148–3155. doi: 10.1128/AEM.00256-13 PubMed: 23475615.
21. Saisithi P (1994) Traditional fermented fish: fish sauce production. In: Martin AM, editor. Fisheries processing biotechnological application. London, U.K.: Chapman & Hall. p 111–131.
22. Yongsawatdigul J, Rodtong S, Raksakulthai N (2007) Acceleration of Thai fish sauce fermentation using proteinases and bacterial starter cultures. J Food Sci 72: M382–M390. doi: 10.1111/j.1750-3841.2007.00532.x PubMed: 18034732. 23. Eakpetch P, Benjakul S, Visessanguan W, Kijroongrojana K (2008) Autolysis of Pacific white shrimp (Litopenaeus vannamei) meat: characterization and the effects of protein additives. J Food Sci 73: S95–S103. doi: 10.1111/j.1750-3841.2007.00630.x PubMed: 18298747.
24. Ercolini D, Ferrocino I, Nasi A, Ndagijimana M, Vernocchi P, et al. (2011) Monitoring of microbial metabolites and bacterial diversity in beef stored under different packaging conditions. Appl Environ Microbiol 77: 7372–7381. doi: 10.1128/AEM.05521-11 PubMed: 21803905.
25. Figueiredo IM, Pereira NR, Efraim P, Garcı´a NHP, Rodrigues NR, et al. (2006) 1
H NMR, a rapid method to monitor organic acids during cupuassu (Theobroma grandiflorum Spreng) processing. J Agric Food Chem 54: 4102–4106. doi: 10.1021/jf0525176 PubMed: 16756332.
. List of adapter and barcode sequences in the PCR
26. Jung JY, Lee SH, Kim JM, Park MS, Bae JW, et al. (2011) Metagenomic analysis of kimchi, a traditional Korean fermented food. Appl Environ Microbiol 77: 2264–2274. doi: 10.1128/AEM.02157-10 PubMed: 21317261.
27. Jung JY, Lee SH, Lee HJ, Seo HY, Park WS, et al. (2012) Effects ofLeuconostoc mesenteroidesstarter cultures on microbial communities and metabolites during kimchi fermentation. Int J Food Microbiol 153: 378–387. doi: 10.1016/ j.ijfoodmicro.2011.11.030 PubMed: 22189023.
28. Jeong SH, Jung JY, Lee SH, Lee HJ, Seo HY, et al. (2012) Effects of red pepper powder on microbial communities and metabolites during kimchi fermentation. Int J Food Microbiol 160: 252–259. doi: 10.1016/j.ijfoodmicro.2012.10.015 PubMed: 23290232.
29. Jeong SH, Jung JY, Lee SH, Jin HM, Jeon CO (2013) Microbial succession and metabolite changes during fermentation of dongchimi, traditional Korean watery kimchi. Int J Food Microbiol 164: 46–53. doi: 10.1016/j.ijfoodmi-cro.2013.03.016 PubMed: 23587713.
30. Mok CK, Lee JY (2000) Changes in physicochemical properties of salted and fermented shrimp at different salt levels. Korean J Food Sci Technol 32: 187– 191.
31. Gildberg A, Thongthai C (2001) The effect of reduced salt content and addition of halophilic lactic acid bacteria on quality and composition of fish sauce made from sprat. J Aqua Food Prod 10: 77–88. doi: 10.1300/J030v10n01_07 32. Paludan-Mu¨ller C, Madsen M, Sophanodora P, Gram L, Møller PL (2002)
Fermentation and microflora ofplaa-som, a thai fermented fish product product prepared with different salt concentrations. Int J Food Microbiol 73: 61–70. doi: 10.1016/S0168-1605(01)00688-2 PubMed: 11883675.
33. AOAC (2000) Official methods of analysis, 17th ed. Association of Official Analytical Chemists. Washington, D.C., USA.
34. Juck D, Charles T, Whyte LG, Greer CW (2000) Polyphasic microbial community analysis of petroleum hydrocarbon-contaminated soils from two northern Canadian communities. FEMS Microbiol Ecol 33: 241–249. doi: 10.1111/j.1574-6941.2000.tb00746.x PubMed: 11098075.
35. Ji G, Tong J, Tan Y (2011) Wastewater treatment efficiency of a multi-media biological aerated filter (MBAF) containing clinoptilolite and bioceramsite in a brick-wall embedded design. Bioresour Technol 102: 550–557. doi: 10.1016/ j.biortech.2010.07.075 PubMed: 20797854.
36. Haugland RA, Siefring SC, Wymer LJ, Brenner KP, Dufour AP (2005) Comparison of Enterococcus measurements in freshwater at two recreational beaches by quantitative polymerase chain reaction and membrane filter culture analysis. Water Res 39: 559–568. doi:10.1016/j.watres.2004.11.011 PubMed: 15707628.
37. Lee HJ, Jung JY, Oh YK, Lee SS, Madsen EL, et al. (2012) Comparative survey of rumen microbial communities and metabolites across one caprine and three bovine groups, using bar-coded pyrosequencing and 1
H nuclear magnetic resonance spectroscopy. Appl Environ Microbiol 78: 5983–5993. doi: 10.1128/ AEM.00104-12 PubMed: 22706048.
38. Cole JR, Wang Q, Cardenas E, Fish J, Chai B, et al. (2009) The Ribosomal Database Project: improved alignments and new tools for rRNA analysis. Nucleic Acids Res 37: D141–D145. doi: 10.1093/nar/gkn879 PubMed: 19004872.
39. Schloss PD, Westcott SL, Ryabin T, Hall JR, Hartmann M, et al. (2009) Introducing mother: open-source, platform-independent, community-supported software for describing and comparing microbial communities. Appl Environ Microbiol 75: 7537–7541. doi: 10.1128/AEM.01541-09 PubMed: 19801464. 40. Colwell RK, Coddington JA (1994) Estimating terrestrial biodiversity through
extrapolation. Philos Trans R Soc Lond B Biol Sci 345: 101–118. doi: 10.1098/ rstb.1994.0091 PubMed: 7972351.
41. Shannon CE, Weaver W (1963) The Mathematical Theory of Communication. University of Illinois Press. Urbana.
42. Chao A, Bunge J (2002) Estimating the number of species in a stochastic abundance model. Biometrics 58: 531–539. doi: 10.1111/j.0006-341X.2002.00531.x PubMed: 12229987.
43. Wang Q, Garrity GM, Tiedje JM, Cole JR (2007) Naı¨ve Bayesian classifier for rapid assignment of rRNA sequences into the new bacterial taxonomy. Appl Environ Microbiol 73: 5264–5267. doi: 10.1128/AEM.00062-07 PubMed: 17586664.
44. Li W, Godzik A (2006) Cd-hit: a fast program for clustering and comparing large sets of protein or nucleotide sequences. Bioinformatics 22: 1658–1659. doi: 10.1093/bioinformatics/btl158 doi:10.1093/bioinformatics/btl158 PubMed: 16731699.
45. Felsenstein J (2002) PHYLIP (Phylogeny Inference Package), version 3.6a. Department of Genetics, Washington: University of Washington.
46. Zhou J, Wu L, Deng Y, Zhi X, Jiang YH, et al. (2011) Reproducibility and quantitation of amplicon sequencing-based detection. ISME J 5: 1303–1313. doi: 10.1038/ismej.2011.11 PubMed: 21346791.
47. Oksanen J, Blanchet FG, Kindt R, Legendre P, O’Hara RB, et al. (2011) Vegan, community ecology package. .R package version 1.17-12. Available: http:// cran.r-project.org/package = vegan Accessed 2011 Aug 18.
48. Kimura M, Kimura I, Seki N (2003) TMAOase, trimethylamine-N-oxide demethylase, is a thermostable and active enzyme at 80uC. Fisheries Science 69: 414–420. doi: 10.1046/j.1444-2906.2003.00637.x
49. Aponte M, Blaiotta G, Francesca N, Moschetti G (2010) Could halophilic archaea improve the traditional salted anchovies (Engraulis encrasicholusL.) safety and quality? Lett Appl Microbiol 51: 697–703. doi: 10.1111/j.1472-765X.2010.02956.x PubMed: 21054448.
50. Tapingkae W, Tanasupawat S, Parkin KL, Benjakul S, Visessanguan W (2010) Degradation of histamine by extremely halophilic archaea isolated from high salt-fermented fishery products. Enzyme Microb Tech 46: 92–99. doi:10.1016/ j.enzmictec.2009.10.011
51. Kivisto¨ A, Santala V, Karp M (2011) Closing the 1,3-propaediol route enhances hydrogen production fron glycerol by Halanaerobium saccharolyticum supsp. saccharolyticum. Int J of Hydrogen Energ 36: 7074–7080. doi: 10.1016/ j.ijhydene.2011.03.012
52. Lo´pez JR, Navas JI, Thanantong N, de la Herran R, Sparagano OAE (2012) Simultaneous identification of five marine fish pathogens belonging to the genera Tenacibaculum,Vibrio,PhotobacteriumandPseudomonasby reverse line blot hybridiza-tion. Aquaculture 324–325: 33–38. doi: 10.1016/j.aquaculture.2011.10.043 53. Chung SY, Lee EH (1976) The taste compounds of fermentedAcetes chinensis.
Bull Korean Fish Soc 9: 79–110.
54. Kim BM (1988) Changes in the properties of protein during the fermentation of salted shrimp. Korean J Food Sci Technol 20: 883–889.
55. Lapsongphon N, Cadwallader KR, Rodtong S, Yongsawatdigul J (2013) Characterization of protein hydrolysis and odor-active compounds of fish sauce inoculated withVirgibacillussp. SK37 under reduced salt content. J Agric Food Chem 61: 6604–6613. doi: 10.1021/jf4014923 PubMed: 23768048. 56. Nam EJ, Yang CB, Oh SW, Jo JH, Kim YM (1998) Purification and
characterization of alkaline protease from saewoo-jeot, salted and fermented shrimp (Acetes japonicus). Korean J Food Sci Technol 30: 82–89.
57. Herna´ndez-Corte´s P, Whitaker JR, Garcı´a-Carren˜o FL (1997) Purification and characterization of chymotrypsin fromPenaeus vannamei(Crustacea: Decapoda). J Food Biochemistry 21: 497–514. doi: 10.1111/j.1745-4514.1997.tb00202.x 58. Shahidi F, Kamil JY (2001) Enzymes from fish and aquatic invertebrates and
their application in the food industry. Trends Food Sci Tech 12: 435–464. doi: 10.1016/S0924-2244(02)00021-3
59. Sila A, Nasri R, Bougatef A, Nasri M (2012) Digestive alkaline proteases from the goby (Zosterise ophiocephalus): characterization and potential application as detergent additive and in the deproteinization of shrimp wastes. J Aquat Food Prod Technol 21: 118–133.
![Figure 6. Changes in major organic compounds [glycerol (A), acetate (B), butyrate (C), and lactate (D)] and methylamines [trimethylamine N -oxide (E), trimethylamine (F), and dimethylamine (G)] identified from saeu-jeot samples with 20%, 24%, 28%, and 32%](https://thumb-eu.123doks.com/thumbv2/123dok_br/18389153.357322/9.918.96.662.88.706/changes-compounds-glycerol-methylamines-trimethylamine-trimethylamine-dimethylamine-identified.webp)
