ISSN 0104-6632 Printed in Brazil
www.abeq.org.br/bjche
Vol. 32, No. 01, pp. 13 - 22, January - March, 2015 dx.doi.org/10.1590/0104-6632.20150321s00003099
Brazilian Journal
of Chemical
Engineering
STATISTICAL OPTIMIZATION OF MINERAL
SALT AND UREA CONCENTRATION FOR
CELLULASE AND XYLANASE PRODUCTION
BY Penicillium echinulatum IN SUBMERGED
FERMENTATION
L. dos Reis, C. E. T. Ritter, R. C. Fontana, M. Camassola and A. J. P. Dillon
*Enzymes and Biomass Laboratory,Institute of Biotechnology, University of Caxias do Sul, Rua Francisco Getúlio Vargas, 1130, 95070-560, Caxias do Sul - RS, Brazil.
Phone / Fax: + (55) (54) 3218 2149 E-mail: [email protected]
(Submitted: November 7, 2013 ; Revised: March 14, 2014 ; Accepted: March 18, 2014)
Abstract - Penicillium echinulatum S1M29 is a mutant with cellulase and xylanase production comparable to the most studied microorganisms in the literature. However, its potential to produce these enzymes has not been fully investigated. This study aimed at optimizing salt and urea concentrations in the mineral solution, employing the response surface methodology. A 25-1 Fractional Factorial Design and a 23 Central Composite Design were applied to elucidate the effect of salts and urea in enzyme production. Lower concentrations of KH2PO4 (2.0 g.L
-1
), (NH4)2SO4 (1.4 g.L -1
), MgSO4.7H2O (0.375 g.L -1
) and CaCl2 (0.375 g.L -1
) were most suitable for the production of all enzymes evaluated. Nevertheless, higher concentrations of urea (0.525 g.L-1) gave the best results for cellulase and xylanase production. The maximum FPase (1,5 U.m.L-1), endoglucanase (7,2 U.m.L-1), xylanase (30,5 U.m.L-1) and β-glucosidase (4,0 U.m.L-1) activities obtained with the planned medium were, respectively, 87, 16, 17 and 21% higher when compared to standard medium. The experimental design contributed to adjust the concentrations of minerals and urea of the culture media for cellulase and xylanase production by P. echinulatum, avoiding waste of components in the medium.
Keywords: Cellulolytic enzyme; Experimental design; Medium composition; Shake flask.
INTRODUCTION
Lignocellulosic biomass is an abundant and re-newable source of carbohydrates for microbial con-version to chemicals and fuels (Geddes et al., 2011). Cellulose, the principal constituent of plant biomass, is a linear polymer of glucose units, which can be hydrolyzed by the action of endogluconases, cello-biohydrolases and β-glucosidases (Ahamed and Vermette, 2008). Cellulose consists of linear chains
Ethanol produced from renewable biomass is at-tracting attention as an alternative energy source. However, during the production of ethanol from lig-nocellulosic biomass, the main problems are related to hydrolysis (Kang et al., 2004). The large amount of enzyme required for enzymatic conversion of hemicelluloses and cellulose to fermentable sugars severely impacts the cost effectiveness of this tech-nology (Xiros and Christakopoulos, 2009).
Cellulase and xylanase production can be con-ducted by submerged fermentation technology (SmF) or solid-state fermentation (SSF). According to the literature, SmF is the most used technology for mi-crobial production of cellulases (Sukumaran et al., 2005). A submerged fungal culture is recognized as a complex multiphase, multicomponent process where cell growth and product formation are influenced by a large number of operating parameters, such as cul-ture broth composition, temperacul-ture, pH, shear stress, initial inoculum, dissolved oxygen, rheology and fun-gal morphology (Patel et al., 2009). It is a well-es-tablished fact that optimization of culture medium and culture conditions influence enzyme production (Juhász et al., 2005; Shanmugam et al., 2008).
Filamentous fungi are the major source of cellu-lases and hemicellucellu-lases (Gusakov et al., 2007). Sev-eral fungal species belonging to the genera Penicil-lium should be considered for the production of sec-ond-generation biofuels (Gusakov, 2011).
Penicil-lium echinulatum has been identified as a potential
candidate for cellulase and xylanase production be-cause its secreting capacity is almost equivalent to the best T. reesei strains (Camassola and Dillon, 2010; Dillon et al., 2006).
Statistical methods have also been designed for bioprocess optimization (Cheng et al., 2012; Coelho
et al., 2011; Singh and Kaur, 2012). Combinatorial
interactions of process variables with the production of the desired compound are numerous and the opti-mum processes may be developed using an effective experimental design procedure (Muthuvelayudham and Viruthagiri, 2010). Response Surface Methodol-ogy is one of the most practical optimization meth-ods. It enables one to identify the effects of individ-ual variables and to efficiently seek the optimum conditions for a multivariable system. With this methodology, the effect of interaction of various parameters can be understood, generally resulting in high production yields and a lower number of ex-periments (Han et al., 2009; Hao et al., 2006).
In the current study, the Central Composite De-sign (CCD) and Fractional Factorial DeDe-sign (FFD) were used to evaluate the effects of the mineral solu-tion components described by Mandels and Reese
(1957) on cellulase and xylanase production by the mutant Penicillium echinulatum S1M29. Response surface methodology is also applied to predict the optimum yield of cellulases and xylanases.
MATERIALS AND METHODS
Microorganism
P. echinulatum S1M29, obtained from the mutant
strain 9A02S1 (Deutsche Sammlung von
Mikroor-ganismen und Zellkulturen – DSM 18942) after several
steps of mutagenesis, was used in this study (Dillon
et al., 2011). The strain was grown and maintained
on cellulose agar (C-agar) consisting of distilled wa-ter containing 1% (v/v) swollen cellulose, 10% (v/v) of the mineral solution described by Mandels and Reese (1957), 0.1% (w/v) proteose peptone (Oxoid L85), and 2% (w/v) agar. The strain was grown on C-agar slants for up to 7 days at 28 °C until conidia were formed.
Medium and Cultivation Conditions
The production medium consisted of 1% (w/w)
cel-lulose Celuflok E®, 0.5% (w/w) sucrose, 0.2% (w/w) soybean meal, 0.5% (w/w) wheat bran, 0.05% (w/w)
Prodex®, 0.1% (v/v) Tween 80®,10% (v/v) mineral
standard solution based on Mandels and Reese (1957) composed of (g/L): KH2PO4, 20; (NH4)2SO4, 14; MgSO4.7H2O, 3; CO(NH2)2 (urea), 3; CaCl2, 3; FeSO4.7H2O, 0.05; MnSO4.H2O, 0.0156; ZnSO4.7H2O, 0.014 and CoCl2.6H2O, 0.02. Different concentra-tions of urea and salts (NH4)2SO4, KH2PO4, CaCl2, MgSO4.7H2O of the mineral solution were tested (Table 1).
The experiments were conducted in 500-mL Erlenmeyer flasks with 100 mL of production me-dium. After autoclaving at 121 °C for 15 min, the flasks were inoculated with a conidial suspension (1x10⁷ conidia.mL-1, counting in a Neubauer chamber) and kept at 28 °C, under agitation of 180 rpm for 120 h. All assays were tested in triplicate and the mean values were calculated.
Enzymatic Assays
Statistical Optimization of Mineral Salt and Urea Concentration for Cellulase and Xylanase Production by Penicillium echinulatum in Submerged Fermentation 15
0.05 M sodium citrate buffer (pH 4.8). The β -gluco-sidase activity was measured using ρ-nitrophenyl-β -D-glucopiranoside (Daroit et al., 2008). Xylanase activity was determined according to Bailey et al. (1992), using 1% oat spelled xylan (w/v). The con-centrations of reducing sugars were estimated with dinitrosalicylic acid, according to Miller (1959).
Medium Composition Optimization
A 25-1 Fractional Factorial Design was carried out to evaluate the effects of the mineral solution com-ponents used in the enzyme production medium, which resulted in 16 different assays with three repli-cations at the center point, totaling 19 assays (Table 1). A 23 Central Composite Design was performed after analyzing the effects of the five variables (Table 3). The experiment included six axial points and six central point replicates, totaling 20 assays. The ef-fects of the variables, the significance of the multiple regression coefficients and graphical analysis of the data were determined using the Statistica 5.0 soft-ware and the confidence interval was 95%. The ex-periments were conducted up to 120 h and the time of fermentation employed for experimental designs was 96 h, because the main activities were found in this time.
The regression parameters were fitted to a poly-nomial equation with the coded variables (Eq. (1)):
2 2
0 1 1 2 2 3 3 11 1 22 2
2
33 3 12 1 2 23 2 3 13 1 3
i
Y B B x B x B x B x B x
B x B x x B x x B x x
(1)
where Yi is the predicted response, B0 is the inter-cept term, B1, B2, and B3 are linear effects B11, B22, B33 are squared effects, B12, B23, B13 are interaction terms and x1, x2, x3 are independent variables, respectively.
To verify the accuracy of the optimal conditions, the assay with the best results was repeated in tripli-cate using Erlenmeyer flasks. The activities were compared with the standard mineral solution (MS standard) described by Mandels and Reese (1957), and also compared with two solutions in which salts and urea were concentrated 1.5-fold (MS 1.5) and 2-fold (MS 2.0) relative to the standard solution. The other culture medium components and process con-ditions were the same as in the experimental design assays. Graphs representing the enzymatic activities were developed in the PrismGraphPad® software version 3.0. The same software was used to perform
an analysis of variance with Tukey's post hoc test at the 5% significance level (p<0.05).
RESULTS AND DISCUSSION
Five-Variable Fractional Factorial Design (FFD) for Cellulase and Xylanase Production
The production medium is one of the factors that interferes the most with the microorganism physiol-ogy and the production of compounds of interest. Thus, a five-variable FFD (Table 1) was performed with different concentrations of salts and urea to evaluate the influence of these nutrients on P.
ech-inulatum enzymatic activity. Mandels and Reese
(1957) found that the mineral composition of the medium has a great effect on the production of cel-lulases by Trichoderma viride.
The highest FPase activities were observed in as-says 1 (0.89 U.mL-1) and 11 (0.98 U.mL-1) and the results for xylanase (34.3 and 34.64 U.mL-1, respec-tively) were similar to that obtained in assay 10 (36.1 U.mL-1), which yielded the highest activity for this enzyme. The highest β-glucosidase activities were obtained in assay 4 (2.5 U.mL-1), 10 (2.52 U.mL-1) and 11 (2.51 U.mL-1). The highest endoglucanase activity was obtained in assay 4 (6.35 U.mL-1) (Table 1). The effect of salt and urea concentrations on en-zyme activity can be seen in Table 2. It can be ob-served that urea has a positive effect on all enzymes analyzed, having a significant influence on xylanase activity. For FPase, the salt concentrations had the lowest effects, which were not significant to a confi-dence level of 95% (Table 2). These results were similar to those obtained for β-glucosidases. Although essential, Mg and Ca salts showed negative effects on endoglucanases activities, indicating that an increase in the concentration of such salts can impair signifi-cantly the enzyme production (p=0.0358).
Table 1: Fractional Factorial Design real and coded variables (g.L-1) and cellulase and xylanase activities obtained at 96 h of culture using P. echinulatum S1M29.
Run Experimental factors Cellulases (U.mL
-1) Xylanases
(U.mL-1)
X1 X2 X3 X4 X5 FPase β-glucosidades Endoglucanases
1 (-1) 1.4 (-1) 0.3 (-1) 2.0 (-1) 0.3 (+1) 0.6 0.89 2.46 5.52 34.35
2 (+1) 2.8 (-1) 0.3 (-1) 2.0 (-1) 0.3 (-1) 0.3 0.73 1.08 5.21 31.06
3 (-1) 1.4 (+1) 0.6 (-1) 2.0 (-1) 0.3 (-1) 0.3 0.7 1.38 4.63 30.6
4 (+1) 2.8 (+1) 0.6 (-1) 2.0 (-1) 0.3 (+1) 0.6 0.77 2.5 6.35 32.33
5 (-1) 1.4 (-1) 0.3 (+1) 4.0 (-1) 0.3 (-1) 0.3 0.8 1.89 5.1 30.3
6 (+1) 2.8 (-1) 0.3 (+1) 4.0 (-1) 0.3 (+1) 0.6 0.81 2.06 5.29 33.04
7 (-1) 1.4 (+1) 0.6 (+1) 4.0 (-1) 0.3 (+1) 0.6 0.69 2.04 4.71 30.17
8 (+1) 2.8 (+1) 0.6 (+1) 4.0 (-1) 0.3 (-1) 0.3 0.78 1.35 4.69 26.85
9 (-1) 1.4 (-1) 0.3 (-1) 2.0 (+1) 0.6 (-1) 0.3 0.67 1.74 4.74 32.19
10 (+1) 2.8 (-1) 0.3 (-1) 2.0 (+1) 0.6 (+1) 0.6 0.71 2.52 4.95 36.16
11 (-1) 1.4 (+1) 0.6 (-1) 2.0 (+1) 0.6 (+1) 0.6 0.98 2.51 4.37 34.64
12 (+1) 2.8 (+1) 0.6 (+1) 4.0 (+1) 0.6 (-1) 0.3 0.6 2.15 3.95 28.89
13 (-1) 1.4 (-1) 0.3 (+1) 4.0 (+1) 0.6 (+1) 0.6 0.66 2.15 4.86 30.98
14 (+1) 2.8 (-1) 0.3 (+1) 4.0 (+1) 0.6 (-1) 0.3 0.69 1.74 4.41 29.26
15 (-1) 1.4 (+1) 0.6 (+1) 4.0 (+1) 0.6 (-1) 0.3 0.68 1.73 4.54 27.76
16 (+1) 2.8 (+1) 0.6 (+1) 4.0 (+1) 0.6 (+1) 0.6 0.68 1.55 3.79 28.91
17 (0) 2.1 (0) 0.45 (0) 3.0 (0) 0.45 (0) 0.45 0.73 1.49 5.77 31.82
18 (0) 2.1 (0) 0.45 (0) 3.0 (0) 0.45 (0) 0.45 0.76 1.84 5.1 33.59
19 (0) 2.1 (0) 0.45 (0) 3.0 (0) 0.45 (0) 0.45 0.76 1.71 5.5 31.01
X1: (NH4) 2SO4; X2: CaCl2; X3: KH2PO4; X4: MgSO4; X5: Urea
Table 2: Effect of multiple regression of the five variables on P. echinulatum enzyme activity at 96 h of
culture.
Interception (NH4)2SO4 CaCl2 KH2PO4 MgSO4 Urea p-level
FPase 0.858 -0.002 -0.004 -0.002 -0.019 0.021 0.2690
Xylanases 34.2 -0.0138 -0.59 -0.147 0.127 0.863 0.0004*
Endoglucanases 6.50 0.004 -0.11 -0.0188 -0.231 0.091 0.0358*
β-glucosidases 1.13 -0.007 -0.0114 -0.0049 0.059 0.193 0.0814
*Significant factors, P<0.05
Salts also have great influence on the measure-ment of enzyme activity. Bhiri et al. (2008) evalu-ated the effect of different divalent cations (Mg2+, Mn2+,Ca2+, Co2+, Zn2+, Cd2+, Hg2+, Cu2+) onβ -gluco-sidase activity in the hyper-cellulolytic mutant
Peni-cillium occitanis Pol6. These ions were added at a
concentration of 0.2-5 mM and no significant effect was observed on the enzyme activity, except for the ions Hg2+ and Cu2+, which had an inhibitory activity at 2 mM. Sinegani and Emtiazi (2006) showed that exoglucanase and endoglucanase activities increase in the presence of Na+, K+, Ca+2, Ba+2 and Mn+2, but decrease with NH4+ and Mg+2. According to the pre-sent study, it seems that, when high concentrations of salts are employed, possible salt residues can be found in the final broth, interfering with enzymatic analysis.
Due to the importance of the concentration of salts and urea on the enzyme production, the effects from the multiple regression showed significant variations, and a CCD was carried out with MgSO4, CaCl2 and with urea. (NH4)2SO4 and KH2PO4 were
fixed at lower concentrations (1.4 and 2.0 g.L-l, re-spectively) due to the lower effects observed on en-doglucanase and xylanase activities (Table 2).
Three-variable Central Composite Design (CCD) for Cellulase and Xylanase Production
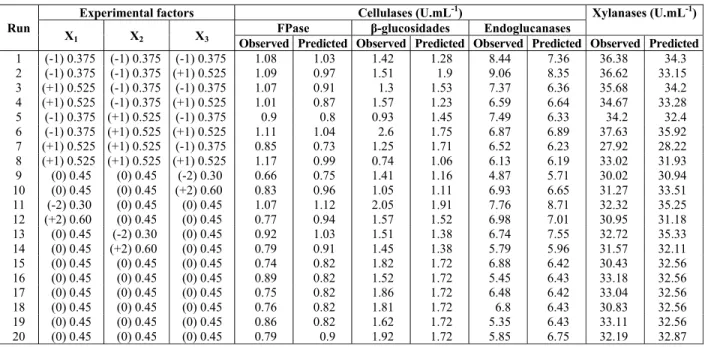
The data obtained from the three-variableCCD in-dicate that, among the enzymes evaluated, endogluca-nase had the highest production levels in this study. The FPase, β-glucosidase and xylanase activities were similar or slightly superior to the fivevariable CCD (Table 3). The optimization of the concentration of urea and Ca and Mg salts on enzymatic activity by the CCD was valid and the significance of the effects of each variable is shown in Table 4.
Statistical Optimization of Mineral Salt and Urea Concentration for Cellulase and Xylanase Production by Penicillium echinulatum in Submerged Fermentation 17
Table 3: Cellulase and xylanase activities at 96 h in cultures with different MgSO4, CaCl2 and urea
concentrations employing Central Composite Design (g.L-1).
Run
Experimental factors Cellulases (U.mL-1) Xylanases (U.mL-1)
X1 X2 X3
FPase β-glucosidades Endoglucanases
Observed Predicted Observed Predicted Observed Predicted Observed Predicted
1 (-1) 0.375 (-1) 0.375 (-1) 0.375 1.08 1.03 1.42 1.28 8.44 7.36 36.38 34.3
2 (-1) 0.375 (-1) 0.375 (+1) 0.525 1.09 0.97 1.51 1.9 9.06 8.35 36.62 33.15
3 (+1) 0.525 (-1) 0.375 (-1) 0.375 1.07 0.91 1.3 1.53 7.37 6.36 35.68 34.2
4 (+1) 0.525 (-1) 0.375 (+1) 0.525 1.01 0.87 1.57 1.23 6.59 6.64 34.67 33.28
5 (-1) 0.375 (+1) 0.525 (-1) 0.375 0.9 0.8 0.93 1.45 7.49 6.33 34.2 32.4
6 (-1) 0.375 (+1) 0.525 (+1) 0.525 1.11 1.04 2.6 1.75 6.87 6.89 37.63 35.92
7 (+1) 0.525 (+1) 0.525 (-1) 0.375 0.85 0.73 1.25 1.71 6.52 6.23 27.92 28.22
8 (+1) 0.525 (+1) 0.525 (+1) 0.525 1.17 0.99 0.74 1.06 6.13 6.19 33.02 31.93
9 (0) 0.45 (0) 0.45 (-2) 0.30 0.66 0.75 1.41 1.16 4.87 5.71 30.02 30.94
10 (0) 0.45 (0) 0.45 (+2) 0.60 0.83 0.96 1.05 1.11 6.93 6.65 31.27 33.51
11 (-2) 0.30 (0) 0.45 (0) 0.45 1.07 1.12 2.05 1.91 7.76 8.71 32.32 35.25
12 (+2) 0.60 (0) 0.45 (0) 0.45 0.77 0.94 1.57 1.52 6.98 7.01 30.95 31.18
13 (0) 0.45 (-2) 0.30 (0) 0.45 0.92 1.03 1.51 1.38 6.74 7.55 32.72 35.33
14 (0) 0.45 (+2) 0.60 (0) 0.45 0.79 0.91 1.45 1.38 5.79 5.96 31.57 32.11
15 (0) 0.45 (0) 0.45 (0) 0.45 0.74 0.82 1.82 1.72 6.88 6.42 30.43 32.56
16 (0) 0.45 (0) 0.45 (0) 0.45 0.89 0.82 1.52 1.72 5.45 6.43 33.18 32.56
17 (0) 0.45 (0) 0.45 (0) 0.45 0.75 0.82 1.86 1.72 6.48 6.42 33.04 32.56
18 (0) 0.45 (0) 0.45 (0) 0.45 0.76 0.82 1.81 1.72 6.8 6.43 30.83 32.56
19 (0) 0.45 (0) 0.45 (0) 0.45 0.86 0.82 1.62 1.72 5.35 6.43 33.11 32.56
20 (0) 0.45 (0) 0.45 (0) 0.45 0.79 0.9 1.92 1.72 5.85 6.75 32.19 32.87
X1: MgSO4; X2: CaCl2; X3: Urea
Table 4: Regression coefficients and significance values of variables.
Xylanases Endoglucanases FPase β-glucosidases
Factor Coefficient p-level Coefficient p-level Coefficient p-level Coefficient p-level
Mean 33.13 0.0006* 6.75 1.4.10-9* 0.82 2.10-8* 1.52 3.2.10-10*
X1(L) -1.02 0.042* -0.426 0.05* -0.043 0.034* -0.097 0.021*
X1(Q) -1.02 0.03* -0.43 0.05* -0.04 0.035* -0.1 0.022*
X2 (L) -0.8 0.0913 -0.396 0.07 -0.03 0.107 -3.10-7 1
X2(Q) -0.8 0.069 -0.4 0.23 -0.03 0.108 0 1
X3(L) 0.641 0.163 0.235 0.24 0.051 0.016* -0.013 0.716
X3(Q) 0.641 0.132 0.235 0.237 0.051 0.016* -0.01 0.717
X1X2 -1.03 0.094 0.228 0.406 0.013 0.603 0.008 0.877
X1X3 0.053 0.924 -0.15 0.577 0.005 0.834 -0.23 0.002*
X2X3 1.163 0.065 -0.11 0.688 0.0073 0.016* -0.09 0.089
*Significant factors, P<0.05
activity to 6.58 0.35 U.mL-1, showing the negative effect of a salt concentration increase, which was a significant effect for all enzymes (Table 4). This same 40% increase in the CaCl2 concentration reduced the endoglucanase activity by 31.8% (assays 2 and 6), but this effect was not significant. The increase in urea concentration was beneficial only with MgSO4 and CaCl2 concentrations lower than 0.525 g.L-1.
Gautam et al. (2010) evaluated different Ca and Mg concentrations (10-80 mM) and found that higher levels of these ions impair the FPase, as well as en-doglucanase and β-glucosidase activities in T. ressei. The authors considered 10 mmol.L-1 as the optimal concentration for enzymatic activity.
Endoglucanase activity obtained in this study was greater than that obtained by Han et al. (2009) with
P. waskmanii F10-2. The authors found that
en-doglucanase activity is increased by MgSO4, NaCl and KH2PO4, with activities of 5.64 U.mL
-1
when the microorganism is grown in a medium containing 0.2, 3.3 and 2.7 g.L-1 of the respective salts. According to
Kim et al. (2012), the optimal concentrations of
K2HPO4, NaCl, MgSO4 and (NH4)2SO4 for endoglu-canase production are 3.00, 0.52, 0.34 and 0.45 g.L-1, respectively, for Psychrobacter aquimaris LBH-10.
sp. MDS. The microorganism was studied under ideal growing conditions and the results indicate that supplementation of CaCl2 (5 mmol.L-1) significantly induced the enzyme system.
As noted in the five-variable experimental design (Table 2), the effects of urea were positive for all enzymes, indicating the importance of this organic source of nitrogen in the culture medium. Although the effects of urea were positive for enzyme activity, the effects of CaCl2 and MgSO4 were negative for most of the enzymes. While MgSO4 concentration showed the highest negative effects for xylanases, -glucosidases and endoglucanases, the CaCl2 concen-tration had a more negative effect for xylanases and endoglucanases. According to Rabinovich et al. (2002) and Xiong et al. (2004), xylanases and endogluca-nases have different isoforms. The presence of iso-forms may explain their greater susceptibility to varying salt concentrations.
For endoglucanase activities, the explained varia-tion was 52.5% (Fcal=1.22), with representative agreement between the experimental values and those predicted by the model (Eq. (2)).
1 2
1 1
( . ) 6.75 0.426 0.43
Endoglucanase
Y U mL x x (2)
The FPase was influenced by the concentration of urea and CaCl2 and MgSO4 salts, with significant ef-fect of urea and MgSO4. A decrease in concentration from 0.6 g.L-1 (assay 11, Table 1) to 0.525 g.L-1 (as-say 8, Table 3) resulted in a 20% increase in enzyme activity. For the FPase, the explained variation was 49% (Fcal=1.01), with representative agreement between the experimental values and those predicted by the model (Eq. (3)).
1 2
1 1 3
2
3 2 3
( . ) 0.82 0.043 0.04 0.051
0.051 0.0073
FPA
Y U mL x x x
x x x
(3)
For -glucosidase activities, the explained varia-tion was 51% (Fcal=1.12), with representative agreement between the experimental values and those predicted by the model (Eq. (4)).
1 2
cos 1 1
1 3
( . ) 1.52 0.097 0.1
0.23 glu idase
Y U mL x x
x x
(4)
For xylanase activities, the explained variation was 47.3% (Fcal=1.75), showing representative agree-ment between the experiagree-mental values and those predicted by the model (Eq. (5)).
1 2
1 1
( . ) 33.13 1.02 1.02
Xylanases
Y U mL x x (5)
Dobrev et al. (2007) optimized the xylanase pro-duction by Aspergillus niger B03 by 33% using ex-perimental design. The maximum xylanase activity was obtained in a medium containing (g.L-1) 2.6 of (NH4)2HPO4, 0.9 of urea. 6.0 of malt sprout, 24.0 of corn cobs and 14.6 of wheat bran.
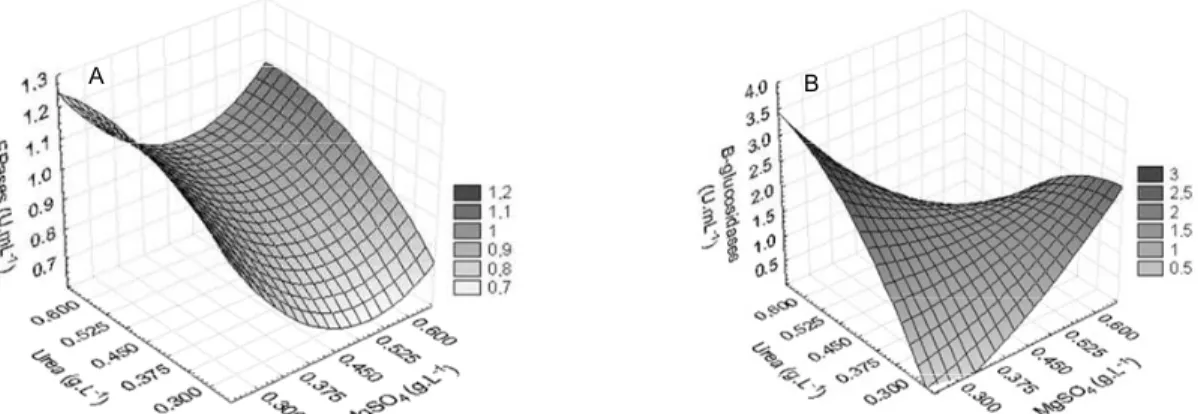
The concentration of MgSO4 was significant and had a negative effect on all enzymes evaluated (sig-nificance values). Figure 1 shows FPase and -glu-cosidase activities as a function of MgSO4 and urea concentrations, which are the most significant vari-ables for these enzymes. Figure 2 presents the re-sponse surface showing the effects of MgSO4 and CaCl2 on endoglucanase and xylanase activities.
A B
Statistical Optimization of Mineral Salt and Urea Concentration for Cellulase and Xylanase Production by Penicillium echinulatum in Submerged Fermentation 19
A
B
Figure 2: Surface response to the xylanase (A) and endoglucanase (B) activities in Penicillium
echinulatum S1M29 at 96 h of culture, as a function of MgSO4 and CaCl2 concentrations. Urea was fixed
at the central point.
From the data analysis, condition 2 of the ex-perimental design, with three variables, was defined as ideal for the production of cellulases and xy-lanases because it yielded the highest endoglucanase activities, as well as xylanase and FPase activities similar to the higher values obtained under other conditions. The optimal conditions determined by the model were not tested, because the salt and urea concentrations in the medium were higher than those employed in the optimal condition obtained in the experimental design. Moreover, the enzymes
activi-ties predicted were similar to those obtained in assay 2.
The condition obtained via the experimental de-sign (assay 2) was repeated in flasks kept under re-ciprocal agitation and the results were compared with the Reese and Mandels (1957) standard solu-tion. It was found that the FPase and -glucosidase activities were higher than those obtained in the ex-perimental design, but the endoglucanase and xy-lanase activities were lower (Figures 3A-D). This dis-crepancy may be due to a slight variation of the ex-perimental conditions.
72 96 120
0.0 0.5 1.0 1.5 2.0
MS 2.0 MS 1.5 MS planned MS standard
A
Time (h)
F
P
ase (
U
.m
L
-1)
72 96 120
3 4 5 6 7 8
MS 2.0 MS 1.5 MS planned MS standard B
Time (h)
Endo
gl
u
c
anases (
U
.m
L
-1 )
72 96 120
15 20 25 30 35
MS 2.0 MS 1.5 MS planned MS standard
C
Time (h)
X
y
lanases (
U
.m
L
-1)
72 96 120
1 2 3 4 5
MS 2.0 MS 1.5 MS planned MS standard D
Time (h)
-g
lu
co
si
da
se
s (
U
.m
L
-1 )
Figure 3: FPase (A), endoglucanase (B), xylanase (C) and β-glucosidase (D) activities of Penicillium
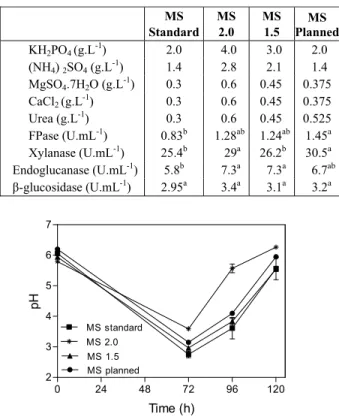
Variations in the concentrations of urea, MgSO4 and CaCl2, in relation to the standard mineral solu-tion resulted in significantly higher activities when compared to the standard solution at concentrations 1.5 and 2.0 times higher. This indicates that the highest levels of enzymatic activity can be obtained by increasing the concentration of some of the salts (Table 5). During the submerged culture employing the planned mineral solution, the pH values were lower than those obtained in the culture with the standard solution (Figure 4). This can explain the higher activity. According to Sternberg and Dorval (1979), the pH is an indicative parameter of metabo-lism intensity.
Table 5: Mineral Solution (MS) composition and enzyme activity obtained at 96 h.
MS Standard
MS 2.0
MS 1.5
MS Planned
KH2PO4 (g.L-1) 2.0 4.0 3.0 2.0
(NH4) 2SO4 (g.L-1) 1.4 2.8 2.1 1.4
MgSO4.7H2O (g.L-1) 0.3 0.6 0.45 0.375
CaCl2 (g.L-1) 0.3 0.6 0.45 0.375
Urea (g.L-1) 0.3 0.6 0.45 0.525
FPase (U.mL-1) 0.83b 1.28ab 1.24ab 1.45a Xylanase (U.mL-1) 25.4b 29a 26.2b 30.5a Endoglucanase (U.mL-1) 5.8b 7.3a 7.3a 6.7ab
β-glucosidase (U.mL-1) 2.95a 3.4a 3.1a 3.2a
0 24 48 72 96 120
2 3 4 5 6 7
MS 2.0 MS 1.5 MS standard
MS planned
Time (h)
pH
Figure 4: pH values during submerged culture of
Penicillium echinulatum S1M29 for the optimal
con-dition obtained in the experimental design.
Comparing the pH values at 72 h of culture using the medium formulated with the standard solution and those that were 1.5 and 2.0 times more concen-trated, it was verified that, in the conditions in which all components were concentrated, the pH was below 3. These values can affect the enzymatic activity be-cause, as reported for T. reesei by Ryu and Mandels (1980), cellulases are inactivated below pH 3.
CONCLUSIONS
The data obtained in this study clearly indicate the need to adjust the concentrations of minerals and urea for each microorganism used in the production of enzymes, such as cellulases and xylanases. Al-though the model could explain about 50% of the variability in the response of all evaluated enzymes, the FPase (1.45 U.mL-1) and xylanase (30.5 U.mL-1) activities obtained under the optimal conditions were significantly higher than those verified in the stan-dard conditions. The experimental design contributed to adjust the requirements of culture medium for cel-lulase and xylanase production, avoiding the waste of components from the medium and contributing to reducing the costs of enzyme production.
ACKNOWLEDGEMENTS
The authors are grateful to the Conselho Nacional de Desenvolvimento Científico e Tecnológico (CNPq), the Coordenação de Aperfeiçoamento de Pessoal de Nível Superior (CAPES), the Fundação de Amparo à Pesquisa do Estado do Rio Grande do Sul (FAPERGS) and the Universidade de Caxias do Sul (UCS) for the financial support of this work.
REFERENCES
Ahamed, A. and Vermette, P., Culture-based strategies to enhance cellulase enzyme production from
Trichoderma reesei RUT-C30 in bioreactor
cul-ture conditions. Biochemical Engineering Journal, 40, 399-407 (2008).
Bailey, M. J., Biely, P. and Poutanen, K., Interlabo-ratory testing of methods for assay of xylanase activity. Journal of Biotechnology, 23, 257-270 (1992).
Bhiri, F., Chaabouni, S. E., Limam, F., Ghrir, R. and Marzouki, N., Purification and biochemical char-acterization of extracellular β-Glucosidases from the hypercellulolytic Pol6 mutant of Penicillium
occitanis. Applied Biochemistry and
Biotech-nology, 149, 169-182 (2008).
Camassola, M. and Dillon, A. J. P., Cellulases and xylanases production by Penicillium echinulatum grown on sugar cane bagasse in solid-state fer-mentation. Applied Biochemistry and Biotech-nology, 162, 1889-1900 (2010).
Sci-Statistical Optimization of Mineral Salt and Urea Concentration for Cellulase and Xylanase Production by Penicillium echinulatum in Submerged Fermentation 21
entific Reports, 1:125:DOI:10.4172/scientific reports. 125 (2012).
Cheng, S. W., Wang, Y. F. and Hong, B., Statistical optimization of medium compositions for chito-sanase production by a newly isolated
Streptomy-ces albus. Brazilian Journal of Chemical
Engi-neering, 29, 691-698 (2012).
Coelho, L. F., de Lima, C. J. B., Rodovalho, C. M., Bernardo, M. P. and Contiero, J., Lactic acid pro-duction by new Lactobacillus plantarum LMISM6 grown in molasses: Optimization of medium composition. Brazilian Journal of Chemical En-gineering, 28, 27-36 (2011).
Daroit, D. J., Simonetti, A., Hertz, P. F. and Brandelli, A., Purification and characterization of extracel-lular β-glucosidase from Monascus purpureus. Journal of Microbiology and Biotechnology, 18, 933-941 (2008).
Dillon, A. J. P., Zorgi, C., Camassola, M. and Henri-ques, J. A. P., Use of 2-deoxyglucose in liquid media for the selection of mutant strains of
Peni-cillium echinulatum producing increased cellulase
and β-glucosidase activities. Applied Microbiol-ogy and BiotechnolMicrobiol-ogy, 70, 740-746 (2006). Dillon, A. J. P., Bettio, M., Pozzan, F. G., Andrighetti,
T. and Camassola, M., A new Penicillium
ech-inulatum strain with faster cellulase secretion
obtained using hydrogen peroxide mutagenesis and screening with 2-deoxyglucose. Journal of Applied Microbiology, 111, 48-53 (2011).
Dobrev, G. T., Pishtiyski, I. G., Stanchev, V. S. and Mircheva, R., Optimization of nutrient medium containing agricultural wastes for xylanase pro-duction by Aspergillus niger B03 using optimal composite experimental design. Bioresource Technology, 98, 2671-2678 (2007).
Gautam, S. P. Bundela, P. S., Pandey, A. K., Ja-maluddin, Awasthi, M. K. and Sarsaiya, S., Optimization of the medium for the production of cellulase by the Trichoderma viride using sub-merged fermentation. International Journal of Environmental Sciences, 1, 656-665 (2010). Geddes, C. C., Nieves, I. U. and Ingram, L. O.,
Ad-vances in ethanol production. Current Opinion in Biotechnology, 22, 312-319 (2011).
Ghose, T. K., Measurement of cellulase activities. Pure and Applied Chemistry, 59, 257-268 (1987). Goulart, A. J., Carmona, E. C. and Monti, R., Partial
purification and properties of cellulase-free alka-line xylanase produced by Rhizopus stolonifer in solid-state fermentation. Brazilian Archives of Biology and Technology, 48, 327-333 (2005). Gusakov, A. V., Salanovich, T. N., Antonov, A. I.,
Ustinov, B. B., Okunev, O. N., Burlingame, R.,
Emalfarb, M., Baez, M. and Sinitsyn, A. P., De-sign of highly efficient cellulase mixtures for en-zymatic hydrolysis of cellulose. Biotechnology and Bioengineering, 97, 108-1038 (2007).
Gusakov, A. V., Alternatives to Trichoderma reesei in biofuel production. Trends in Biotechnology, 29, 419-425 (2011).
Han, L., Feng, J., Zhu, C. and Zhang, X., Optimizing cellulase production of Penicillium waksmanii F10-2 with response surface methodology. Afri-can Journal of Biotechnology, 8, 3879-3886 (2009).
Hao, X. C., Yu, X. B. and Yan, Z. L., Optimization of the medium for the production of cellulase by the mutant Trichoderma reesei WX-112 using re-sponse surface methodology. Food Technology and Biotechnology, 44, 89-94 (2006).
Juhász, T., Szengvel, Z., Réczey, K., Siika-Aho, M. and Viikari, L., Characterization of cellulases and hemicellulases produced by Trichoderma reesei on various carbon sources. Process Biochemistry, 40, 3519-3525 (2005).
Kang, S. W., Park, Y. S., Lee, J. S., Hong, S. I. and Kim, S. W., Production of cellulases and hemi-cellulases by Aspergillus niger KK2 from ligno-cellulosic biomass. Bioresource Technology, 91, 153-156 (2004).
Kim, H. J., Lee, Y. J., Gao, W., Chung, C. H. and Lee, J. W., Optimization of salts in medium for production of carboxymethylcellulase by a psy-chrophilic marine bacterium Psychrobacter
aqui-maris LBH-10 using two statistical methods.
Korean Journal of Chemical Engineering, 29, 384-391 (2012).
Mandels, M. and Reese, E. T., Induction of cellulase
in Trichoderma viride as influenced by carbon
source and metals. Journal of Bacteriology, 73, 269-278 (1957).
Miller, G. L., Use of dinitrosalicilic acid reagent for determination of reducing sugar. Analytical Chem-istry, 31, 426-428 (1959).
Muthuvelayudham, R. and Viruthagiri, T., Application of central composite design based response surface methodology in parameter optimization and on cel-lulase production using agricultural waste. Interna-tional Journal of Chemical and Biological Engi-neering, 3, 97-104 (2010).
Patel, N., Choy, V., Malouf, P. and Thibault, J., Growth of Tricoderma reesei RUT-C30 in stirred tank and reciprocating plate bioreactors. Process Biochemistry, 44, 1164-1171 (2009).
Ryu, D. Y. and Mandels, M., Cellulases: Biosynthe-sis and aplications. Enzyme and Microbial Tech-nology, 2, 91-102 (1980).
Saratale, G. D., Saratale, R. G. and Oh, S. E., Pro-duction and characterization of multiple cellu-lolytic enzymes by isolated Streptomyces sp. MDS. Biomass and Bioenergy, 47, 302-315 (2012). Shanmugam, P., Mani, M. and Narayanasamy, M.,
Biosynthesis of cellulolytic enzymes by
Tricothe-cium roseum with citric acid mediated induction.
African Journal of Biotechnology, 7, 3917-3921 (2008).
Sinegani, A. A. S. and Emtiazi, G., The relative ef-fects of some elements on the DNS method in cellulase assay. Journal of Applied Sciences and Environmental Management, 10, 93-96 (2006). Singh, J. and Kaur, P., Optimization of process
pa-rameters for cellulase production from Bacillus sp. JS14 in solid substrate fermentation using re-sponse surface methodology. Brazilian Archives of Biology and Technology, 55, 505-512 (2012). Sternberg, D. and Dorval, S., Cellulase production
and ammonia metabolism in Trichoderma reesei
on high levels of cellulose. Biotechnology and Bioengineering, 21, 181-191 (1979).
Sukumaran, R. K., Singhania, R. R. and Patel, A. K., Microbial cellulases – Production, applications and challenges. Journal of Scientific & Industrial Research, 64, 832-844 (2005).
Terrasan, C. R. F., Temer, B. Duarte, M. C. T. and Carmona, E. C., Production of xylanolytic en-zymes by Penicillium janczewskii. Bioresource Technology, 101, 4139-4143 (2010).
Xiong, H., Weymarn, N., Leisola, M. and Turunen, O., Influence of pH on the production of xy-lanases by Trichoderma reesei RUT-C30. Process Biochemistry, 39, 729-733 (2004).
Xiros, C., Christakopoulos P., Enhanced ethanol production from brewer's spent grain by a
Fusa-rium oxysporum consolidated system.
Biotech-nology for Biofuels, 2:4: DOI:10.1186/1754-6834-2-4 (2009).