Modulated by the Transcription Factors MyoD and Sp1 in
C2C12 Cells
Jing Yuan1,2, Zhonglin Tang1*, Shulin Yang1, Kui Li1*
1State Key Laboratory for Animal Nutrition, Institute of Animal Science, Chinese Academy of Agricultural Sciences, Beijing, People’s Republic of China,2College of Animal Science, Yangtze University, Jingzhou, People’s Republic of China
Abstract
Cellular retinoic acid binding protein 2 (CRABP2), a member of a family of specific carrier proteins for Vitamin A, belongs to a family of small cytosolic lipid binding proteins. Our previous study suggested thatCRABP2was involved in skeletal muscle development; however, the molecular function and regulatory mechanism ofCRABP2 in myogenesis remained unclear. In this study, we found that the expression of theCRABP2 gene was upregulated during C2C12 differentiation. An over-expression assay revealed that CRABP2 promotes myogenic transformation by regulating the cell cycle during C2C12 differentiation. The region from2459 to24 bp was identified as the core promoter and contains a TATA box, a GC box and binding sites for the transcription factors MyoD and Sp1. Over-expression, site-directed mutagenesis and EMSA assays indicated that the transcription factors MyoD and Sp1 regulateCRABP2 expression and promote myoblast differentiation in C2C12 cells.
Citation:Yuan J, Tang Z, Yang S, Li K (2013)CRABP2Promotes Myoblast Differentiation and Is Modulated by the Transcription Factors MyoD and Sp1 in C2C12 Cells. PLoS ONE 8(1): e55479. doi:10.1371/journal.pone.0055479
Editor:Yao Liang Tang, University of Cincinnati, United States of America
ReceivedOctober 10, 2012;AcceptedDecember 23, 2012;PublishedJanuary 31, 2013
Copyright:ß2013 Yuan et al. This is an open-access article distributed under the terms of the Creative Commons Attribution License, which permits unrestricted use, distribution, and reproduction in any medium, provided the original author and source are credited.
Funding:This research was supported by the National Key Project (2012CB124706-6, 2011ZX08006-002, 2009CB941604) and the National Natural Science Foundation of China (31171192, 31172182). The funders had no role in study design, data collection and analysis, decision to publish, or preparation of the manuscript.
Competing Interests:The authors have declared that no competing interests exist. * E-mail: zhonglinqy_99@sina.com (ZT); kuili@iascaas.net.cn (KL)
Introduction
Myogenesis can be regarded as a two-step process consisting of the determination, in which the satellite cells commit to the mature muscle lineage, and subsequent differentiation of mononuclear myoblasts to multinuclear myotubes [1]. A previous study documented that several myogenesis factors (MyoD, Myf5, MRF4 and MyoG as well as members of the MyoD gene family) are critical for the determination and terminal differentiation of skeletal muscle cells [2]. In cultured non-muscle cells, the exogenous expression of the MyoD gene family can induce myogenic differentiation [3,4,5,6]. The MyoD gene family proteins bind to the CANNTG sequence (also known as the E-box sequence), which is present in the promoters and enhancers of many muscle-specific genes [7,8]. Through the DNA-protein interaction, the MyoD gene family induces a conformational change and promotes muscle cell-specific gene transcription. Additionally, the MyoD gene family also promotes cell differen-tiation and inhibits the cell cycle [9].
Sp1 belongs to a family of zinc-finger transcription factors involved in the early development of an organism [10,11]. It contains 3 zinc finger motifs, which bind to GC-rich sequences. Specifically, the Sp1 protein recognizes a motif of GGGCGG or other related GC-rich sequences [12]. The Sp1 protein regulates the expression of several genes involved in cell differentiation and embryonic development, enhancing or repressing gene activity [13,14,15,16].
Vitamin A and its related molecules (retinol, retinaldehyde and retinoic acid) specifically bind many distinct cytoplasmic proteins and play essential roles in vision, growth, reproduction and cell differentiation [17]. The cellular retinoic acid binding proteins (CRABPs) are well-characterised members of a large family of small proteins that specifically bind retinoic acid [18] and mainly exert their biological function within cells. The CRABPs are abundantly expressed in numerous developing tissues [19], which suggests that CRABPs may perform specific functions during morphogenesis [20,21].CRABP2is a low molecular mass (15 kDa) protein that belongs to the multi-gene family of cellular retinoic acid binding proteins [22]. During mouse embryonic develop-ment,CRABP2was expressed in many organs [21], we used the GNF SymAtlas expression datasets ( http://symatlas.gnf.org/ SymAtlas/), which demonstrated that CRABP2 mRNA was upregulated from day 6.5 to day 10.5. These data indicate that the CRABP2 gene may play a vital role during embryonic development.
Results
TheCRABP2 gene was upregulated during C2C12 differentiation
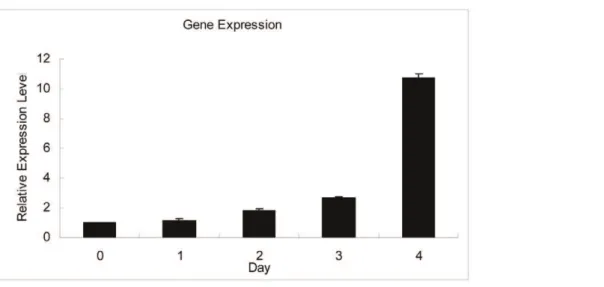
We analysed the expression of the genes (CRABP1, CRABP2, CRBP1, CRBP2) expressing carrier proteins for Vitamin A and related molecules by RT-PCR during C2C12 differentiation. The results shown reveal expression levels of CRABP1, CRABP2, CRBP1,CRBP2observed. We found that theCRABP1andCRBP2 genes were not detected and the mRNA expression of theCRBP1 gene was unchanged, but the CRABP2 gene was markedly upregulated (Figure 1). To further test the expression change of theCRABP2gene during C2C12 differentiation, quantitative real-time PCR (qRT-PCR) was performed. The results suggested that CRABP2was upregulated from day 0 to day 4 during myogenic differentiation in C2C12 cells (Figure 2).
CRABP2promotes C2C12 differentiation
To study the effects ofCRABP2in C2C12 cells, we constructed CRABP2 lentivirus vector for transit gene expression. Analysis by western blotting verified thatCRABP2was expressed in 293T cells (Figure 3) and the titer of the lentivirus particle was 2E+9 TU/ml. After transfecting C2C12 cells with CRABP2 expression vector, we observed cell morphology by fluorescence microscopy and studied a mixture of cell populations with various CRABP2 expression levels by qRT-PCR. We found that the expression levels ofCRABP2significantly increased (Figure 4) and that the cell morphology was characteristic of differentiation (Figure 5) in over-expression (OE) group compared with Blank control (CON) and Negative control (NC) groups.
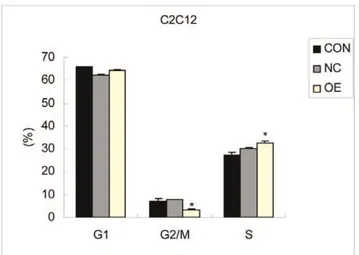
In contrast with the CON and NC groups, FACS cell sorting results of the OE group showed no significant changes in the percentage of cells in the G1 phase, but the percentage of cells in the G2/M phase decreased and the percentage of cells of S phase increased (p,0.05) (Figure 6). It has been reported that the number of cells in G2/M phase decreases and more cells remain in S phase during the early differentiation of C2C12 cells [24]. Because the percentage of S phase cells was higher and the percentage of G2/M phase cells was lower in OE group than
control group, indicating that S phase arrested and the number of cells entered into G2 phase decreased. These data demonstrated that DNA synthesis reduced, C2C12 cell no longer continue to proliferate, may enter the cell differentiation.
Identification of the core promoter region
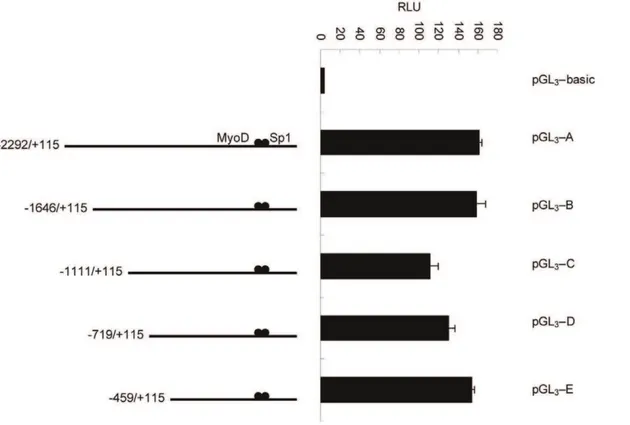
To determine the functional fragment of theCRABP2promoter, we inserted a 2.4 kb fragment into the promoter-less vector pGL3 -basic. The resulting plasmid (pGL3-A) was transfected into C2C12 cells, and the luciferase activity measured. Compared with cells transfected with pGL3-basic, the cells transfected with the pGL3-A plasmid had significantly increased luciferase activity, revealing that the 2.4 kb fragment was a functional promoter fragment. To further identify the precise promoter region, the four promoter luciferase reporter plasmids (pGL3-B, pGL3-C, pGL3-D and pGL3-E) were constructed by further deletion using pMD18 T-A as a template. As shown by transient transfection results, the pGL3-E plasmid contained the basal promoter activity (Figure 7). Four promoter luciferase reporter plasmids (pGL3-a, pGL3-b, pGL3-c and pGL3-d) were constructed by further deletion of pGL3-E. The results indicated that the pGL3-E plasmid with the
2459 bp to 24 bp fragment contained the minimal core promoter region (Figure 8).
Identification ofMyoDandSp1as transcription factors of theCRABP2 gene
Bioinformatic analyses using TFSEARCH, TESS, Web Pro-moter Scan Service and MatInspector programs indicated that the CRABP2promoter contains a TATA box, a GC box and binding sites for the transcription factors MyoD and Sp1. The core promoter region contains the TATA box and the GC box, as well as MyoD and Sp1 binding sites.
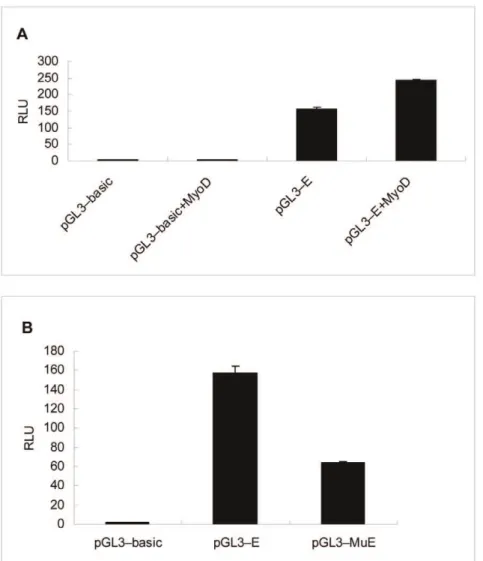
To determine experimentally that MyoD and Sp1 are regulators of theCRABP2 gene, an over-expression vector of MyoD and a site-directed mutation vector of Sp1 were constructed. Co-transfection with the minimal core promoter vector was performed to verify the transcription factors MyoD and Sp1, respectively. The results showed that theMyoDand Sp1 sites in the promoter region were necessary and functional to drive the basal reporter expression in transient transfection assays in C2C12 cells (Figure 9).
Validation of MyoD and Sp1 transcription factors as regulators for theCRABP2 gene
To further confirm the function ofMyoDandSp1, electropho-retic mobility shift assays (EMSA) were carried out to analyse binding capabilities in cell nuclear extracts.
Oligonucleotides were synthesized and BIO-labelled and then incubated with nuclear extracts from C2C12 cells. Specific DNA-protein complexes were identified from C2C12 nuclear extracts (Figure 10). The binding activities were different between C2C12 myoblasts and C2C12 myotubes. In C2C12 myotubes, the binding activity of MyoD was decreased; however, the binding activity of Sp1 was enhanced. These results indicate that MyoD and Sp1 specifically bind to promoter elements to regulate CRABP2 expression in C2C12 cells at different times during differentiation.
Discussion
Our previous LongSAGE analysis suggested thatCRABPs were involved in skeletal muscle development in the pig throughout embryonic development.23Therefore, the aim of this study was to investigate the function of CRABPs during the process of differentiation of C2C12 cells into myotubes. The RT-PCR and real time PCR analyses suggested thatCRABP2was increasingly Figure 1. The expression ofCRABP1,CRABP2,CRBP1andCRBP2
genes according to RT-PCR analysis during C2C12 differenti-ation.0: C2C12 myoblast cells; 1–4: Days 1–4 in C2C12 cell myoblasts differentiated into myotubes.
doi:10.1371/journal.pone.0055479.g001
expressed during C2C12 cell differentiation. Interestingly, we found that CRABP2 over-expression accelerated the process of C2C12 differentiation into myotubes in vitro. These observations suggest that CRABP2 contributes to the process of C2C12 myoblast differentiation into myotubes.
We then carried out a promoter analysis through a step-by-step deletion process to identify the core promoter region. Bioinfor-matics analyses showed that the promoter region contained a TATA box, a GC box, and MyoD and Sp1 transcription factor binding sites. We constructed a MyoD over-expression vector and an Sp1 site-directed mutation vector. Co-transfection was performed to demonstrate the effects of MyoD and Sp1 transcription factors on the CRABP2 gene. The EMSA results indicated that the predicted MyoD and Sp1 binding sites bound to the MyoD and Sp1 proteins, respectively, in nuclear extracts from C2C12 cells. Additionally, excess amounts of unlabelled oligonu-cleotides inhibited the binding activities in C2C12 cells. This result further proved that the MyoD and Sp1 binding sites were functional regulators for the CRABP2 gene. These results demonstrated that the putative MyoD and Sp1 binding sites in the core promoter of CRABP2may be responsible for transcrip-tional regulation in C2C12 cells.
Transcription factors are trans-regulatory factors that exert biological function by interaction with cis-regulatory elements of structural genes. The MyoD family recognizes and binds the consensus sequence CANNTG (N for any nucleotide), and the promoter region ofCRABP2contains a CANNTG sequence. The MyoD gene family forms a very complex regulatory network by
interacting with a number of positive and negative factors to regulateCRABP2 gene transcription, controlling cell growth and cell differentiation. The Sp1 transcription factor was involved in regulating cell growth and controlling morphogenetic pathways both in mammals and in invertebrates [25,26]. In our study, Sp1 regulated gene transcription by binding the GGGCGG sequence in specific regulatory sites of theCRABP2gene. Therefore, MyoD and Sp1 are important regulators for the CRABP2 gene and directly bind to the promoter region to influence CRABP2 expression.CRABP2is in turn involved in regulating C2C12 cell differentiation.
In summary,CRABP2expression was upregulated from day 0 to day 4 at the mRNA level in differentiating C2C12 cells. The over-expression ofCRABP2led to cell cycle changes in C2C12 cells in vitro. We have identified a biological function for CRABP2 in C2C12 differentiation and found that MyoD and Sp1 play a regulatory role inCRABP2 gene transcription by binding in the core promoter region between2459 bp and24 bp upstream of the CRABP2 gene. These results give new insight into the biological function and regulatory mechanism of the CRABP2 gene.
Materials and Methods
Cell culture and RNA extraction
C2C12 cells were cultured in DMEM (Dulbecco’s Modified Eagle’s Medium) supplemented with 10% FBS, 2 mM glutamine, 100 units/ml penicillin and 100mg/ml streptomycin and were Figure 2. The expression of theCRABP2gene during differentiation was assessed by quantitative real-time PCR (qRT-PCR).The values were normalized toGAPDHmRNA expression level and the value of day 0 was set to 1. The error bars indicate the SD (n = 3).
doi:10.1371/journal.pone.0055479.g002
Figure 3. The cell morphology of 293T under fluorescence microscope (Olympus, micropublisher 3.3RTV, 1006) transfected by CRABP2 overexpression vector and the expression of CRABP2 detected by Westernblot.(A) Visible image transfected with lentivirus; (B) Green fluorescence image transfected with lentivirus; (C) CRABP2 expression by westernblot.
maintained at 37uC in 5% CO2. The C2C12 cells were seeded in six-well plates. After approximately 12–16 h, when cell confluence reached approximately 60%–70%, the differentiation of C2C12 myoblasts into myotubes was induced by the addition of differentiation medium (DMEM containing 2% horse serum instead of 10% FBS).
Starting at the beginning of differentiation, the C2C12 cells were cultured in six-well plates and harvested for RNA extraction at 0, 1, 2, 3 and 4 days. Total RNA samples were extracted using TRIZOL (Invitrogen, USA) according to the manufacturer’s instructions. The cDNA samples were obtained by reverse transcription from 1mg RNA using oligo(dT) and M-MLV reverse transcriptase (Promega, USA).
RT-PCR analysis
The RT-PCR (Reverse Transcription-Polymerase Chain Reac-tion) was performed in a volume of 10ml containing 1ml of 106 PCR buffer (plus Mg2+
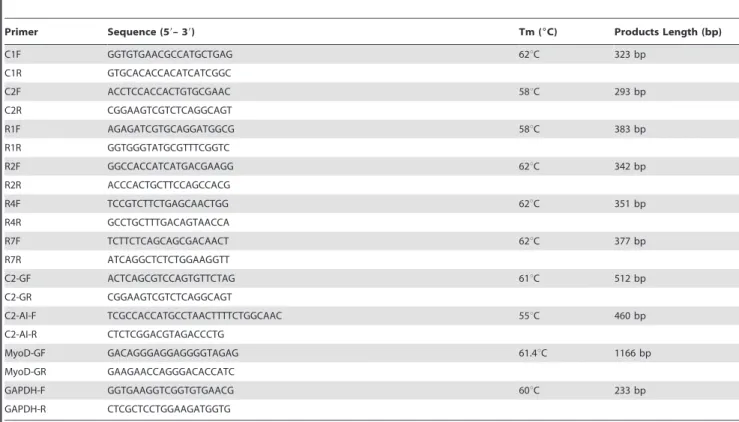
), 100mmol/L of each dNTP, 0.5mmol/L of each PCR primer, 1.0 U Taq DNA polymerase (Takara, Japan) and 0.5ml of cDNA template. The primers were designed and synthesized as shown in Table 1. The PCR reaction was 5 min at 95uC followed by 27 cycles of 30 s at 95uC, 30 s at the specific melting temperatures of each primer pair, 30 s at 72uC and a final extension time of 5 min at 72uC.
Real-time PCR analysis
Real-time PCR amplifications were carried out using the Light Cycler Real Time PCR instrument (model 7500; Applied Biosystems, Inc., Foster City, CA). The PCR reaction contained
506ROX Reference DyeII, 26SYBR Green Realtime PCR Master Mix (Takara, Japan), 10mM primers and 1.0ml of cDNA template. Pure water was added for a total volume of 20.0ml. Gene amplification was performed under the following conditions: 95uC for 30 s, followed by 40 cycles of 95uC for 5 s, 60uC for 20 s and 72uC for 34 s. The PCR was performed in biological triplicate for each condition. The target gene data was analysed and normalized toGAPDHmRNA levels.
Construction and transfection of theCRABP2lentivirus vector
The vector overexpressingCRABP2was constructed to study its function in C2C12 cells. The cDNA fragment was isolated and ligated into the pGC-FU vector linearized by cutting with Age I restriction enzyme, purchased from GeneChem Co., Ltd, Shang-hai, China. The expression plasmid containing the fusion protein was extracted using ultrapure endotoxin-free extraction kits (Omega, USA). The transfection of 293T cells was carried out using Lipofectamine 2000 according to the manufacturer’s instructions. After a 48 h incubation, the cell supernatant containing virus-like particles was collected. After concentration, the viral titres were determined in the 293T cells.
The C2C12 cells were plated on 6-well plates and cultured overnight at 37uC in 5% CO2. When cell confluence reached approximately 60–70%, lentivirus of a specific quantity was added to cells. After 12 h, the transfection medium was removed and replaced with normal growth medium.
Figure 4. The target gene expression in C2C12 cells transfected with the CRABP2 lentivirus vector. (CON: Blank control; NC: Negative control; OE: Overexpression).
doi:10.1371/journal.pone.0055479.g004
Figure 5. The cell morphology of C2C12 under fluorescence microscope (Olympus, micropublisher 3.3RTV, 2006) transfected by different lentivirus vector.(CON: Blank control; NC: Negative control; OE: Overexpression).
doi:10.1371/journal.pone.0055479.g005
Figure 6. The FCM results of the C2C12 cells transfected with the CRABP2 lentivirus vector. (CON: Blank control; NC: Negative control; OE: Over expression).
doi:10.1371/journal.pone.0055479.g006
Figure 7. The first deletion analysis of the promoter of the mouseCRABP2gene in C2C12 cells.C2C12 cells were co-transfected with various promoter regions fused to firefly luciferase and a Renilla luciferase expression control vector. The resulting firefly luciferase activity was then normalized to Renilla luciferase activity, and the relative values were presented as the fold-increase over the activity of the promoter-less pGL3-basic
vector. Values represent the mean6SD of three independent experiments.
Figure 8. The second deletion analysis of the promoter of the mouseCRABP2gene in C2C12 cells.C2C12 cells were co-transfected with various promoter regions fused to firefly luciferase and a Renilla luciferase expression control vector. The resulting firefly luciferase activity was then normalized to Renilla luciferase activity, and the relative values were presented as the fold-increase over the activity of the promoter-less pGL3-basic
After 3–4 days, the GFP expression was tested by fluorescence microscopy to determine transfection efficiency. The cells were then harvested and used for the cell cycle assay and RNA extraction. All transfections were performed in triplicate for each plasmid.
Flow cytometry analysis (FCM)
The C2C12 cells were collected and centrifuged at 1200 rpm for 5 min. The cells were washed twice in 4uC pre-chilled PBS (phosphate buffered saline, pH = 7.2–7.4), fixed with 4uC pre-chilled 70% ethanol, centrifuged at 1500 rpm for 5 min to remove stationary phase cells and resuspended in PBS. The cells were filtered once through 400 mesh and centrifuged at 1200 rpm for 5 min, and after the PBS supernatant was removed, the cells were then stained with 1 ml of PI at 4uC in darkness for 30 min. Finally, the cells were analysed by flow cytometry (FACSCalibur, BD, USA).
Construction of the luciferase reporter plasmids
The 59-upstream 2.4 kb promoter fragment of the CRABP2 gene was amplified from mouse genomic DNA and then inserted into the pMD18-T vector. It was named pMD18 T-A.
The construction of the luciferase reporter gene plasmid was carried out as follows: the pMD18 T-A vector was cut using MluI and NcoI restriction enzymes and then ligated into linearized basic vector (named pGL3-A). Fragments of different lengths from the 59-upstream sequence were amplified using pMD18T-A as a template and then ligated into linearized pGL3-basic vector (named pGL3-B, pGL3-C, pGL3-D and pGL3-E). The plasmids pGL3-A, pGL3-B, pGL3-C, pGL3-D and pGL3-E were construct-ed to contain 22292 bp to +115 bp, 21646 bp to +115 bp, 21111 bp to +115 bp, 2719 bp to +115 bp and 2459 bp to +115 bp of theCRABP2gene, respectively.
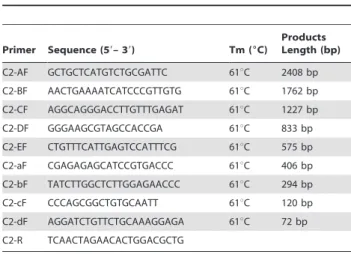
To identify more precisely the core promoter region, we performed further deletions on the promoter fragment pGL3-E: four luciferase reporter gene plasmids, pGL3-a (2290 bp to +115 bp), pGL3-b (2178 bp to +115 bp), pGL3-c (24 bp to +115 bp) and pGL3-d (+44 bp to +115 bp), were constructed using the above methods. Each promoter luciferase plasmid was constructed using a sequence-specific forward primer and a common reverse primer (shown in Table 2). The sequences were analysed by Invitrogen.
Figure 9. Transcriptional activation of theCRABP2 promoter was effected byMyoDandSp1.(A) Transcriptional activation of theCRABP2 promoter was potentiated by the MyoD expression plasmid. The empty vector or the core promoter plasmid pGL3-E was cotransfected with the
MyoD expression plasmid pcDNA3.1-MyoD into C2C12 cells. The over-expression of MyoD increased theCRABP2promoter activity (n = 3); (B) The transcriptional activation of theCRABP2promoter was repressed by the Sp1 site-directed mutation vector. The Sp1 binding site was required for CRABP2promoter function, and the transcription factor Sp1 facilitated the transcriptional activation of theCRABP2gene. Values represent the mean
6SD of three independent experiments. doi:10.1371/journal.pone.0055479.g009
Bioinformatic and statistical analyses
The sequence of the 59-upstream 2.4 kb promoter fragment of the CRABP2 gene was analysed using Promoter Scan (http:// www.bimas.cit.nih.gov/molbio/proscan). The core promoter re-gion was identified by the Transcription Element Search System (http://www.cbil.upenn.edu/cgi-bin/tess/tess), the Berkeley
Dro-sophila Genome Project programs (http://www.fruitfly.org/ seq_tools/promoter.html) and TFSEARCH (http://www.cbrc. jp/research/db/TFSEARCH.html).
All experiments were performed in triplicate, and the data were presented as mean6SD. Student’s t-test was used to determine statistical significance.
Figure 10. Binding activities of MyoD and Sp1 in nuclear extracts.(A) Assay of binding activity of MyoD in nuclear extracts; (B) Assay of binding activity of Sp1 in nuclear extracts. Lanes 1, 6: nuclear extracts from C2C12 myoblasts; lanes 2, 3, 4, 7, 8, 9: nuclear extracts from C2C12 myotubes after a 4 day induction with horse serum; lanes 5, 11: competition for binding by the unlabeled probe; lane 10: positive control. doi:10.1371/journal.pone.0055479.g010
Table 1.Primers used for gene expression analysis in the study.
Primer Sequence (59– 39) Tm (6C) Products Length (bp)
C1F GGTGTGAACGCCATGCTGAG 62uC 323 bp
C1R GTGCACACCACATCATCGGC
C2F ACCTCCACCACTGTGCGAAC 58uC 293 bp
C2R CGGAAGTCGTCTCAGGCAGT
R1F AGAGATCGTGCAGGATGGCG 58uC 383 bp
R1R GGTGGGTATGCGTTTCGGTC
R2F GGCCACCATCATGACGAAGG 62uC 342 bp
R2R ACCCACTGCTTCCAGCCACG
R4F TCCGTCTTCTGAGCAACTGG 62uC 351 bp
R4R GCCTGCTTTGACAGTAACCA
R7F TCTTCTCAGCAGCGACAACT 62uC 377 bp
R7R ATCAGGCTCTCTGGAAGGTT
C2-GF ACTCAGCGTCCAGTGTTCTAG 61uC 512 bp
C2-GR CGGAAGTCGTCTCAGGCAGT
C2-AI-F TCGCCACCATGCCTAACTTTTCTGGCAAC 55uC 460 bp
C2-AI-R CTCTCGGACGTAGACCCTG
MyoD-GF GACAGGGAGGAGGGGTAGAG 61.4uC 1166 bp
MyoD-GR GAAGAACCAGGGACACCATC
GAPDH-F GGTGAAGGTCGGTGTGAACG 60uC 233 bp
GAPDH-R CTCGCTCCTGGAAGATGGTG
C1F, C1R; C2F, C2R; R1F, R1R; R2F, R2R; R4F, R4R; R7F, R7R: primers used for determining the expression ofCRABP1,CRABP2,CRBP1,CRBP2,RBP4,RBP7during C2C12 differentiation time; C2-GF, C2-GR and C2-AI-F, C2-AI-R: primers used for construction of theCRABP2over-expression vector; MyoD-GF, MyoD-GR: primers used for construction of the MyoD over-expression vector; GAPDH-F, GAPDH-R: primers used as an internal control.
Luciferase assay
The C2C12 cells were plated on 24-well plates and cultured overnight at 37uC to ensure approximately 60%-70% confluence. Co-transfections were performed using 2.0ml of Lipofectamine 2000 reagent (Invitrogen, USA), 0.8mg of the firefly luciferase plasmid DNA and 0.008mg of pRL-TK plasmid DNA (Promega, USA) as an internal control. The transfection medium was removed and replaced with growth medium after 5 h.
The Firefly and Renilla luciferase activities were measured at 24 h after transient transfection using the Dual-Glo Luciferase assay system (Promega, USA) and a TD20/20 luminometer (Turner Designs) according to the manufacturer’s instructions. Each plasmid was tested in three independent experiments. The luciferase activity was normalized using the Renilla luciferase activity levels and expressed as relative luciferase unites (RLU) to reflect the gene promoter activity.
Construction of the MyoD expression vector
The cDNA sequence of the MyoD gene was amplified using mouse muscle mRNA with the primers listed in Table 1. The PCR
product was cloned into the pMD18-T vector (Invitrogen, USA) and then inserted into the EcoRV/NotI sites in the linearized pcDNA3.1(+) vector (Invitrogen, USA). The recombinant plasmid was sequenced by Invitrogen.
Construction of the Sp1 site-directed mutation vector To identify Sp1 as a regulatory factor for theCRABP2gene in C2C12 cells, we constructed a site-directed mutation vector of Sp1. The site-directed mutagenesis of the Sp1 binding site was obtained by a two-step PCR protocol using pMD18 T-A as a template. The original GGC site was mutated to TTA. The mutagenic primers were 59 AGGTGGTGTGGAAGGCGGT-TAGGGGGCGGGGCCGCCTCATGCACCAGCT 39(forward primer) and 59 CCTAACCGCCTTCCACACCACCT 39 (re-verse primer). Thermocycler parameters were set at 95uC for 5 min followed by 27 cycles of 95uC for 30 s, 60uC for 30 s and 72uC for 30 s with a final extension time of 5 min at 72uC. The final PCR product was cloned into pGL3-basic and named pGL3 -muE.
Electrophoretic mobility shift assay (EMSA)
Nuclear extracts from C2C12 myoblasts and myotubes were prepared according to the instruction manual of the NProtein Extraction kit (Exprogen, Beijing, China). The proteins were measured using a BCA Protein Assay Kit (Exprogen, Beijing, China). The probes for MyoD and Sp1 were synthesized by Integrated DNA Technologies (IDT, USA).
The binding reactions were performed in a 10ml mixture containing 1.0ml of 106Binding Buffer, 1.0ml of Poly (dI:dC), 2mg of nuclear extract and 0.5ml of Bio-labelled probes. For the competition experiments, unlabelled probes were added to the binding reaction mixture and co-incubated. Subsequently, DNA-protein complexes were separated by 6.5% non-denaturing polyacrylamide gel electrophoresis in Tris-Boric acid (TBE) buffer. Electroblotting and chemiluminescence detection were performed according to the instructions of the BiotinLightTM EMSA Kit (Exprogen, Beijing, China). Results were observed by chemilumi-nescence imager.
Author Contributions
Conceived and designed the experiments: ZT JY. Performed the experiments: JY. Analyzed the data: JY SY. Contributed reagents/ materials/analysis tools: KL. Wrote the paper: JY ZT.
References
1. Pownall ME, Gustafsson MK, Emerson CP Jr (2002) Myogenic regulatory factors and the specification of muscle progenitors in vertebrate embryos. Annu Rev Cell Dev Biol 18: 747–783.
2. Berkes CA, Tapscott SJ (2005) MyoD and the transcriptional control of myogenesis. Semin Cell Dev Biol 16: 585–595.
3. Edmondson DG, Olson EN (1989) A gene with homology to the myc similarity region of MyoD1 is expressed during myogenesis and is sufficient to activate the muscle differentiation program. Genes Dev 3: 628–640.
4. Weintraub H, Tapscott SJ, Davis RL, Thayer MJ, Adam MA, et al. (1989) Activation of muscle-specific genes in pigment, nerve, fat, liver, and fibroblast cell lines by forced expression of MyoD. Proc Natl Acad Sci USA 86: 5434– 5438.
5. Braun T, Buschhausen-Denker G, Bober E, Tannich E, Arnold HH (1989) A novel human muscle factor related to but distinct from MyoD1 induces myogenic conversion in 10T1/2 fibroblasts. EMBO J 8: 701–709.
6. Miner JH, Wold B (1990) a fourth member of the MyoD family of myogenic regulatory genes. Proc Natl Acad Sci USA 87: 1089–1093.
7. Blackwell TK, Weintraub H (1990) Differences and similarities in DNA-binding preferences of MyoD and E2A protein complexes revealed by binding site selection. Science 250: 1104–1110.
8. Lassar AB, Buskin JN, Lockshon D, Davis RL, Apone S, et al. (1989) MyoD is a sequence-specific DNA-binding protein requiring a region of myc homology to bind to the muscle creatine kinase enhancer. Cell 58: 823–831.
9. Yablonka-Reuveni Z, Rudnicki MA, Rivera AJ, Primig M, Anderson JE, et al. (1999) The transition from proliferation to differentiation is delayed in satellite cells from mice lacking MyoD. Dev Biol 210: 440–455.
10. Hoey T, Weinzierl RO, Gill G, Chen JL, Dynlacht BD, et al. (1993) Molecular cloning and functional analysis of Drosophila TAF110 reveal properties expected of coactivators. Cell 72: 247–260.
11. Kadonagaa JT, Jonesa KA, Tjiana R (1986) Promoter-specific activation of RNA polymerase II transcription by Sp1. Trends Biochem Sci 11: 20–23. 12. Gidoni D, Dynan WS, Tjian R (1984) Multiple specific contacts between a
mammalian transcription factor and its cognate promoters. Nature 312: 409– 413.
13. Bouwman P, Philipsen S (2002) Regulation of the activity of Sp1-related transcription factors. Mol Cell Endocrinol 195: 27–38.
14. Chu S, Ferro TJ (2005) Sp1: regulation of gene expression by phosphorylation. Gene 348: 1–11.
15. Xu JW, Rogers MB (2007) Modulation of Bone Morphogenetic Protein BMP2 Gene Expression by Sp1 Transcription Factors. Gene 392: 221–229.
Table 2.Primers used to make constructs to analyse promoter activity in the study.
Primer Sequence (59– 39) Tm (6C)
Products Length (bp)
C2-AF GCTGCTCATGTCTGCGATTC 61uC 2408 bp
C2-BF AACTGAAAATCATCCCGTTGTG 61uC 1762 bp
C2-CF AGGCAGGGACCTTGTTTGAGAT 61uC 1227 bp C2-DF GGGAAGCGTAGCCACCGA 61uC 833 bp
C2-EF CTGTTTCATTGAGTCCATTTCG 61uC 575 bp
C2-aF CGAGAGAGCATCCGTGACCC 61uC 406 bp C2-bF TATCTTGGCTCTTGGAGAACCC 61uC 294 bp
C2-cF CCCAGCGGCTGTGCAATT 61uC 120 bp
C2-dF AGGATCTGTTCTGCAAAGGAGA 61uC 72 bp
C2-R TCAACTAGAACACTGGACGCTG
C2-A, C2-B, C2-C, C2-D, C2-E, C2-a, C2-b, C2-c and C2-d: Forward primers for construction of the luciferase reporter gene vectors pGL3-A, pGL3-B, pGL3-C,
pGL3-D, pGL3-E, pGL3-a, pGL3-b, pGL3-c and pGL3-d, respectively; C2-R: Reverse
primer for construction of luciferase reporter gene vectors pGL3-A, pGL3-B,
pGL3-C, pGL3-D, pGL3-E, pGL3-a, pGL3-b, pGL3-c and pGL3-d.
doi:10.1371/journal.pone.0055479.t002
16. Thomas K, Wu J, Sung DY, Thompson W, Powell M, et al. (2007) Sp1 transcription factors in male germ cell development and differentiation. Mol Cell Endocrinol 270: 1–7.
17. McGrane MM (2007) Vitamin A regulation of gene expression: molecular mechanism of a prototype gene. Journal of Nutritional Biochemistry 18: 497– 508.
18. Banaszak L, Winter N, Xu Z, Bernlohr DA, Cowan S, et al. (1994) Lipid-binding proteins: a family of fatty acid and retinoid transport proteins. Adv Protein Chem 45: 89–151.
19. Perez-Castro AV, Toth-Rogler LE, Wei LN, Nguyen-Huu MC (1989) Spatial and temporal pattern of expression of the cellular retinoic acid-binding protein and the cellular retinol-binding protein during mouse embryogenesis. Proc Natl Acad Sci USA 86: 8813–8817.
20. Ruberte E, Dolle P, Chambon P, Morriss-Kay G (1991) Retinoic acid receptors and cellular retinoid binding proteins. II. Their differential pattern of transcription during early morphogenesis in mouse embryos. Development 111: 45–60.
21. Ruberte E, Friederich V, Morriss-Kay G, Chambon P (1992) Differential distribution patterns of CRABP I and CRABP II transcripts during mouse embryogenesis. Development 115: 973–987.
22. Bernlohr DA, Simpson MA, Hertzel AV, Banaszak LJ (1997) Intracellular lipid binding proteins and their genes. Annu. Rev. Nutr 17: 277–303.
23. Tang Z, Li Y, Wan P, Li X, Zhao S, et al. (2007) LongSAGE analysis of skeletal muscle at three prenatal stages in Tongcheng and Landrace pigs. Genome Biol 8: R115.
24. Qin RF, Gu XM, Huang FG, Zhang H (2000) Analysis of cell cycle and DNA synthesis during myocytic differentiation by flowcytometry. J Fourth Mil Med Univ 21: 921–923.
25. Black AR, Jensen D, Lin SY, Azizkhan JC (1999) Growth/cell cycle regulation of Sp1 phosphorylation. J Biol Chem 274: 1207–1215.