Water supply and water
stress in the Metropolitan
Region of São Paulo
Wagner Costa ribeiro
A
nAlyzing WAteR supply in São Paulo is a necessary and permanentexercise. the social dynamic that occurs in the main Brazilian metropo-lis imposes new situations at an intense speed that poses challenges to managers, decision makers and civil society. Much less than a static scenario, there is an expansion and renewal urban, accompanied by a high pace of verti-cal expansion, which requires water for the city’s production and infrastructure, thus increasing even further the use of water for urban services such as public sanitation.
in addition, the nearly ten million people living in the municipality require water for personal hygiene, drinking and preparing food, and a smaller though not negligible part of the population also uses water in their leisure activities. However, it is critical to remember at the outset that in São Paulo a significant proportion of water use is intended for industrial purposes.
this set of activities creates a complex scenario of competition for water. An-other important variable is that supply was planned in an integrated manner and on a scale that goes beyond municipal boundaries. therefore, it is necessary to analyze water supply and demand on the scale of the Metropolitan Region of São Paulo (MRSP). Part of the water used comes from municipalities located in another state of the federation, which forces taking the analysis to the federal scale, thus increasing the complexity of solving the water supply issue in the largest urban center in Brazil.
issue of water supply and use in the MRSP is discussed next, followed by the conclusions.
Assessing the extent of the problem
Some pieces of information are important in discerning the extent of the problem, which should be assessed at various scales, each of them posing chal-lenges that need to be tackled jointly by the different government spheres.
According to preliminary data from the 2010 Census carried out by the Brazilian institute of geography and Statistics (iBge),1 the State of São Paulo has reached the mark of 41,252,160 inhabitants. that same year, the munici-pality of São Paulo had a population of 11,244,369. the population of the MRSP was estimated at about 20 million and the overall Brazilian population at 190,732,694 (iBge, 2010). the population of the MRSP is spread over an area of about 8,051 km²,2 which covers about 0.1 percent of the Brazilian territory, but is concentrated on an urban sprawl of about 2,209 km². Herein rests the first challenge to be faced: bringing quality water to the more than 10 percent of the Brazilian population concentrated in less than 0.1 percent of the country!
table 1 gives an overview of the problem on other scales. it aggregates information from metropolitan regions of São Paulo and enables positioning them in relation to Brazil and the State of São Paulo.
table 1 - Metropolitan Regions, State of São Paulo and Brazil. Area and Population: 2006
Location Area Population
km² State (%)
Brazil
(%) Inhabitants
State (%)
Brazil (%)
Metropolitan
regions 14,097 5.68 0.16 24,031,058 58.54 12.87
São Paulo 8,051 3.24 0.09 19,677,506 47.93 10.54
Baixada Santista 2,373 0.96 0.03 1,666,453 4.06 0.89
Campinas 3,673 1.48 0.04 2,687,099 6.55 1.44
State of
São Paulo 248,209 2.92 41,055,734 21.98
Brazil 8,514,876 186,770,562
Source: emplasa. Available at:
<http://www.emplasa.sp.gov.br/portalemplasa/infometropoli-tana/metropoles/tabelas_metropoles/tabela11.htm>. Access in Jan. 2011.
0.16% of the country’s area, but accounted for 12.9 percent of the Brazilian population. this concentration was labeled macro-metropolis by the govern-ments of the State of São Paulo, as shown in Map 1.
Source: emplasa. Available at: <http://www.emplasa.sp.gov.br.htm>.
Map 1 – Macro-metropolis of São Paulo
the map shows a number of urban sprawls that have the city of São Paulo as the main and catalyst center. it also enables verifying the proximity between the metropolitan regions. the distance by road from Campinas to Santos, passing through São Paulo, is ap-proximately 171 km, which could be covered in just over two and a half hours by truck.3
the Metropolitan Region of Campinas houses the State University of Campinas, an important state university that attracts high-tech companies, such as those that comprise the Center for Research and Development (CPqD) es-tablished in 1976 by telebrás, then a public company that held the monopoly of telecommunications services in Brazil, and where important technological products were developed, such as the public telephone cards that remain in use to date. With the Privatization of telebrás in 1998, the CPqD became a pri-vate foundation for technological development in the area of communications and remains true to its vocation of developing new technologies. However, in addition to sectors that rely on research infrastructure, the region is home to the automotive industry and an important center of textile production, which comprises several municipalities of which Americana - a water-intensive city - is the most relevant.
Metropolitan Regions of São Paulo Metropolitan Regions of Campinas Metropolitan Regions of Baixada Santista Urban Sprawls
Area of strong Economic and Social activity
Municipal Boundaries Boundaries of Metropolitan Regions Roads
Beltway North Stretch East Stretch South Stretch West Stretch
MACRO-METROPOLIS
Ports Airports Source: Geographic and Cartographic Institute – IGC,
the Metropolitan Region of Santos, in turn, in addition to housing the Cubatão petrochemical center (another water-intensive segment), attracts tour-ists from São Paulo, thus requiring a lot of water seasonally (it is not rare for up-scale gated communities in the beaches of guarujá, for example, to be without water during long weekends and school holidays, and the same applies to most popular beaches, which attract even more people). the presence of the Port of Santos in the region is essential. it is through this port that the production of the metropolitan regions of Campinas and São Paulo is exported. imported inputs for industrial production in those locations also come through this port. the Port of Santos is Brazil’s largest port in terms of the amount and price of transported material and has a strategic role for the country.
the Metropolitan Region of São Paulo, on the other hand, has a diversified economic activity. While services prevail in the economy of the city of São Paulo, in-dustrial activity is critical in municipalities like Diadema, guarulhos, Santo André, São Caetano and São Bernardo do Campo. in municipalities such as Mogi das Cruzes, despite the relevance of the industrial sector, the agricultural production that supplies the metropolis of São Paulo is also crucial. So, the Metropolitan Region of São Paulo is more complex than the previous ones, since it has a high range of different water-intensive economic activities, thus leading to competition for water use.
As if the two aforementioned dense neighboring metropolitan regions weren’t enough, the Metropolitan Region of São Paulo is surrounded by two other very dynamic areas from the economic standpoint, resulting in an acceler-ated urbanization process. Map 1 shows on the right of the metropolis of São Paulo the Paraíba Valley, where a large urban sprawl is emerging, which stretches from São Paulo to Rio de Janeiro. this area of the state territory is also home to water-intensive industries, especially in São José dos Campos which, like Campi-nas, houses water-intensive industries such as the petrochemical and automotive assembly industries and technology-based industries like the Armament industrial Complex that grew near the Air Force technology Center created in the second half of the twentieth century through a series of government actions that resulted in companies engaged in the production of aircraft for civil and military use, arms production and generation of communication systems. taking the map as a ref-erence, to the left of the Metropolitan Region of São Paulo is another dynamic area based on industrial development from Sorocaba, where propellers for wind energy generation systems are produced for export. the presence of new higher education institutions in the region, such as the Sorocaba campus of the Federal University of São Carlos, indicates that we will soon be seeing more technology-based industries in this portion of the state territory.
allows planning to organize activities to avoid large water and energy demands and the generation of large amounts of garbage. in other words, it is essential to define new forms of water governance4 because the problems transcend physical boundaries, such as those in the Upper tietê Basin, as well as political boundar-ies, such as municipal and state divisions, given that water is captured in Minas gerais. All difficulties should be carefully considered before new activities are implemented and end up exacerbating tensions over water use within the largest urban concentration in Brazil.
next we will see how the current use of water in the Metropolitan Region of São Paulo already points to water supply problems.
Water supply and water use in the Metropolitan Region of São Paulo
Whatever the territorial unit (municipality, state, country or even Met-ropolitan Region - which is not a political unit), one needs to be aware of two premises when discussing the political geography of water: the use of water re-sources and water supply (Ribeiro, 2008).
the use of water is very diverse and can generate more or less need for water. it should also be discussed in the light of the best technique used, which is not always the one with the highest productivity. in times of water footprint5 the amount of water used for the production of a given product is a differential that will soon need to be taken into account by consumers. in other words, the time is not far when we will see in the package of a product (either agricultural or industrial) the amount of water required for the product to be produced, allowing consumers to choose the one that uses the least amount of water. this is not a simple appeal to eco-efficiency, but a necessity that emerges from limited water supply in many places.
Addressing the water supply issue requires recalling some concepts. the first, is renewed water, which is quantified from the amount of rainfall and must be taken from evaporating water, plus the water required for ecosystem services (maintenance of natural systems, such as water used by other living beings to survive and reproduce, thus improving biodiversity conservation). this is the amount of water that will go into the system seasonally, which can be measured through statistical calculations for establishing the volume with greater preci-sion from time series measurements of rainfall in a territorial location, provided that the volume of water required to maintain the natural dynamic necessary for the preservation of the natural systems that occur in that area is also known.
The quality of the water in the Guarapiranga dam may be compromised.
Water supply is the amount of water per capita available in a territorial unit. it can be obtained by the sum of renewed water and the water stock (average flow of rivers or known volume in aquifers), the result of which should be divided by the population of the territorial unit. there are two ways accepted in the literature that seek to assess water supply: water scarcity and water stress (ibid., 2008).
the first can be physical, when the volume of water is insufficient to supply the population and stems, generally from low levels of rainfall or when water use exceeds water supply. the second occurs when there are no financial resources to capture and bring water from other points to the consumption area. Water stress is “the result of the relationship between the total water used annually and the difference between rainfall and evaporation (renewed water) occurring in a territorial unit” (ibid., 2008).
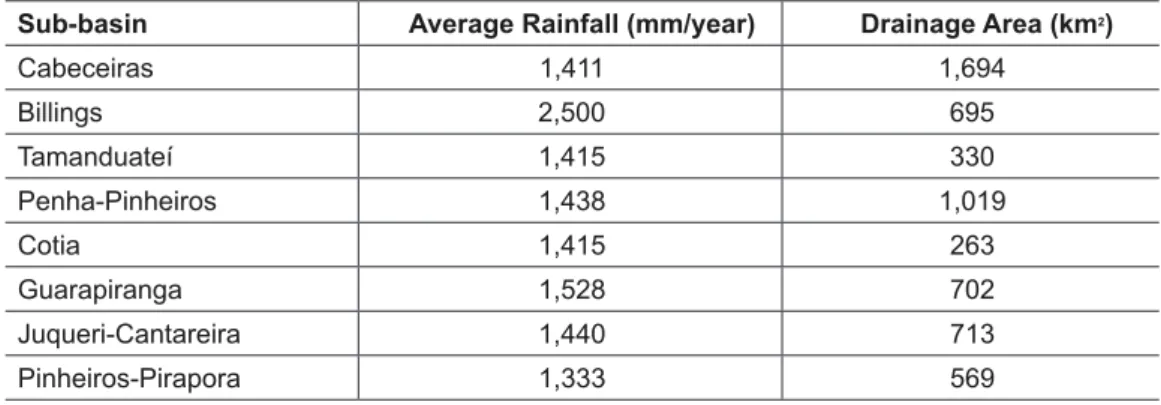
the data on rainfall indicated the following situation for the MRSP, sum-marized in table 2.
table 2 - Rainfall averages in sub-basins
Sub-basin Average Rainfall (mm/year) Drainage Area (km2)
Cabeceiras 1,411 1,694
Billings 2,500 695
Tamanduateí 1,415 330
Penha-Pinheiros 1,438 1,019
Cotia 1,415 263
Guarapiranga 1,528 702
Juqueri-Cantareira 1,440 713
Pinheiros-Pirapora 1,333 569
Source: Committee of the Hydrographic Basin of the Upper tietê (2000).
the average annual rainfall reaches 1,400 mm in the MRSP (Commit-tee.., 2002). However, the rains do not occur uniformly and reach 3,000 mm near the Mar Mountain Chain (FUSP, 2009). table 2 indicates that the ar-eas of the sub-basins of Billings and guarapiranga are those with the high-est amounts of rainfall (average of 2,500 and 1,528 mm / year, respectively). through this indicator, does not enable sayiing that São Paulo is under water scarcity.
municipalities, including floods in periods of heavy rain, or contamination of the water used to supply the municipalities.
even if rain waters during the rainy season were captured and treated, they would not be sufficient to change the water supply scenario in the MRSP (Ribeiro, 2004). According to the Plan for the Hydrographic Basin of the Upper tietê River:
the total consumption of water from the basin exceeds by far its own water production. the production of water for public supply today is 67.7 m3/s, of which 31 m3/s are imported from the Piracicaba River Basin located north of the Upper tietê River Basin, and 2.0 m3/s from other minor reversals of the Capivari and guaratuba rivers. this volume serves 99 percent of the Basin population. the Basin also consumes 2.6 m3/s for irrigation, and industrial de-mand is partially met by the public system (15 percent of the total distributed) and partly by its own supply through the capturing and extraction of ground-water. (FUSP, 2009, p.58)
the technical language leads the reader to imagine something that does not actually occur in nature. there is no water production, as stated in the above excerpt. experts refer to a basin’s capacity to retain water in use conditions. Wa-ter as a substance is not produced. even in desalination it is not produced, but rather separated from other chemical elements through heating, which uses a lot of energy. Others criticize the use of this language in the belief that it associ-ates water supply to water sale, one of the premises of the privatization of water services adopted in various places worldwide since the 1990s as a World Bank guideline. For the advocates of this form of water supply, treating water by add-ing to it chemical elements such as fluorine, for example, would be sufficient to submit water to an “industrial processing” and, therefore, add value to it. this is very different from assessing the costs, which are not few, of collecting, treating and distributing water, which should be funded by the state because it is a vital substance to life that cannot be transformed into a source of profit.
Also worth noting is the information that industrial production captures 15 percent of the total water distributed and the rest of the industrial water supply is “produced by the industries themselves by capturing and extracting groundwater.” the questions to be asked are: How much of this water captured for industrial purposes is identified by the State? How much has been granted? And if the capture is legal, is there inspection to assess how much water is taken? this is a topic that should be examined more carefully.
the uncontrolled extraction of groundwater can result in supply problems
in the short and medium term.7 the natural drawdown of the water table in
reduc-tion in the volume of groundwater captured. in general, entrepreneurs take the initiative to drill new wells, once again without studying the natural conditions of the area, the flow and dynamics of groundwater, which can result in intensive use and misuse of groundwater resources in a cyclic way. the presence of the inspection agency is therefore crucial, despite the difficulties in controlling this type of water extraction. Users know that it is difficult for authorities to identify each well drilled and, especially, to control the amount of water extracted and, therefore, take much advantage of this situation.
thus, the main sources of supply are surface waters. table 3 indicates the water sup-ply capacity by production system, as expressed by the Basic Sanitation Company of the State of São Paulo (Companhia de Saneamento Básico do estado de São Paulo - Sabesp).
table 3 - Water availability in the MRSP by production system
Production system Production – Sabesp (m3/s)
Cantareira 33
Upper Tietê 10
Rio Claro 4
Upper Cotia 1
Lower Cotia 0.9
Grande 4.8
Billings/Guarapiranga 14
Total 67.7
Source: Fusp (2009).
contaminated by environmentalists, but which despite the exposure was incor-porated to supply water to the population in 2000.9 the Upper tietê River, in turn, includes the nova Ponte, Paraitinga, Biritiba, Jundiaí and taiaçupeba reservoirs. the waters of the Ponte nova and Paraitinga reservoirs reach the bed of the tietê River, where they are diverted into the Biritiba reservoir. From this point on they flow through the Jundiaí reservoir to the taiaçupeba reservoir.
the use of water is very unequal in the MRSP, as shown in Figure 1.
Source: Fusp (2009).
Figure 1 – Distribution of concessions for water extraction from the Upper tietê River – %
Although public supply prevails with 58 percent of water concessions, in-dustrial use is still very important, with 39 percent of concessions. it is impor-tant to bear in mind that these 58 percent are used to supply about 20 million people, while industrial use is concentrated in water-intensive industries.
examples of situations that should be reviewed include Petroquímica União, Suzano Papel e Celulose and Clariant, on the margins of the tietê River, upstream of the city of São Paulo, which are mentioned in the Plan for the Up-per tietê River Basin, and together have a larger concession, by amount, than the concession to the municipality of Mogi das Cruzes. it is essential to review the presence of water-intensive industrial activities in the MRSP. Will the total num-ber of jobs and taxes they generate justify keeping them? Or would it be more advantageous for the population to rearrange them and increase water supply?
the distribution of concessions for water catchment indicated zero per-cent for power generation, which is nonetheless curious. A significant portion of
Irrigation 1%
Industrial 39%
Hydro-agricultural 0%
Energy Generation 0%
Public Supply 58% Others
0% Sanitary
1% Emergencies
0% Health/Industrial
1% Mining
the water accumulated in the Billings dam, for example, is intended for power generation at the Henri Borden plant in Cubatão, which is located in the Met-ropolitan Region of Santos, in the macro-metropolis of São Paulo. it is also relevant to point out the intention of the Metropolitan Water and energy
Com-pany (empresa Metropolitana de Água e energia S. A. - eMAe)10 to resume
power generation at the edgar de Souza plant, due to electricity shortage that currently plagues the MRSP.
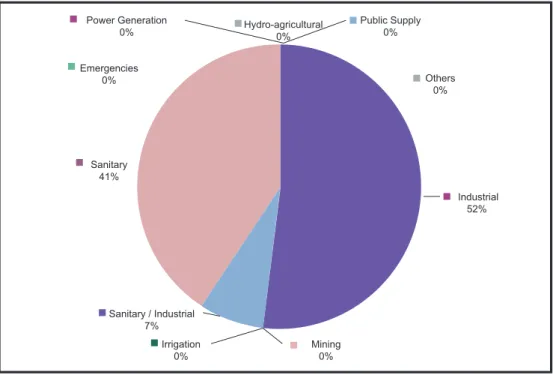
in relation to concessions for water release into the Upper tietê River, Figure 2 shows that industries have more concessions (52 percent), followed by sanitary use (41 percent). this situation reflects a mismatch between catchment and release. it would be desirable that the sanitary sector accounted for the larg-est volume captured, but this does not occur due to the lack of wastewater col-lection in part of the network. in turn, the fact that industries release more than they capture confirms that they use both alternative and own sources for water catchment, such as groundwater, and that is why their release levels exceed their catchment levels.
Source: Fusp (2009).
Figure 2 – Distribution of concessions for water release into the Upper tietê River – %.
Final remarks
there is no doubt that water supply in the MRSP is insufficient, consider-ing the volume offered vis-à-vis the population. Furthermore, water catchment involves neighboring states and sharing water with other surrounding cities, which requires seeking alternatives that take into account very different and
Power Generation 0%
Emergencies 0%
Sanitary 41%
Sanitary / Industrial 7%
Irrigation 0%
Mining 0%
Industrial 52% Others
0% Public Supply
0% Hydro-agricultural
even antagonistic interests. Another aspect to consider is the presence in both the east and the west of two water-intensive industrial and urban development complexes, thus precluding the discussion of alternatives such as water catch-ment at these sites.
Special mention should also be made of the important initiative of the state government of São Paulo to define a macro-metropolis in the state. there are indeed complementary activities between the three metropolitan regions that enable linking these areas, which should be assessed together. they account for over 58 percent of the state population, concentrated in an area of about 6 percent, where the most significant activities from the economic, financial and government services standpoint are concentrated. in relation to Brazil, they represent about 12 percent of the country’s overall population!
it is essential to define a form of political action that ensures the macro-metropolis coordinated management capacity. Otherwise, the important exer-cise of regionalization will become but the draft of a public policy. Advancing in this direction is paramount, and thus some suggestions offered include:
• establishing a Political Council for each Metropolitan Region with
representatives of organized sectors of civil society (workers, industry, trade, universities, environmentalists and politicians) to assess medium and long-term trends of economic development, which should guide the reduction of social inequalities;
• establishing a Political Council for the macro-metropolis, involving the same sectors mentioned above, with representations of the three metropolitan regions;
• Working with mayors to define, based on suggestions from the aforemen-tioned Political Councils, coordinated public policies capable of ensuring access to quality water by the populations of the macro-metropolis. Another aspect that needs to be discussed is the use of water in the MRSP. Although intended mostly to the public supply sector, it is insufficient and may collapse in the short term, should the current growth levels of water consump-tion be maintained. therefore, it is essential to begin the discussion of what one wants to do with the water in the largest Brazilian metropolis. Should water-intensive industries be maintained in view of the current scenario of water stress? is it fair to allow the extraction of groundwater for industrial purposes through one’s own means in a scenario of water stress?
in relation to these aspects, the following suggestions are offered:
• Setting clear parameters, with discussion among the various sectors for the extraction of groundwater for industrial purposes.
• Assessing the relevance of maintaining water-intensive industries in the MRSP.
• increasing sewage treatment, which ultimately releases water for sec-ondary uses, such as industrial use.
the scenario is uncomfortable, since the lack of quality water is immi-nent. Heavy rains enable the partial replacement of water supply, which does not lead the Metropolitan Region of São Paulo to a situation of water shortage, but rather of water stress, given the difficulty in getting quality water for public supply. therefore, it is necessary and urgent to discuss the fate of water use, in order to avoid constraints and increased tensions. in this regard, there are ways of communication and democratic exercise of power in place which, however, have been insufficient to organize water supply in the macro-metropolis of São Paulo. Betting on governance, on the involvement of the various segments in-terested in the topic is the most viable alternative, albeit slow, for solving con-flicts over access to quality water.
notes
1 Data available at: <http://www.censo2010.ibge.gov.br/primeiros_dados_divulga-dos/index.php>. Access in Jan. 2011.
2 Data available at: <http://www.emplasa.sp.gov.br/portalemplasa/infometropolita-na/rmsp/rmsp_dados.asp>. Access in Jan. 2011.
3 Data available at: <http://www1.dnit.gov.br/rodovias/distancias/distancias.asp>. Access in Jan. 2011.
4 there are analyses of water governance in the State of São Paulo, as the ones conduc-ted by Ribeiro (2009), Jacobi (2010) and Fracalanza et al. (2010).
5 For further information see Hoekstra et al. (2011).
6 Pereira Filho et al. (2007) analyzed the atmospheric conditions in situations of floo-ds of great magnitude in São Paulo and identified two relevant aspects: increase of around 395 mm in rainfall and of about 2.1 degrees Celcius in temperature. they associated these conditions with the heat island (warmer areas within the metropolis, analyzed also by lombardo (1985)) and the urbanization process.
7 For an analysis of the environmental consequences of groundwater extraction see Villar & Ribeiro (2009).
8 For an analysis of the concept of risk in today’s world see zanirato et al. (2008). 9 the doctoral thesis of Mayla Matsuzaki (2007, p.119), defended at the School of
Public Health, University of São Paulo, stated in its conclusions that “the trans-fer of water from the taquacetuba arm may be influencing the water quality in the guarapiranga Dam, especially in relation to nutrient concentrations and densities of potentially toxic cyanobacteria.” Furthermore, when analyzing the waters of the gua-rapiranga and Billings dams, the author found chemicals and cyanobacteria at levels above those allowed by law.
independent companies: Metropolitan Water and energy Company S.A. (empresa Metropolitana de Água e energia S. A.), Metropolitan eletropaulo - electricity of São Paulo S.A. (eletropaulo Metropolitana – eletricidade de São Paulo S. A.), Ban-deirante energy Company S.A. (empresa BanBan-deirante de energia S. A. - eBe) and electricity transmission Company of São Paulo S.A. (empresa Paulista de transmis-são de energia elétrica - ePte).
References
COMMittee OF tHe HyDROgRAPHiC BASin OF tHe UPPeR tietÊ Ri-VeR. Plano de Bacia do Alto Tietê. São Paulo, 2002.
FRACAlAnzA, A. P. et al. governança das águas da Região Metropolitana de São Paulo (Brasil) – o caso do Comitê da Bacia Hidrográfica do Alto tietê. in: JACOBi, P.; SiniSgAlli, P. de A. (Org.) Dimensões político institucionais da governança da água na América Latina e Europa. São Paulo: Annablume, 2010.
FUSP – FOUnDAtiOn OF SUPPORt tO tHe UniVeRSity OF SÃO PAUlO. Plano da Bacia Hidrográfica do Alto tietê, São Paulo, 2009. (four volumes and exe-cutive summary).
HOeKStRA, A. et al. The water footprint assessment manual: setting the global
stan-dard. london: earthscan, 2011.
JACOBi, P. R. (Org.) Atores e processos na governança da água. São Paulo: Annablume,
2010.
lOMBARDO, M. A. Ilha de calor nas metrópoles: o exemplo de São Paulo. São Paulo:
Hucitec, 1985.
PeReiRA FilHO, A. J. et al. impactos antrópicos no clima da Região Metropolitana de São Paulo. Boletim da Sociedade Brasileira de Meteorologia, v.30, p.48-56, 2007.
MAtSUzAKi, M. Transposição das águas do braço Taquacetuba da represa Billings para a represa Guarapiranga: aspectos relacionados à qualidade de água para abastecimento.
São Paulo, 2007. thesis (PhD) – School of Public Health, University of São Paulo. RiBeiRO, W. C. gestão das águas metropolitanas. in: CARlOS, A. F. (Org.)
Geogra-ias de São Paulo: a metrópole do século XXi. São Paulo: Contexto, 2004. _______. Geograia política da água. São Paulo: Annablume, 2008.
_______. (Org.) Governança da água no Brasil: uma visão interdisciplinar. São Paulo:
Annablume, 2009. VillAR, P. C.; RiBeiRO, W. C. Sociedade e gestão do risco: o aquífero guarani em Ribeirão Preto-SP, Brasil. Revista de Geograia Norte Grande, n.43, p.51-64, 2009.
zAniRAtO, S. H. et al. Sentidos do risco: interpretações teóricas. Biblio 3W, Revista-Bibliográfica de geografía y Ciencias Sociales, Universidad de Barcelona, v.Xiii, n.785, 25 mayo 2008. Available at: <http://www.ub.es/geocrit/b3w-785.htm>.
Online sources
politana/me-tropoles/tabelas_metropoles/tabela11.htm>. Access in Jan. 2011. eMPlASA – <http://www.emplasa.sp.gov.br.htm>. Access in Jan. 2011.
eMPlASA – <http://www.emplasa.sp.gov.br/portalemplasa/infometropolitana/rmsp/ rmsp_dados.asp>. Access in Jan. 2011.
iBge – <http://www.censo2010.ibge.gov.br/primeiros_dados_divulgados/index. php>. Access in Jan. 2011.
abstraCt – this text aims to analyze water supply and water stress in the Metropolitan
Region of São Paulo. to this end, based on secondary data, documents were analyzed in light of the literature to discuss the supply and use of water resources. the conclu-sions indicate the need to raise the debate on water use and establish new water mana-gement forums involving actors beyond the metropolitan scale.
KeyWords: São Paulo, Water supply, Water stress, Water governance, Water resources.
Wagner Costa Ribeiro is a professor at the School of Philosophy, letters and
Hu-man (FFlCH-USP) and a researcher at the institute of Advanced Studies (ieA-USP) and the national Council for Scientific and technological Development (CnPq). @ – [email protected]