Prostate specific antigen and acinar density: a new
dimension, the “Prostatocrit”
_______________________________________________
Simon Robinson
1, Marc Laniado
1, Bruce Montgomery
11 Frimley Park Foundation Trust, United Kingdom
ABSTRACT
ARTICLE
INFO
______________________________________________________________ ______________________
Background: Prostate-specific antigen densities have limited success in diagnosing prostate cancer. We emphasise the importance of the peripheral zone when considered with its cellular constituents, the “prostatocrit”.
Objective: Using zonal volumes and asymmetry of glandular acini, we generate a pe-ripheral zone acinar volume and density. With the ratio to the whole gland, we can better predict high grade and all grade cancer. We can model the gland into its acinar and stromal elements. This new “prostatocrit” model could offer more accurate nomo-grams for biopsy.
Materials and Methods: 674 patients underwent TRUS and biopsy. Whole gland and zonal volumes were recorded. We compared ratio and acinar volumes when added to a “clinic” model using traditional PSA density. Univariate logistic regression was used to find significant predictors for all and high grade cancer. Backwards multiple logistic regression was used to generate ROC curves comparing the new model to conventional density and PSA alone.
Outcome and results: Prediction of all grades of prostate cancer: significant variables revealed four significant “prostatocrit” parameters: log peripheral zone acinar den-sity; peripheral zone acinar volume/whole gland acinar volume; peripheral zone aci-nar density/whole gland volume; peripheral zone aciaci-nar density. Aciaci-nar model (AUC 0.774), clinic model (AUC 0.745) (P=0.0105).
Prediction of high grade prostate cancer: peripheral zone acinar density (“prostatocrit”) was the only significant density predictor. Acinar model (AUC 0.811), clinic model (AUC 0.769) (P=0.0005).
Conclusion: There is renewed use for ratio and “prostatocrit” density of the peripheral zone in predicting cancer. This outperforms all traditional density measurements.
Keywords:
Acinar Cells; Prostatic Neoplasms; Diagnosis; PSA
Int Braz J Urol. 2017; 43: 230-8
_____________________ Submitted for publication: April 12, 2016
_____________________ Accepted after revision: October 15, 2016 _____________________ Published as Ahead of Print: January 05, 2017
INTRODUCTION
PSA and derived densities, whole gland density, PSAD (1, 2) and the transition zone density PSATD (3), have a limited role in diag-nosing cancer despite initial optimism. This is partly due to age related changes (4).We propose a new way of using the zones of the prostate
PSA into the differing amounts of acini within zones of differing volumes.
The peripheral zone is an intrinsically more stable entity (in terms of volumes and re-lative amounts of stroma and acini). This allo-ws an intuitive approach to use volumes with appropriate densities (not the arbitrary divising of entire PSA into the transition zone). It is the-se acinal cells that produce PSA, a marker of epithelial activity, and which undergo mitotic events causing cancer. Regardless of the nature of the nodule, there is always an increase in stroma relative to epithelium (8) and a diluting effect on glandular components. We have taken the overall glandular quantity in the entire gland to be 70%, most of which is concentrated in the peripheral zone (6, 8-10). This varies with age. The peripheral zone is far less variable in acini and stroma, and we extrapolate our other values from this constant entity.
We can better predict cancer of all gra-des, and more importantly, better predict high grade cancer than conventional densities. Fi-nally, we propose that we will be able to model both the benign gland as it ages, in terms of each zone, its divisions into acinar and stromal elements, and further, that we can contrast this with the relative growth dynamics of the malig-nant gland.
MATERIALS AND METHODS
Our study population included 672 pa-tients admitted to a district general hospital, for transrectal ultrasound and biopsy, from 2007 to 2012, because of elevated PSA, anxiety or abnor-mal rectal exam. This was performed by one phy-sician. The inner gland and the outer, peripheral zone were measured. 409 were benign and 263 malignant. We measured the whole gland volume (WGv) using the ellipsoid formula, then the inner gland (transition zone and central gland combi-ned). We subtracted this from the WGv to yield the peripheral zone volume (PZv). We documen-ted those with a positive family history, a first degree relative affected by prostate cancer. Also whether they had had a previous negative biopsy
and whether the prostate felt suspicious of cancer or was clearly malignant (Table-1).
We have accepted the established glandu-lar, acinar component of the prostate of 70%. The WGv x 0.7 yields the whole gland acinar volume (WGav). By definition, 1–WGav yields the who-le gland stromal volume (WGsv). The peripheral zone was attributed a percentage of 80%. 0.8 x PZv yields the peripheral zone acinar volume (PZav).
1-PZav yields the peripheral zone stromal volume (PZsv). The WGav – PZav yields the tran-sition zone acinar volume (TZav).
1-TZav yields the transition zone stromal volume (TZsv) (Figure-1). Figure-2 demonstrates how the zones vary with a growing gland.
Densities
The serum PSA is divided into WGav to yield the whole gland acinar density. The pe-ripheral zone acinar density is calculated by multiplying the WGad times the ratio of the PZav/WGav.
The transition zone acinar density is WGad–PZad.
Formula:
0.7WGv = WGav PSA/Wgav = WGad 0.8PZv = PZav Wgav - Pzav = TZav
WGad x PZav/Wgav = PZad WGad - Pzad = TZad
WGv - Wgav = WGsv TZv - Tzav = TZsv PZv - Pzav = PZsv
Statistics
RESULTS
See Table 1 See Table 2 See Table 3
See Figure 3 See Figure 4
DISCUSSION
Developing the model
To tackle the problem of PSA and its va-riable zonal densities, we need to take into account the distribution of acini within the gland in the nor-mal man and the age related changes of hyperplasia within nodules. The periphery was noted, in autop-sies, to account for most of the glandular material (6) and the inner gland to account for most of the ducts and stroma. The asymmetry of gland
distri-bution was further enforced when normal (autop-sy) and enlarged (suprapubic prostatectomy) glan-ds were compared (8). In the glanglan-ds with benign prostatic hyperplasia, the glandular component was only 12% and this was mostly due to “dilution” by stromal growth. Growth rates were elucidated sho-wing two phases, a rapid increase in growth from ten years old to thirty years then a slow gradual increase from thirty onwards. The normal stroma constituting about 50% of the mass and epithe-lium and acinal lumen the other 50%. Hyperplasia is associated with growth of both components to varying degrees (11). The ratio of stroma to epi-thelium, within adenomas, varies with symptoms (4.6) and without symptoms (2.6) (12). The stroma forms 62% of the symptomatic gland and epithe-lium 38%. The conclusion is that BPH is primarily a stromal process. Using enzymatic staining it was found the stroma to constitute 76% (12, 13) and that it is the ratio increase leading to symptoms.
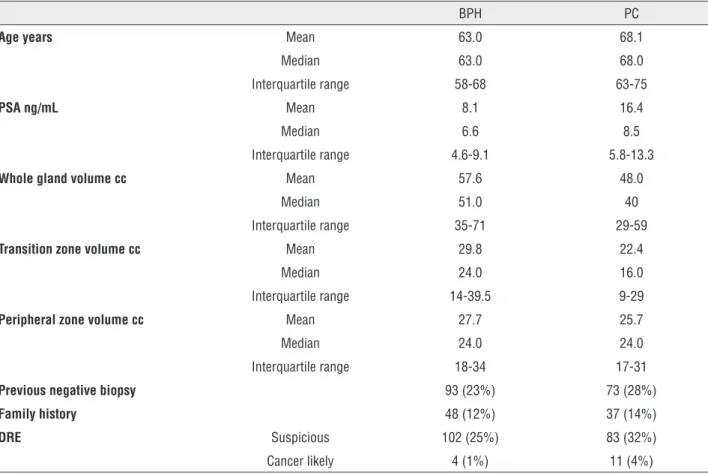
Table 1 - Patient characteristics.
BPH PC
Age years Mean 63.0 68.1
Median 63.0 68.0
Interquartile range 58-68 63-75
PSA ng/mL Mean 8.1 16.4
Median 6.6 8.5
Interquartile range 4.6-9.1 5.8-13.3
Whole gland volume cc Mean 57.6 48.0
Median 51.0 40
Interquartile range 35-71 29-59
Transition zone volume cc Mean 29.8 22.4
Median 24.0 16.0
Interquartile range 14-39.5 9-29
Peripheral zone volume cc Mean 27.7 25.7
Median 24.0 24.0
Interquartile range 18-34 17-31
Previous negative biopsy 93 (23%) 73 (28%)
Family history 48 (12%) 37 (14%)
DRE Suspicious 102 (25%) 83 (32%)
That PSA is related to prostate size, the amount of epithelium and testosterone was well established. But size is not a good predictor of PSA because of the great variation in acini and whole gland volume with a range of stromal com-ponent (14). It was proposed that epithelium itself
Figure 2 - Prostate gland with variation in whole gland size and peripheral zone as 20, 40, 60% of whole gland volume.
is not a good guide to the amount of PSA because the architecture of acini can be disrupted by dise-ase processes both benign and malignant. Further, PSA secretion is androgen independent and this wanes with advancing years.
The predominance of epithelium within the PZ compared to TZ, yet the lack of correlation of PSA with the PZ and the greater correlation of PSA with TZ has been confirmed (7). Further, the variability of the TZ and the relative constancy of the PZ is documented. The confounding problem of PSA is that it appears to be highly dependent on the TZ rather than the PZ. The rate of BPH epithe-lium growth is x 9 the normal gland rate and stro-mal growth within BPH x 37 the norstro-mal rate (15). In regard to ratio, the converse is true for cancers.
The androgen receptor is present in both stroma and epithelium, but 5 alpha reductase is only present in stromal cells and that they have an inductive influence on the epithelium (16). The
Whole gland volume 20cc top row; Whole gland volume 40cc middle row; Whole gland volume 80cc bottom row
Figure 1 - Normal gland 20cc schematic diagram. 70% PZ by volume 30% TZ by volume. PZ 80% acini 20% stroma (cells red, lumen black, stroma pink).
20cc whole gland peripheral zone 70%
20cc whole gland peripheral zone 20%
20cc whole gland peripheral zone 40%
20cc whole gland peripheral zone 60%
40cc whole gland peripheral zone 20%
80cc whole gland peripheral zone 20%
80cc whole gland peripheral zone 40%
80cc whole gland peripheral zone 60% 40cc whole gland peripheral zone 60% 40cc whole gland
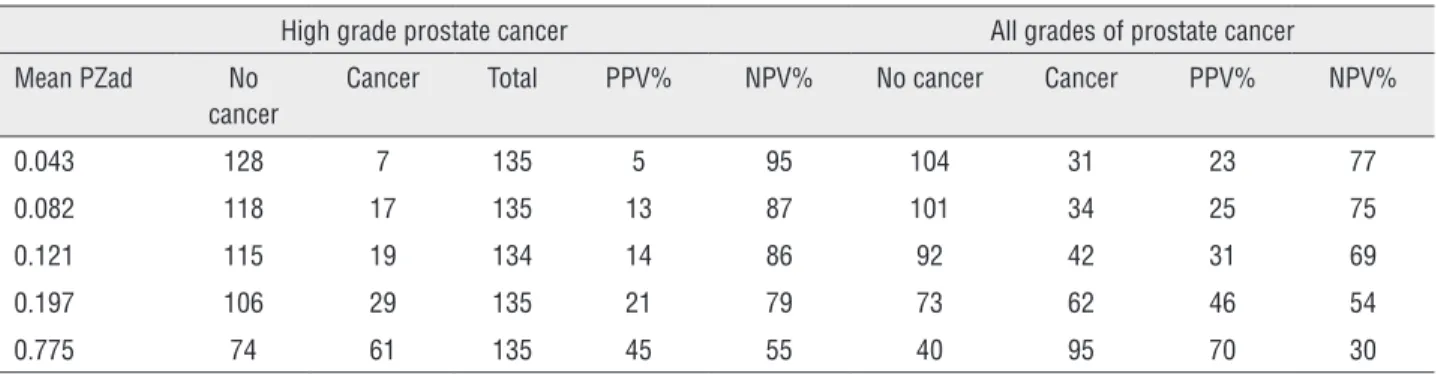
Table 3 - Positive and negative predictive values (PZad).
High grade prostate cancer All grades of prostate cancer
Mean PZad No cancer
Cancer Total PPV% NPV% No cancer Cancer PPV% NPV%
0.043 128 7 135 5 95 104 31 23 77
0.082 118 17 135 13 87 101 34 25 75
0.121 115 19 134 14 86 92 42 31 69
0.197 106 29 135 21 79 73 62 46 54
0.775 74 61 135 45 55 40 95 70 30
Table 2 - All grade and high grade models.
All grade model
Variable Coefficient Standard error P Odds ratio Confidence interval
Age 0.089 0.01 <0.0001 1.09 1.067-1.11
DRE = cancer 2.14 1.07 0.0466 8.5 1.03-70.0
Family history positive
0.57 0.27 0.0382 1.7 1.03-3.08
LnPZAd 0.58 0.16 0.0003 1.8 1.30-2.48
Previous negative biopsy
-0.55 0.24 0.0218 0.57 0.35-0.92
PZAv/WGAv 1.43 0.62 0.0223 4.18 1.22-14.28
PZAd/WGv 60.1 26.23 0.0219 129E+24 6058-2.77E+048
PZAd -1.34 0.67 0.0470 0.26 0.06-0.98
High grade model
Age 0.06 0.014 <0.0001 1.07 1.04-1.10
DRE suspicious 0.61 0.240 0.0103 1.85 1.15-2.96
DRE cancer 3.49 1.105 0.0015 33.08 3.79-288.7
Ln PZad 0.98 0.134 <0.0001 2.67 2.05-3.49
Previous negative biopsy
-0.69 0.330 0.0346 0.49 0.26-0.95
Variables not included in all grade model; DRE suspicious; PSA; Race Caucasian; Race Afro-Caribbean; PZD; TZD; PSAD (WGD)
Variables not included in high grade model; family history; PSA; PZAD/WGV; PZAV/WGAV; PZD; Race Caucasian; Race Afro-Caribbean; TZD; PSAD (WGD)
range of influencing factors are categorised as in-trinsic and exin-trinsic and there is no simple relation to androgen levels (17). We see in our cohort that the BPH glands are bigger overall, with larger tran-sition zones, a similar size of peripheral zone and that the patients are younger than those with ma-lignant glands (Table-1).
Ever since PSA was first localized to the gland (18) its exact use in diagnosis has been
problem with assessing the gland is the great va-riability in the TZ ranging from 2-80% of the total volume (19, 20). Recent studies (21) fail to diffe-rentiate cancer using PSAD. Further refinement was attempted with free/total ratio and TZAD (22) with PSA in the range of 2.5-4ng/mL. However, this has great limitations with small glands. The relation of the whole volume to PSAD and TZAD was proposed (23) and improves specificity and can limit unnecessary biopsies. The role of the PSATD has been recently strengthened by sho-wing it had the most predictive power in
diag-nosing cancer (24). However, its use in predicting stage (25) reveals the confounding influence of the TZ. Regarding the PZ, it is suggested that the cancer which arises here, does so because of more cells of epithelial origin that are undergoing cell division and potential cancerous changes will be more numerous here. It appears there is a diffe-rence in the ratio of the two zones in cancer pa-tients compared to benign papa-tients. The peripheral zone is intrinsically richer in the acini that make PSA (5). The whole issue of PSA density and zo-nal densities has been dominated by the adoption of the term transition zone density which divides the entire serum PSA into the volume occupied by the inner gland (3, 26, 27). This is an incorrect use mathematically. Practically, it can contribute to diagnosis (26, 7), but ideally, the relative contri-bution of the separate zones should be accounted for. This is intuitively confusing otherwise and we end up with total densities greater than the origi-nal. The division of total serum PSA into the TZ ignores the contribution of the PZ to serum PSA. The corresponding lack of use of the TZAD highli-ghts this (28). The peripheral zone has had limited application so far, although it has proved useful in men on alpha reductase inhibitors (29).
To illustrate the problem, we compared the two approaches below for a 40cc gland with equal components of peripheral and transition zones and with a serum PSA of 4ng/mL.
Thus, WGd=0.1ng/mL/cc
Traditional method
• TZ=20cc TZD=0.2ng/mL/cc
• PZ=20cc PZD=0.2ng/mL/cc
• Total density is now 0.4ng/mL/cc
Prostatocrit method
• We have to take into account for the relative contributions of each zone
• The TD is 0.1 x 20/40=0.05ng/mL/cc
• The PD is 0.1 x 20/40=0.05ng/mL/cc total=0.1ng/mL/cc
We now have a density attributable to the zonal volume. This can be refined estimating the bulk of epithelium/acini within each zone.
We are aware of packed cell volume in ha-ematology. The acini are equivalent to red cells,
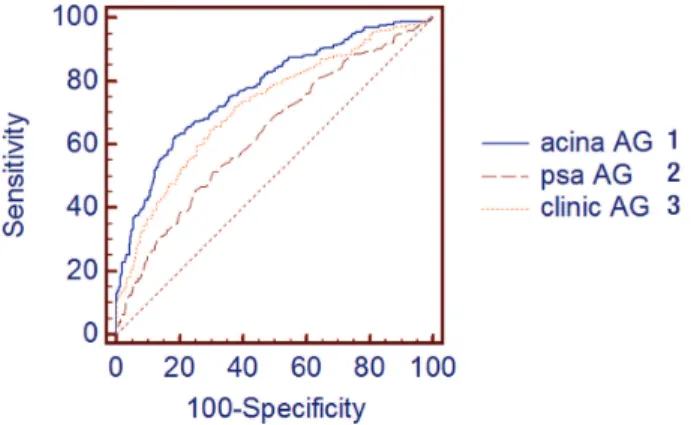
Figure 3 - ROC for all grades (AG) of cancer. Comparing acinar ratio (Prostatocrit) model with clinic model and PSA alone
1 - Acinar prostatocrit model AUC 0.7742; 2 - PSA AUC 0.636 P = 0.0001; 3 - Clinic model (PSAD) AUC 0.745 P = 0.01053
Figure 4 - ROC for high grade cancer. Comparing prostatocrit model with clinic model and PSA alone.
the stroma is equivalent to plasma and the PSA is equivalent to haemoglobin.
The gland is composed, overall, of 50-70% acini. Having accounted for different zonal volu-mes, we now need to account for the asymmetry of distribution of acini (Figures 1 and 2).
The peripheral zone is denser in acini by definition. Let us assume it is 80% acini. The tran-sition zone must be less dense. For demonstration purposes, we choose 60% acini. The peripheral zone does not vary in its composition unlike the transition zone.
• For our 40cc gland with equal 20cc zones
• TZ=20cc x 0.6=12cc acinar volume
• PZ=20cc x 0.8=16cc acinar volume
• =28cc total acinar volume This is the amount of epithelial tissue wi-thin the whole gland.
The density is derived by dividing the se-rum PSA into the relevant amount of acini.
• WGad=4/28=0.14ng/mL/cc of acini
• TZad=0.14 x 12/28=0.06ng/mL/cc
• PZad=0.14 x 16/28=0.08ng/mL/cc
Given that we can estimate the volume of acini within each zone, we can then by simple subtraction, estimate the amount of stroma, that is 1-acina %.
• TZsv=20-12=8cc
• PZsv=20-16=4cc
• 8+4=12cc stroma
• 12cc stroma + 28cc acini=40cc whole gland.
Using the model
Univariate logistic regression for predic-tion of all grades of prostate cancer were used to test significant predictors in a multivariate logis-tic regression. There were four significant zonal predictors. All involved the peripheral zone. The log of the peripheral zone acinar density, the ratio of the peripheral zone acina volume to the whole gland acinar volume, the peripheral zone acinal density to the whole gland volume and the peri-pheral zone acinar density. None of the
conven-tional zone densities, whole gland, transition or peripheral zone densities were included.
We compared ROC for this model with a “clinic” model using the same information: PSA, age, family history, previous negative biopsy, rectal examination and overall gland volume (Table-2 and Figure-3). We also compared PSA on its own. There was a significant improvement in the area under the curve from PSA alone, to the conventional clinic model, to the prostatocrit model using ratio and aci-nar density of the PZ in four different combinations, all significant and all superior to traditional density measurements.
Most importantly, of practical clinical signi-ficance, it differentiated high grade (Gleason 7 and above) cancers better than traditional parameters. The only significant predictor was the peripheral zone acina density. None of the traditional densi-ties were significant (whole gland, transition and peripheral zone densities) (Table-2 and Figure-4). The influence of the peripheral zone acinar densi-ty is further illustrated in Table-3, which shows the increasing positive predictive value as this density increases and the converse, the decreasing negative predictive value.
Limitations
TRUS is probably less accurate than MRI for measuring these volumes. These models will be improved with MRI and manual contouring of zo-nes. We plan to do this in our next study. We also appreciate that other markers such as PCA3 and 4K could be included. The correlation of predicted aci-na density and fiaci-nal actual histological density will potentially strengthen this model.
Assumption of equal production of PSA in all types of acini in both periphery and transition zone. The formula is complex and will be part of a calculator, but this should not concern the physician.
Strengths
CONCLUSIONS
When comparing the benign and malig-nant gland, the differences in ratio, with their acinal asymmetry, concentrated in the peripheral zone, enable the prostatocrit model to discrimina-te betdiscrimina-ter between the two and hence who should have biopsies.
The absolute relation between zones, their acinal bulk and PSA production remains to be determined and may prove impractical, but this recognition of acinar contribution, may improve modelling of benign and cancerous disease, the response to drugs and need for surgery.
Take home message
PSA, density, zones, acinal asymmetry provides a new dimension to the analysis of the prostate gland. This prostatocrit model better predicts high grade cancer, all grades of cancer and it will help describe natural benign growth of the separate zones.
CONFLICT OF INTEREST
None declared.
REFERENCES
1. Stamey TA, Yang N, Hay AR, McNeal JE, Freiha FS, Redwine E. Prostate-specific antigen as a serum marker for adenocarcinoma of the prostate. N Engl J Med. 1987;317:909-16.
2. Benson MC, Whang IS, Olsson CA, McMahon DJ, Cooner WH. The use of prostate specific antigen density to enhance the predictive value of intermediate levels of serum prostate specific antigen. J Urol. 1992;147:817-21.
3. Kalish J, Cooner WH, Graham SD Jr. Serum PSA adjusted for volume of transition zone (PSAT) is more accurate than PSA adjusted for total gland volume (PSAD) in detecting adenocarcinoma of the prostate. Urology. 1994;43:601-6. 4. Hammerer PG, McNeal JE, Stamey TA. Correlation between
serum prostate specific antigen levels and the volume of the individual glandular zones of the human prostate. J Urol. 1995;153:111-4.
5. Marks LS, Treiger B, Dorey FJ, Fu YS, deKernion JB. Morphometry of the prostate: I. Distribution of tissue components in hyperplastic glands. Urology. 1994;44:486-92.
6. McNeal JE. Origin and evolution of benign prostatic enlargement. Invest Urol. 1978;15:340-5.
7. Lepor H, Wang B, Shapiro E. Relationship between prostatic epithelial volume and serum prostate-specific antigen levels. Urology. 1994;44:199-205.
8. Bartsch G, Müller HR, Oberholzer M, Rohr HP. Light microscopic stereological analysis of the normal human prostate and of benign prostatic hyperplasia. J Urol. 1979;122:487-91.
9. Shapiro E, Becich MJ, Hartanto V, Lepor H. The relative proportion of stromal and epithelial hyperplasia is related to the development of symptomatic benign prostate hyperplasia. J Urol. 1992;147:1293-7.
10. Peterson RO, Sesterhenn IA, Davis CJ. Urologic Pathology.; 2009.
11. Berry SJ, Coffey DS, Walsh PC, Ewing LL. The development of human benign prostatic hyperplasia with age. J Urol. 1984;132:474-9.
12. Shapiro E, Hartanto V, Lepor H. Quantifying the smooth muscle content of the prostate using double-immunoenzymatic staining and color assisted image analysis. J Urol. 1992;147:1167-70.
13. Shapiro E, Hartanto V, Lepor H. Anti-desmin vs. anti-actin for quantifying the area density of prostate smooth muscle. Prostate. 1992;20:259-67.
14. Weber JP, Oesterling JE, Peters CA, Partin AW, Chan DW, Walsh PC. The influence of reversible androgen deprivation on serum prostate-specific antigen levels in men with benign prostatic hyperplasia. J Urol. 1989;141:987-92.
15. Issa. Contempory Diagnosis and Management of Diseases of the Prostate Anatomy of the Genitourinary System. 3rd ed. (Newtown PA Handbooks in healthcare co, ed.).; 2005.
16. Lee C, Kozlowski JM, Grayhack JT. Etiology of benign prostatic hyperplasia. Urol Clin North Am. 1995;22:237-46. 17. Lee C, Kozlowski JM, Grayhack JT. Intrinsic and extrinsic
factors controlling benign prostatic growth. Prostate. 1997;31:131-8.
18. Ford TF, Butcher DN, Masters JR, Parkinson MC. Immunocytochemical localisation of prostate-specific antigen: specificity and application to clinical practice. Br J Urol. 1985;57:50-5.
19. Zlotta AR, Schulman CC. [Use of transrectal ultrasonography in prostate pathology: determination and clinical usefulness of the prostate transition zone]. Rev Med Brux. 1998;19:119-23. 20. Deering RE, Bigler SA, King J, Choongkittaworn M,
Aramburu E, Brawer MK. Morphometric quantitation of stroma in human benign prostatic hyperplasia. Urology. 1994;44:64-70.
22. Djavan B, Zlotta A, Kratzik C, Remzi M, Seitz C, Schulman CC, et al. PSA, PSA density, PSA density of transition zone, free/total PSA ratio, and PSA velocity for early detection of prostate cancer in men with serum PSA 2.5 to 4.0 ng/mL. Urology. 1999;54:517-22.
23. Taneja SS, Tran K, Lepor H. Volume-specific cutoffs are necessary for reproducible application of prostate-specific antigen density of the transition zone in prostate cancer detection. Urology. 2001;58:222-7.
24. Tanaka N, Fujimoto K, Chihara Y, Torimoto M, Hirao Y, Konishi N, et al. Prostatic volume and volume-adjusted prostate-specific antigen as predictive parameters for prostate cancer patients with intermediate PSA levels. Prostate Cancer Prostatic Dis. 2007;10:274-8.
25. Giannarini G, Scott CA, Moro U, Pertoldi B, Beltrami CA, Selli C. Are PSA density and PSA density of the transition zone more accurate than PSA in predicting the pathological stage of clinically localized prostate cancer? Urol Oncol. 2008;26:353-60.
26. Zlotta AR, Djavan B, Marberger M, Schulman CC. Prostate specific antigen density of the transition zone: a new effective parameter for prostate câncer prediction. J Urol. 1997;157:1315-21.
27. Djavan B, Zlotta AR, Byttebier G, Shariat S, Omar M, Schulman CC, et al. Prostate specific antigen density of the transition zone for early detection of prostate cancer. J Urol. 1998;160:411-8.
28. Lin DW, Gold MH, Ransom S, Ellis WJ, Brawer MK. Transition zone prostate specific antigen density: lack of use in prediction of prostatic carcinoma. J Urol. 1998;160:77-81-2.
29. Koo KC, Lee DH, Lee SH, Chung BH. Peripheral zone prostate-specific antigen density: an effective parameter for prostate cancer prediction in men receiving 5α-reductase inhibitors. Prostate Int. 2013;1:102-8.
_______________________ Correspondence address: