Tympanometry in Infants: A Study of
the Sensitivity and Speci
fi
city of 226-Hz
and 1,000-Hz Probe Tones
Michele Picanço Carmo
1Nayara Thais de Oliveira Costa
1Teresa Maria Momensohn-Santos
21PhD student in Speech-Language Pathology and Audiology, Pontifical
Catholic University of São Paulo (PUCSP), São Paulo/SP, Brazil
2Full Professor of the Department of Clinical Speech Therapy,
Pontifical Catholic University of São Paulo (PUCSP), São Paulo/SP, Brazil
Int Arch Otorhinolaryngol 2013;17:395–402.
Address for correspondence Michele Picanço Carmo, Av. Diógenes Ribeiro de Lima, 2000/8,6, Alto de Pinheiros, São Paulo/SP, CEP 05458-001, Brasil (e-mail: [email protected]).
Introduction
Tympanometry is effective in the early identification of changes in the external ear (EE) and middle ear (ME), and its use is well established for children and adults. However, its use for newborns and infants is still controversial. The litera-ture recommends 1,000-Hz tympanometry for infants under 6 months, which has a greater sensitivity for the correct identification of ME dysfunction in this population.1,2
Literature Review
ME alterations have a high incidence in children. The presence of otitis media with effusion, cerumen, vernix, or other causes of conductive hearing loss contribute to a large number of
false-positive results in neonatal hearing screening and may also delay the completion of diagnostic audiology. Therefore, it is important to identify hearing screening failures caused by transient changes in the ME and EE through an instrument that allows quick, accurate, and noninvasive assessment.1,2
One of the assessment tools used in routine audiology of the ME is the measurement ofacoustic impedance, which is a general term related to the transfer of acoustic energy, either by facilitation (admittance) of or opposition (impedance) to the passage of sound energy. This is influenced by the amount of sound energy that is absorbed and reflected by the tympanic membrane (TM). When it is more compliant, the TM absorbs more energy and therefore allows greater
Keywords
►
speech language and
hearing sciences
►
hearing
►
acoustic impedance
tests
►
otitis media with
effusion
►
spontaneous
otoacoustic emissions
Abstract
Introduction
For infants under 6 months, the literature recommends 1,000-Hz
tympanometry, which has a greater sensitivity for the correct identi
fi
cation of middle
ear disorders in this population.
Objective
To systematically analyze national and international publications found in
electronic databases that used tympanometry with 226-Hz and 1,000-Hz probe tones.
Data Synthesis
Initially, we identi
fi
ed 36 articles in the SciELO database, 11 in the Latin
American and Caribbean Literature on the Health Sciences (LILACS) database, 199 in
MEDLINE, 0 in the Cochrane database, 16 in ISI Web of Knowledge, and 185 in the
Scopus database. We excluded 433 articles because they did not
fi
t the selection
criteria, leaving 14 publications that were analyzed in their entirety.
Conclusions
The 1,000-Hz tone test has greater sensitivity and speci
fi
city for the
correct identi
fi
cation of tympanometric curve changes. However, it is necessary to
clarify the doubts that still exist regarding the use of this test frequency. Improved
methods for rating curves, standardization of normality criteria, and the types of curves
found in infants should be addressed.
received
November 20, 2012 accepted
February 12, 2013
Copyright © 2013 by Thieme Publicações Ltda, Rio de Janeiro, Brazil
admittance of the system. On the other hand, the more rigid the TM, the more energy will be reflected, creating greater system impedance.3,4
Tympanometry is a measure of the variation of the acous-tic impedance of the tympanic ossicular system caused by pressure variations introduced into the external auditory canal and indicates the condition of the ME and auditory pathways.4In audiology, the most commonly used probe tone has a low frequency of 226 Hz; however, more modern equipment includes additional probe tones such as 660, 678, and 1,000 Hz.
Tympanometry is a common practice in children and adults, and its specifications are very well established. However, there are many uncertainties regarding the specificity and sensitivi-ty of the probe tones used in the evaluation of neonates and infants. The literature has shown that in neonates and infants, tympanograms obtained with a low-frequency probe tone can be recorded as normal, even in the presence of altered ME function.2–6 High-frequency probe tones, in particular
1,000 Hz, have a higher sensitivity for the identification of ME changes and therefore should be used in neonates and infants under 6 or 7 months of age if possible.2,4–8
The objectives of this study were to systematically analyze national and international scientific publications on the application of tympanometry in infants using 226-Hz and 1,000-Hz test tones and to compare sensitivity and specificity between these two test tones.
To investigate the number of publications on this topic, two researchers independently conducted a bibliographic survey in the SciELO, Latin American and Caribbean Literature on the Health Sciences (LILACS), MEDLINE, Cochrane, Scopus, and ISI Web of Knowledge electronic databases. For the search strategy, the Descriptors in Health Sciences (MeSH, created by the National Library of Medicine) termacoustic impedance tests was combined with the words neonate and infant. National and international articles published in the past 10 years were examined, delimiting the period between January 2001 and December 2011.
The inclusion criteria for the full analysis of texts were as follows: original article or case report; infants up to 7 months old as the research subjects; use of 1,000-Hz probe tone as tone test during tympanometry; description of tympanometric curves obtained; and published in Portuguese, English, or Spanish.
The articles that met the inclusion criteria were selected for review in full, analyzed, and organized in a database with the following parameters: author(s), title, source, year, re-search type, sample characteristics, test tones used, main
findings, and classification of tympanometric curves.
Discussion
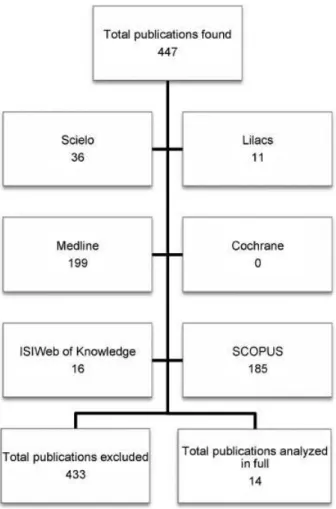
Initially, 447 articles were identified. Thirty-six articles were found in the SciELO database, 11 in the LILACS database, 199 in MEDLINE, 0 in the Cochrane database, 16 in ISI Web of Knowledge, and 185 in the Scopus database. We excluded 433 publications because they did notfit the selection criteria, leaving 14 publications that were analyzed in their entirety.
The route taken for selection and analysis of text is shown in►Fig. 1.
The 14 selected publications were analyzed considering the source and year of publication. It was found that in the 10-year period investigated (2001 to 2011), the number of studies performed on tympanometry with high-frequency probe tones was not significant, but the number of publica-tions increased from the year 2006 (►Table 1).
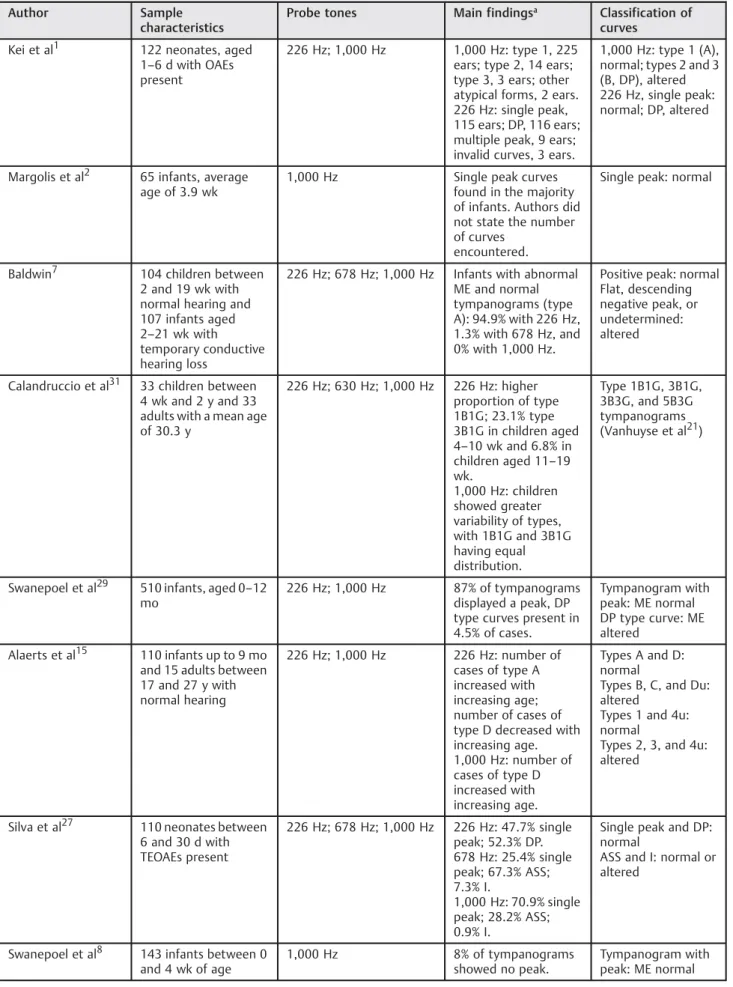
A thorough analysis of the publications was performed considering the characteristics of the sample, the test tone frequencies used in tympanometry, the mainfindings iden-tified, and the classification of tympanometric curves (►Table 2). This information is presented and discussed hereafter, with the assistance of other theoretical publica-tions considered relevant for the purpose of better under-standing the topic in question.
Test Frequency and Age
In neonates and infants, growth entails changes in the ear that generate mechanical alterations, which can influence tym-panogram recordings. These changes include increased EE, mastoid, and ME cavity; mass reduction of the ME due to changes in bone density; and bone formation in the wall of the external auditory canal.4In addition, the resonance of the ME is modified according to age; the resonance frequency of the ME is lower in babies when compared with the values of
an adult.9Sagging of the ear canal can also cause movement of the wall of the ear canal.10,11
In the literature, there are notable divergences in the age at which the high-frequency probe test is recommended. There are indications for its use in children under 7 months of age,2,4–8less than 6 months old,12,13less than 4 months old,14
and under 5 months of age.7Other authors claim that for use of 1,000-Hz test tones in infants up to 3 months old and between 3 and 9 months of age, ME evaluation must be performed in two stages. Initially, the 1,000-Hz test tone should be used and in cases of failure with this tone, testing should then be performed with a 226-Hz probe tone. The use of a low test frequency of 226 Hz has also been indicated for the assessment of infants over 9 months.15
Classification of Tympanometric Curves
According to the literature, tympanometric curves are usually classified as follows: type A (normal curve having a single peak of admittance between 150 and 100 daPa and a volume
of 0.2 to 1.8 mL);flat or type B (flat curve with no admittance peak); type C (admittance peak shifted to negative pres-sures); As (curve with low admittance); Ad (interval between the two branches of the curve equal to or greater than 100 daPa)16; DP (double peak curve)17; ASS (asymmetrical curve with peak at high positive pressure); and I (inverted curve with an inverted configuration compared with the normal curve).18However, there are also other less common types of tympanometric curves.19–21
Among the studies analyzed in the current review, it was observed that there was a consensus that the type A curve indicated a normal ME,1,15,17–19and B, C, As, and Ad curves
implied an altered ME.15,22–25
Regarding the DP curve, also called a type D curve, five studies showed that this curve indicates normality of the ME in the case of neonates.15,22–24,26According to one author,3
this type of tympanogram is most often identified in the neonate population when tympanometry testing is per-formed with a 226-Hz probe tone. This is because such Table 1 List of studies on tympanometry with high- and low-frequency probe tones from 2001 to 2011
Author Title Source Year
Kei et al1 High-frequency (1,000 Hz) tympanometry in normal neonates
J Am Acad Audiol 2003
Margolis et al2 Tympanometry in newborn infants, 1-kHz norms J Am Acad Audiol 2003 Baldwin7 Choice of probe tone and classification of trace
patterns in tympanometry undertaken in early infancy
Int J Audiol 2006
Calandruccio et al31 Normative multifrequency tympanometry in infants and toddlers
J Am Acad Audiol 2006
Swanepoel et al29 Infant hearing screening at immunization clinics in South Africa
Int J Pediatr Otorhinolaryngol 2006
Alaerts et al15 Evaluation of middle ear function in young children: clinical guidelines for the use of 226- and 1,000-Hz tympanometry
Otol Neurotol 2007
Silva et al27 Tympanometry in neonates with normal otoacoustic emissions: measurements and interpretation
Rev Bras Otorrinolaringol 2007
Swanepoel et al8 High-frequency immittance for neonates: a normative study
Acta Otolaryngol 2007
Shahnaz et al6 Multifrequency tympanometry in neonatal intensive care unit and well babies
J Am Acad Audiol 2008
Garcia et al22 Acoustic immittance measures in infants with 226- and 1,000-Hz probes: correlation with otoacoustic emissions and otoscopy examination
Rev Bras Otorrinolaringol (Engl Ed) 2009
Zhiqi et al25 Tympanometry in infants with middle ear effusion having been identified using spiral computerized tomography
Am J Otolaryngology 2010
Camboim et al23 Comparative analysis of otoacoustic emissions with tympanometry in 0- to 6-mo infants
Revista CEFAC 2012
Tazinazzio et al24 Otoacoustic emissions and acoustic immittance measurements using 226-Hz and 1,000-Hz probe tones in neonates
Revista CEFAC 2011
Lewis et al30 A comparison of tympanometry with 226-Hz and 1,000-Hz probe tones in children with Down syndrome
Table 2 Main characteristics of studies with test tones of 226- and 1,000-Hz
Author Sample characteristics
Probe tones Main findingsa
Classification of curves
Kei et al1 122 neonates, aged 1–6 d with OAEs
present
226 Hz; 1,000 Hz 1,000 Hz: type 1, 225 ears; type 2, 14 ears; type 3, 3 ears; other atypical forms, 2 ears. 226 Hz: single peak, 115 ears; DP, 116 ears; multiple peak, 9 ears; invalid curves, 3 ears.
1,000 Hz: type 1 (A), normal; types 2 and 3 (B, DP), altered 226 Hz, single peak: normal; DP, altered
Margolis et al2 65 infants, average age of 3.9 wk
1,000 Hz Single peak curves found in the majority of infants. Authors did not state the number of curves
encountered.
Single peak: normal
Baldwin7 104 children between 2 and 19 wk with normal hearing and 107 infants aged 2–21 wk with
temporary conductive hearing loss
226 Hz; 678 Hz; 1,000 Hz Infants with abnormal ME and normal tympanograms (type A): 94.9% with 226 Hz, 1.3% with 678 Hz, and 0% with 1,000 Hz.
Positive peak: normal Flat, descending negative peak, or undetermined: altered
Calandruccio et al31 33 children between 4 wk and 2 y and 33 adults with a mean age of 30.3 y
226 Hz; 630 Hz; 1,000 Hz 226 Hz: higher proportion of type 1B1G; 23.1% type 3B1G in children aged 4–10 wk and 6.8% in
children aged 11–19
wk.
1,000 Hz: children showed greater variability of types, with 1B1G and 3B1G having equal distribution.
Type 1B1G, 3B1G, 3B3G, and 5B3G tympanograms (Vanhuyse et al21)
Swanepoel et al29 510 infants, aged 0–12
mo
226 Hz; 1,000 Hz 87% of tympanograms displayed a peak, DP type curves present in 4.5% of cases.
Tympanogram with peak: ME normal DP type curve: ME altered
Alaerts et al15 110 infants up to 9 mo and 15 adults between 17 and 27 y with normal hearing
226 Hz; 1,000 Hz 226 Hz: number of cases of type A increased with increasing age; number of cases of type D decreased with increasing age. 1,000 Hz: number of cases of type D increased with increasing age.
Types A and D: normal
Types B, C, and Du: altered
Types 1 and 4u: normal
Types 2, 3, and 4u: altered
Silva et al27 110 neonates between 6 and 30 d with TEOAEs present
226 Hz; 678 Hz; 1,000 Hz 226 Hz: 47.7% single peak; 52.3% DP. 678 Hz: 25.4% single peak; 67.3% ASS; 7.3% I.
1,000 Hz: 70.9% single peak; 28.2% ASS; 0.9% I.
Single peak and DP: normal
ASS and I: normal or altered
Swanepoel et al8 143 infants between 0 and 4 wk of age
1,000 Hz 8% of tympanograms showed no peak.
Table 2 (Continued)
Author Sample characteristics
Probe tones Main findingsa
Classification of curves
6% were DP-type curves.
57% sensibility. 95% specificity.
DP-type curve: ME altered
Shahnaz et al6 33 neonates from ICU and 16 healthy infants between 21 and 28 d; 42 infants between 6 d and 23 wk and 33 preterm neonates between 32 and 51 wk with BAEPs present compared with 16 adults between 18 and 32 y with normal hearing
226 Hz; 1,000 Hz Newborns and infants showed a great variability of complex tympanometric patterns with 226 Hz. With increasing test frequency, the ratio of single peak curves increased and with 1,000 Hz the rate was 64%.
Model: Vanhuyse et al21
226 Hz: 13% 1B1G and 85% complex multiple peak tympanograms 1,000 Hz:
predominantly 3B1G (50%) and 1B1G (38%)
Garcia et al22 60 infants between 0 and 4 mo in the absence and presence of OAEs
226 Hz; 1,000 Hz OAEs present: 226 Hz: 61% A; 27% D; 8.3% B; 3.7% C. 1,000 Hz: 60% A; 11.6% D; 13.4% I; 5% B; 10% C.
OAEs absent: 226 Hz: 53.3% A; 31.7% D; 13.3% B; 1.7% C.
1,000 Hz: 20% A; 2% D; 0% I; 70% B; 8% C.
Types A, D, and I: normal
Types B and C: altered
Type ASS: normal or altered
Zhiqi et al25 52 infants between 42 d and 6 mo
226 Hz; 1,000 Hz 226 Hz:
Group with normal ME: 51.06% single peak; 44.68% DP; 2.13%flat; 2.13% with negative pressure.
Group with ME effusion: 77.19% single peak; 19.30% DP; 3.51%flat. 1,000 Hz:
Group with normal ME: 97.87% single peak. Group with ME effusion: 98.25%flat.
Single peak: normal tympanogram Flat: altered (ME effusion)
Tazinazzio et al24 52 infants between 11 and 51 d with OAEs present and absent; at 1,000 Hz, the number of ears was less because blocked curves were excluded (occurrence of the occlusion effect)
226 Hz; 1,000 Hz OAEs present and normal curves: 226 Hz, 82 ears; 1,000 Hz, 66 ears. OAEs present and altered curves: 226 Hz, 0 ears; 1,000 Hz, 6 ears. OAEs absent and normal curves: 226 Hz, 19 ears; 1,000 Hz, 8 ears. OAEs absent and altered curves: 226 Hz, 3 ears; 1,000 Hz, 13 ears.
Types A and D: normal
Types As, B, andflat: altered
registration occurs when measurement is performed at the resonant frequency of the ME and in the case of this popula-tion, this frequency is shifted to lower values.
Regarding the I and ASS curves, it was found that there are disagreements with regards to their normal standards and which parameters should be used for classification of a normal or altered curve. The ASS curve and the I curve can be identified in subjects with and without alteration of the ME and can be regarded as normal or altered.22,27 One publication stated that the I curve should be classified as normal in infants.22
Besides the ambiguity that exists in the classification of curves with a 1,000-Hz probe tone, another issue regarding high-frequency tympanometry in neonates is the high num-ber of unclassified or indeterminate curves obtained by the use of classification systems designated for the low-frequency tone test in adults and older children.7This has created more doubt and questions regarding curve classification and the parameters that define categorization as normal or abnormal. In a study using 1,000-Hz testing, the authors classified curves as follows: type 1 (similar to type A), type 2 (similar to type B), type 3 (similar to DP), and atypical forms. With a 226-Hz tone test, in addition to using the classification of DP, the authors also used the nomenclature single-peak tympa-nogram, multiple-peak tympatympa-nogram, and invalid tympano-gram. From this perspective, the authors concluded that there is no direct correspondence between ME condition and tympanometry curve type. However, the type 1 curve, which was obtained in 92.3% of neonates, indicated an ME without alterations.1
It has been hypothesized that changes in the patterns of tympanometry may also vary according to the age of the individuals assessed. In one study using a 226-Hz probe tone, the percentage of type A curves increased with increasing age,
and the percentage of DP curves decreased.15Furthermore, the use of the 1,000-Hz tone decreased the prevalence offlat tympanograms and increased DP curves in a group of chil-dren. However, it should be mentioned that the sample surveyed included no children with ME alterations.
Changes in the quantitative values of tympanometry can be justified by the rapid anatomical growth of the ear in neonates during thefirst 6 weeks of life.28An increase in resonance frequency occurs in the ear of neonates, and this shifts the type of tympanometric curve from DP to single peak. This alteration can be explained by anatomical evidence showing that the physical structure of the ear changes from a state allowing positive reactance (dominated by mass) to one allowing negative reactance (dominated by stiffness). When the ME reaches negative reactance, the low-frequency tone test becomes an appropriate tool to evaluate the peripheral auditory system. That is, with the evaluation of ear reactance, it is possible to identify the resonance frequency, and if this is low, the use of a high-frequency tone is sufficiently sensitive. However, if this frequency approaches the frequency of the adult, the conventional 226-Hz tone should be used. Such changes in resonance frequency may be due to intrasubject variability or true evolution of ME function with age.26
Relationship between Tympanometry and Other Audiological Evaluations
Other procedures used to identify hearing loss in infants include measurement of otoacoustic emissions (OAEs) and brainstem auditory evoked potentials. It is possible to corre-late the results of these procedures and tympanometry traces to better assess hearing condition.
The literature indicates that the 1,000-Hz probe tone has a higher correlation with the responses of transient otoacoustic emissions (TOAEs) and distortion product otoacoustic Table 2 (Continued)
Author Sample characteristics
Probe tones Main findingsa
Classification of curves
Lewis et al30 26 children with Down syndrome between 6 and 18 mo
226 Hz; 1,000 Hz 226 Hz: ME nofluid: type B, 7 ears; type A, 17 ears.
ME withfluid: type A, 0 ears; type B, 2 ears. 1,000 Hz:
ME nofluid: type A, 24 ears; type B, 0 ears. ME withfluid: type B, 2 ears; type A, 0 ears.
Type A: normal Type B: altered
Camboim et al23 118 infants between 0 and 6 mo with OAEs present and absent
226 Hz; 1,000 Hz 1,000 Hz: high correlation between normal curves (type A and DP) and presence of OAEs, as well as altered curves (not type A or DP) and absence of OAEs.
Types A and DP: normal
Types C, Ad, As, and B: altered
Abbreviations: BAEPs, brainstem auditory evoked potentials; ICU, intensive care unit; ME, middle ear; OAEs, evoked otoacoustic emissions; TEOAEs, transient evoked otoacoustic emissions.
emissions.23,24,29The 1,000-Hz tone displays this correlation in both the evaluation of normal ears and ears with ME alterations. Tympanometry with a 226-Hz tone provides results consistent with assessment of OAEs in the presence of a normal ME only.23
For infants with TOAEs present, both probe tones have good specificity but, for infants with TOAEs absent, the 1,000-Hz tone is more sensitive for the identification of possible alterations in the ME.22From this perspective, the use of tympanometry with a 1,000-Hz tone in infants is the most appropriate procedure for detecting changes in the ME, especially when TOAEs are absent.24
On the other hand, different tympanometry curve types can be identified even in the presence of different OAE recordings. The reason for the detection of heterogeneous curves even with the presence of OAEs, which suggest normal ME function, is unclear. It may be due to the fact that light dysfunction of the ME is not able to prevent OAE recording or may even be caused by inadequate sealing of the probe, resulting in movement-generated artifacts.1
The relationship between responses to 226- and 1,000-Hz probe tones and OAE recordings was also analyzed in a study of children with Down syndrome, showing a strong correla-tion between 1,000-Hz tympanometry and OAE results.30
Test Frequency Most Suitable for Evaluation of Infants
Despite the fact that it has been used for decades, the 226-Hz tone test is not the most appropriate for assessing infants,1,2,5–8,22–24,27mainly because, as already mentioned,
this population has maturational characteristics that are distinct from children older than 6 months of age and adults. Among the sources analyzed, were identified three studies that used testing tones of 678 and 630 Hz in addition to 226 and 1,000 Hz. In all three studies, the authors observed that the 1,000-Hz tone test showed better results for the charac-terization of tympanograms when compared with other frequencies.7,27,31
Studies have shown that the efficacy of the 1,000-Hz tone in relation to the 226-Hz and 678-Hz probe tones is justified by the fact that mass components are larger at high-frequency probe tones and lower at low-frequency probe tones, which modifies the resonance characteristics of the ME.1,2Changes in the wall of the external auditory canal, ME mobility, and tympanometric characteristics are observed in thefirst months of life. This is because the ME of children is dominated by the component of mass, and the resonance frequency tends to be lower when compared with normal adults, in whom the system is controlled by stiffness.14 A Brazilian study investigating resonance frequency reported a value of 250 Hz in children between 2 and 12 days and a value of 385 Hz in children between 72 and 84 days.32
Conclusion
After the analysis of several publications, it was found that both the test tones of 226 and 1,000 Hz show false-positive results (indicating the presence of alterations in the ME when
they do not exist) and false-negative results (when changes are not detected even in their presence). However, both false-positives and false-negatives are less frequent with the 1,000-Hz probe tone. For this reason, the test frequency of 1,000 Hz is more sensitive and specific than the frequency of 226 Hz for the assessment of ME alterations in neonates. Therefore, it is concluded that this probe tone is most appropriate for evaluating infants less than 6 months of age. Although the literature confirms that the 1,000-Hz tone test is the most appropriate for assessment in this population, further studies are needed to clarify the doubts that still exist regarding the use of tympanometry with a high-frequency tone. In addition, better systems for the classification of curves and normality criteria should be investigated.
References
1 Kei J, Allison-Levick J, Dockray J, et al. High-frequency (1000 Hz) tympanometry in normal neonates. J Am Acad Audiol 2003; 14(1):20–28
2 Margolis RH, Bass-Ringdahl S, Hanks WD, Holte L, Zapala DA. Tympanometry in newborn infants—1 kHz norms. J Am Acad
Audiol 2003;14(7):383–392
3 Carvallo RM. Medidas eletroacústicas imitância acústica. In: Carvallo RM, ed. Fonoaudiologia Informação para a Formação. Procedimentos em Audiologia. Rio de Janeiro, Brazil: Guanabara Koogan; 2003:1–22
4 Margolis RH, Hunter LL. Timpanometria: princípios básicos e aplicações clínicas. In: Musiek FR, Rintelman WF eds. Perspectivas Atuais em Avaliação Auditiva. São Paulo, Brazil: Manole; 2001: 85–126
5 Sininger YS. Audiologic assessment in infants. Curr Opin Otolar-yngol Head Neck Surg 2003;11(5):378–382
6 Shahnaz N, Miranda T, Polka L. Multifrequency tympanometry in neonatal intensive care unit and well babies. J Am Acad Audiol 2008;19(5):392–418
7 Baldwin M. Choice of probe tone and classification of trace patterns in tympanometry undertaken in early infancy. Int J Audiol 2006;45(7):417–427
8 Swanepoel W, Werner S, Hugo R, Louw B, Owen R, Swanepoel A. High frequency immittance for neonates: a normative study. Acta Otolaryngol 2007;127(1):49–56
9 Weatherby LA, Bennett MJ. The neonatal acoustic reflex. Scand Audiol 1980;9(2):103–110
10 Keefe DH, Bulen JC, Arehart KH, Burns EM. Ear-canal impedance and reflection coefficient in human infants and adults. J Acoust Soc Am 1993;94(5):2617–2638
11 Gravel JS, Hood LJ. Avaliação audiológica infantil. In: Musiek FE, Rintelmann WF, eds. Perspectivas Atuais em Avaliação Auditiva. São Paulo, Brazil: Manole; 2001:301–322
12 Joint Committee on Infant Hearing. Year 2007 Position Statement: Principles and Guidelines for Early Hearing Detection and Inter-vention Programs. Pediatrics 2007;120(4):898–921
13 Newborn Hearing Screening and Assessment. Tympanometry in babies under 6 months. A Recommended Test Protocol [cited November 20, 2012]. Available at: http://hearing.screening.nhs. uk/audiologyprotocols#fileid10753
14 Holte L, Margolis RH, Cavanaugh RM Jr. Developmental changes in multifrequency tympanograms. Audiology 1991;30(1):1–24
15 Alaerts J, Luts H, Wouters J. Evaluation of middle ear function in young children: clinical guidelines for the use of 226- and 1,000-Hz tympanometry. Otol Neurotol 2007;28(6):727–732
17 Lidén G. The scope and application of current audiometric tests. J Laryngol Otol 1969;83(6):507–520
18 Margolis RH, Smith P. Tympanometry in infants: state of art. In: Harford E, Klein J eds. Impedance Screening of Middle Ear Disease in Children. New York, NY: Grune and Stratton; 1978
19 Sutton G, Baldwin M, Brooks D, Gravel J, Thornton R. Tympanom-etry in neonates and infants under 4 months: a recommended test protocol. Manchester, England 2002 [cited November 20, 2012]. Available at: http://hearing.screening.nhs.uk/
20 Marchant CD, McMillan PM, Shurin PA, et al. Objective diagnosis of otitis media in early infancy by tympanometry and ipsilateral acoustic reflex thresholds. J Pediatr 1986;109:590–595
21 Vanhuyse VJ, Creten WL, Van Camp KJ. On the W-notching of tympanograms. Scand Audiol 1975;4(1):45–50
22 Garcia MV, Azevedo MF, Testa JR. Accoustic immitance measures in infants with 226 and 1000 hz probes: correlation with otoacoustic emissions and otoscopy examination. Braz J Otorhinolaryngol 2009;75(1):80–89
23 Camboim ED, Correia AMN, Vasconcelos D, Torres R, Scharlach RC, Azevedo MF. Comparative analysis of otoacoustic emissions with tympanometry in 0-6 month infants. Rev CEFAC-Speech, Lan-guage, Hearing Sciences and Education Journal [online] 2012; 14(3):403-412 [cited November 20, 2012]. Available at: http:// www.scielo.br/scielo.php?script=sci_arttext&pid=S1516-184620 12000300004&lng=en&nrm=iso
24 Tazinazzio TG, Diniz TA, Marba STM, Colella-Santos MF. Otoacous-tic emissions and acousOtoacous-tic immitance measurements using 226 Hz and 1000 Hz probe tones in neonates. Rev CEFAC-Speech,
Lan-guage, Hearing Sciences and Education Journal [online] 2011; 13 (3):479-488 [cited November 20, 2012]. Available at: http://www. scielo.br/scielo.php?script¼sci_arttext&pid¼
S1516-18462011000300011&lng¼pt&nrm¼iso
25 Zhiqi L, Kun Y, Zhiwu H. Tympanometry in infants with middle ear effusion having been identified using spiral computerized tomog-raphy. Am J Otolaryngol 2010;31(2):96–103
26 Meyer SE, Jardine CA, Deverson W. Developmental changes in tympanometry: a case study. Br J Audiol 1997;31(3):189–195
27 Silva KA, Novaes BA, Lewis DR, Carvallo RM. Tympanometry in neonates with normal otoacoustic emissions: measurements and interpretation. Braz J Otorhinolaryngol 2007;73(5):633–639
28 Mazlan R, Kei J, Hickson L, et al. High frequency immittance
findings: newborn versus six-week-old infants. Int J Audiol 2007;46:711–717
29 Swanepoel W, Hugo R, Louw B. Infant hearing screening at immunization clinics in South Africa. Int J Pediatr Otorhinolar-yngol 2006;70(7):1241–1249
30 Lewis MP, Bradford Bell E, Evans AK. A comparison of tympan-ometry with 226 Hz and 1000 Hz probe tones in children with Down syndrome. Int J Pediatr Otorhinolaryngol 2011;75(12): 1492–1495
31 Calandruccio L, Fitzgerald TS, Prieve BA. Normative multifrequen-cy tympanometry in infants and toddlers. J Am Acad Audiol 2006;17(7):470–480