ISSN 1806-3713 © 2017 Sociedade Brasileira de Pneumologia e Tisiologia
http://dx.doi.org/10.1590/S1806-37562017000000170
Subgroup analysis and interaction tests:
why they are important and how to avoid
common mistakes
Juliana Carvalho Ferreira1,2, Cecilia Maria Patino1,3
1. Methods in Epidemiologic, Clinical, and Operations Research – MECOR – program, American Thoracic Society/Asociación Latinoamericana del Tórax, Montevideo, Uruguay.
2. Divisão de Pneumologia, Instituto do Coração – InCor – Hospital das Clínicas, Faculdade de Medicina, Universidade de São Paulo, São Paulo, Brasil. 3. Department of Preventive Medicine, Keck School of Medicine, University of Southern California, Los Angeles, CA, USA.
A randomized clinical trial was conducted to compare the effect of vitamin C vs. placebo on improving pulmonary function in newborns of pregnant smokers; and to test if this effect differed by maternal genotype.(1) Vitamin C improved pulmonary function in newborns compared to placebo (TPTEF:TE ratio 0.383 vs 0.345; p = 0.006); and this effect was stronger in newborns with mothers with a speciic genotype (p-interaction < 0.001).(1)
BACKGROUND
When conducting clinical trials, investigators examine the effect of interventions on outcomes in the study population and often in subgroups of patients deined by baseline characteristics (e.g., demographics, prognostic factors). The goal is to understand if the magnitude of the effect of the intervention differs within categories of a subgroup; in our example, genotype subgroups. If the effect is different within subgroups we call this effect modiication of the intervention on the outcome due to the additional presence of the subgroup variable. We commonly conduct a test for interaction, using multivariable models, to evaluate for statistically signiicant subgroup differences. If the p value is signiicant, we conclude that the effect of the intervention on the outcome differs within subgroups, in our example, maternal genotype.
Understanding treatment effects across patient subgroups is important because it helps identify patient groups that respond better or worse to the intervention. However, subgroup analyses should be done with caution to avoid common mistakes that either lead to false negative or positive indings, especially when they are not pre-speciied in the analysis plan before starting the study. A common mistake is to compare the effect of treatment on the outcome separately within each subgroup. For example, comparing the effect of vitamin C vs. placebo on pulmonary function in newborns among mothers with one genotype and then separately among the mothers with another genotype. This approach is incorrect because it leads to multiple testing, which means that instead of using only one calculation to test for differences in effect across subgroups (p for interaction across genotype-groups in our example), we use two or more different calculations for each subgroup analysis. Every time we add a calculation, we no longer can use the standard signiicant level of p
< 0.05. In this case, since there are two calculations we would need to divide the p value by 2 and use p < 0.025 as the signiicance level.(2) Thus, we would overestimate subgroup differences if we kept the signiicance level at 0.05. Another challenge with subgroup analysis is that results may suggest that there are subgroup differences but the p-value is not statistically signiicant because the sample size within each subgroup is too small (Figure 1).
SUBGROUP ANALYSIS TIPS
1. Identify a few subgroups that seem highly relevant to your research question a priori and justify your choices.
2. Do not compare the effects of treatment vs. control in each subgroup. There are speciic statistical tests to determine if there is an interaction between the treatment effect and the variables that deine subgroups, which are best performed with the aid of a statistician.
3. Before making changes in clinical practice, subgroup results should be replicated in other studies.
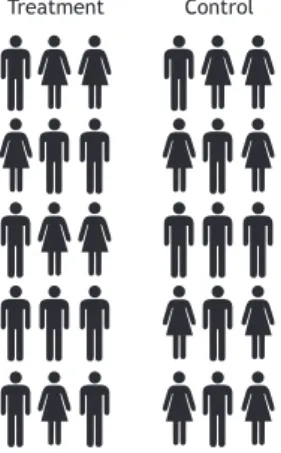
Figure 1. Consider a hypothetical randomized trial with 30 participants, 15 in the treatment group (9 men and 6 women) and 15 in the control group (7 men and 8 women). To test if the effect of treatment differs between men and women, the correct approach is to use a multivariate model including an interaction term (treatment vs. sex), but with 30 participants, such a model would probably be underpowered to detect
clinically signiicant differences. Comparing the effect of
treatment vs. control in women only (6 vs. 8 participants), then in men only (7 vs. 8 participants) would also be underpowered.
REFERENCES
1. McEvoy CT, Schilling D, Clay N, Jackson K, Go MD, Spitale P, et al. Vitamin C supplementation for pregnant smoking women and pulmonary function in their newborn infants: a randomized clinical trial. JAMA. 2014;311(20):2074-82. https://doi.org/10.1001/jama.2014.5217
2. Wang R, Lagakos SW, Ware JH, Hunter DJ, Drazen JM. Statistics in medicine--reporting of subgroup analyses in clinical trials. N Engl J Med. 2007;357(21):2189-94. https://doi.org/10.1056/NEJMsr077003
Treatment Control
J Bras Pneumol. 2017;43(3):162-162
162