Other uses, including reproduction and distribution, or selling or
licensing copies, or posting to personal, institutional or third party
websites are prohibited.
In most cases authors are permitted to post their version of the
article (e.g. in Word or Tex form) to their personal website or
institutional repository. Authors requiring further information
regarding Elsevier’s archiving and manuscript policies are
encouraged to visit:
Journal of Chromatography A,1218 (2011) 3771–3780
Contents lists available atScienceDirect
Journal of Chromatography A
j o u r n a l h o m e p a g e :w w w . e l s e v i e r . c o m / l o c a t e / c h r o m a
Profiling allergic asthma volatile metabolic patterns using a headspace-solid
phase microextraction/gas chromatography based methodology
M. Caldeira
a,b, A.S. Barros
a, M.J. Bilelo
c, A. Parada
c, J.S. Câmara
b, S.M. Rocha
a,∗aQOPNA, Departamento de Química, Universidade de Aveiro, 3810-193 Aveiro, Portugal
bCQM/UMa - Centro de Química da Madeira, Centro de Ciências Exactas e de Engenharia da Universidade da Madeira, Campus Universitário da Penteada, 9000-390 Funchal, Portugal cHospital Infante D. Pedro E.P.E, Avenida Artur Ravara, 3814-501 Aveiro, Portugal
a r t i c l e
i n f o
Article history:
Received 25 January 2011
Received in revised form 8 April 2011 Accepted 11 April 2011
Available online 16 April 2011
Keywords:
Allergic asthma Exhaled breath Volatile metabolites
Headspace solid-phase microextraction Gas chromatography–mass spectrometry
a b s t r a c t
Allergic asthma represents an important public health issue with significant growth over the years, espe-cially in the paediatric population. Exhaled breath is a non-invasive, easily performed and rapid method for obtaining samples from the lower respiratory tract. In the present manuscript, the metabolic volatile profiles of allergic asthma and control children were evaluated by headspace solid-phase microextrac-tion combined with gas chromatography–quadrupole mass spectrometry (HS-SPME/GC–qMS). The lack of studies in breath of allergic asthmatic children by HS-SPME led to the development of an experimental design to optimize SPME parameters. To fulfil this objective, three important HS-SPME experimen-tal parameters that influence the extraction efficiency, namely fibre coating, temperature and time extractions were considered. The selected conditions that promoted higher extraction efficiency cor-responding to the higher GC peak areas and number of compounds were: DVB/CAR/PDMS coating fibre,
22◦C and 60 min as the extraction temperature and time, respectively. The suitability of two containers,
1 L Tedlar®bags and BIOVOC®, for breath collection and intra-individual variability were also
investi-gated. The developed methodology was then applied to the analysis of children exhaled breath with allergic asthma (35), from which 13 had also allergic rhinitis, and healthy control children (15), allowing to identify 44 volatiles distributed over the chemical families of alkanes (linear and ramified) ketones, aromatic hydrocarbons, aldehydes, acids, among others. Multivariate studies were performed by Partial Least Squares–Discriminant Analysis (PLS–DA) using a set of 28 selected metabolites and discrimination between allergic asthma and control children was attained with a classification rate of 88%. The allergic asthma paediatric population was characterized mainly by the compounds linked to oxidative stress, such as alkanes and aldehydes. Furthermore, more detailed information was achieved combining the volatile metabolic data, suggested by PLS–DA model, and clinical data.
© 2011 Elsevier B.V. All rights reserved.
1. Introduction
Asthma is defined as a chronic inflammatory disorder with inter-mittent symptoms of cough, dyspnoea, wheezing and chest pain. Allergic asthma represents an important public health issue with significant growth over the years and affects individuals of all ages from infants to the elderly prevailing as the major cause of illness and consequent hospitalization in children of developed countries altering both patients and families’ normal activities and therefore impairing life quality. Allergic asthma is also associated with high direct and indirect health costs, especially related with diagnosis and treatment. It is estimated that globally the total cost spent with
∗Corresponding author. Tel.: +351 234401524; fax: +351 234370084.
E-mail address:[email protected](S.M. Rocha).
allergic asthma patients is 4 times higher to those of general pop-ulation and only in the European Community represents several billion Euros[1].
Currently, diagnosis is based upon symptoms and in the mea-surement of non-specific and broad biomarkers (for example, Immunoglobulin E – IgE). As molecular diagnosis is the next genera-tion of personalized medicine[2]an objective of the purposed work is to contribute for the interdisciplinary link between physicians and biochemists, providing tools for a more efficient and precise diagnosis. Exhaled breath is a rich source, as found out by Pauling in the 1970s, with the identification of 250 metabolites beside nitro-gen, oxygen and water vapour[3]. The development of new and more efficient extraction methods, as well as, more sensitive and efficient separation techniques led to a significant progress in this research area. The analysis and characterization of exhaled breath became a new approach with potential to provide valuable infor-mation about respiratory and systemic diseases that can lead to
0021-9673/$ – see front matter© 2011 Elsevier B.V. All rights reserved.
a deeper knowledge of human health status, in the identification of disease-related marker compounds and consequently a poten-tial information source regarding the knowledge of these diseases metabolic pathways. Exhaled breath is a non-invasive, easily per-formed and rapid sampling, either in the gaseous or condensed state. For example in the gaseous state, the purpose of the present manuscript, there have been studies in asthma[4], cystic fibrosis [5]and lung cancer[6,7].
Although several breath biomarkers have been reported, their clinical usefulness and meaningfulness has been questioned because of the lack of established sampling and measurement procedures in the analysis of volatile compounds at trace lev-els. Some volatile compounds are of endogenous origin and generated by the human body during normal metabolic processes, some are inhaled with subsequent storage and later exhalation. Distinguishing endogenous compounds from inspiratory contam-inants is not always straightforward. The pattern of volatile compounds in inhaled air is absolutely necessary information, in particular, when the biochemical background of the compounds found is unclear[8]. Volatiles in ambient air originate from various biogenic and anthropogenic sources and are an important class of airborne contaminants[9]. Therefore, the knowledge of ambient air volatile composition is essential to understand the potential influ-ence of exogenous compounds. Thus, parallel sampling of exhaled breath and ambient air is highly recommended.
Several studies have been carried out in exhaled breath using different techniques, with special highlight to the use of desorp-tion tubes filled with a suitable adsorbent[10,11]and solid-phase microextraction (SPME)[12]. SPME has demonstrated an enor-mous potential in exhaled breath analysis and has been applied in the analysis of chemical substances present in nanomolar range. The widespread application of SPME is attributed for its solvent-free feature, it is simple to use, it combines analyte extraction and pre-concentration in a single process allowing direct desorption in the chromatographic system. The extraction of analytes in SPME depends on the absorbent coating of the fibre, as well as on exper-imental parameters, like time and temperature of extraction, and matrix composition[13].
There have been no reports using HS-SPME methodology for the analysis of allergic asthma exhaled breath, specifically in the pae-diatric population. Studies have been developed using HS-SPME in order to establish the volatile composition of human exhaled breath[8]or for a specific type of disease, for example diabetes [14], lung cancer[15]and cystic fibrosis[16]or for chemical sub-stances exposure monitoring[17]. Studies concerning non invasive monitoring of allergic airway inflammation have been made using exhaled nitric oxide[18]or breath condensate[19]. The lack of a prominent HS-SPME study in allergic asthma exhaled breath led us to develop an experimental design by combining HS-SPME with gas chromatography–quadrupole mass spectrometry (GC–qMS) to assess information from allergic asthma metabolomic patterns. To fulfil these objectives three important HS-SPME experimental parameters that influence the extraction efficiency, namely extrac-tion temperature and time, and coating fibre were considered. A full factorial design was applied to determine the best extrac-tion condiextrac-tions using different chemical standards (hydrocarbons, aldehydes, ketones, aromatic and aliphatic alcohols) reported in literature to be present in exhaled breath[8,20,21]. Some exhaled breath sampling parameters were also optimized. Two different breath sampling containers were tested, Tedlar®gas sampling bags and BIOVOCS®and the washing procedure of the chosen container was optimized. Another important parameter, the intra-individual variability, was checked over a period of three weeks with sam-pling throughout a single day. After this optimization, the proposed methodology was applied to the analysis of children exhaled breath with allergic asthma and healthy children, used as control.
Table 1
Characteristics of the studied population: allergic asthma and healthy controls.
Allergic asthma (n= 35) Control (n= 15)
Age in years (mean±SD)/(range)
8.5±2.5/4–13 8.0±3.1/4–13
Gender (male/female) 13/22 7/8
Pathology
Allergic asthma (AA) 22 (63%) –
Allergic asthma + allergic rhinitis (AA + AR)
13 (37%) –
Allergensa
Dust mite 19 (54%) –
Dust mite + cat fur 3 (9%) –
Dust mite + gramineae 3 (9%) –
Dust mite + cat fur + gramineae 1 (3%) –
Information not available 9 (25%) –
Therapy
Corticosteroid + leukotriene receptor antagonist
12 (34%) –
Corticosteroid and anti-histamines
4 (12%) –
Corticosteroid and bronchodilator
13 (37%) –
No therapy 6 (17%) –
aResults obtained by prick-tests.
2. Experimental
2.1. Standards and materials
The reagents used were of analytical grade and from dif-ferent chemical families: linear hydrocarbons (hexane (99.5%, Fluka, Madrid, Spain), undecane (99.8%, Fluka, Madrid, Spain)), aldehydes (hexanal (98%, Sigma–Aldrich, Madrid, Spain), (E )-2-nonenal (95%, Acros Organics, Geel Belgium)), ketones (acetone (99.5%, Fluka, Madrid, Spain), 3-heptanone (97%, Sigma–Aldrich, Madrid, Spain)), and aromatic and aliphatic alcohols (phenol (99%, Merck, New Jersey, USA), 1-hexanol (98%, Sigma–Aldrich, Madrid, Spain)). Absolute ethanol was supplied by Panreac (99.5%, analyt-ical grade, Barcelone, Spain). Ultra pure water was obtained from a Milli-Q system from Millipore (Milford, MA, USA). Four different fibres from Supelco (Bellefonte, PA, USA) were used: divinylben-zene/carboxen/polydimetylsiloxane (DVB/CAR/PDMS, 50/30m), polydimetylsiloxane/divinylbenzene (PDMS/DVB, 65m), poly-dimetylsiloxane (PDMS, 100m) and polyacrilate (PA, 85m). SPME fibres and SPME manual holder was obtained from Supelco (Bellenfonte, PA, USA). All the fibres were of the same length (1 cm) and conditioned prior to use, as recommended by the man-ufacturer. 1 L Tedlar® bags (SKC Inc., Eighty Four, PA, USA) and BIOVOCS®(Markes International, Llanstrisant, UK) were used for sampling.
2.2. Breath samples
M. Caldeira et al. / J. Chromatogr. A1218 (2011) 3771–3780 3773
local hospital. The study was approved by the local hospital ethics committee.
2.3. Experimental design
Different chemical standards were used to perform the full fac-torial design: hexane, acetone, hexanal, 3-heptanone, undecane, 1-hexanol, (E)-2-nonenal and phenol. A stock solution of each standard (1 g/L) was prepared in absolute ethanol and made up to volume, and from this a solution of 100 mg/L was set up. A working solution was prepared to yield different concentrations from 0.4 mg/L (undecane) to 1.6 mg/L (hexanal). To reproduce a two-phase system (headspace and coating fibre), as in breath anal-ysis, 50L was added to a 120 mL SPME flask and sealed with an aluminium crimp cap with a vial was capped with a PTFE sep-tum (Chromacol, Hertfordshire, UK) and concentrations ranged from 166.7 to 670.0 ng/L. Three important SPME experimental parameters were considered on this study: coating fibre, extrac-tion time and temperature. Four different fibres, DVB/CAR/PDMS, PDMS/DVB, PDMS and PA, were tested and compared. Before daily analysis each fibre was conditioned for 15 min at 250◦C. Two differ-ent temperatures (5 and 22◦C) and five different extraction times (5, 15, 30, 45 and 60 min) were evaluated.
2.4. Breath analysis
2.4.1. Breath sampling containers
The suitability of two breath sampling containers was tested and from the wide range available commercially Tedlar®gas sam-pling bags and BIOVOC®were chosen. All tests were made using the exhaled breath of a child with allergic asthma and using the method developed in the experimental design.
Tedlar®gas sampling bags were chosen and due to impurities, derived from the manufacturing process, the washing procedure was verified as the manufacturer suggests. Prior to this step, the purity of the compressed air/nitrogen available in the laboratory was verified and the main conclusion is that the used gases are adequate for this procedure as there is no further contamination by these washing agents (data not shown). The manufacturer recom-mends that before using Tedlar®bags three nitrogen/compressed air flushes should suffice, however the comparison was made between no flush, 3 and 10 nitrogen flushes.
2.4.2. Breath sampling
Exhaled breath was collected in 1 L Tedlar® bags with paral-lel ambient air extraction. Breath samples were obtained while children waited for consultation. Children were asked to cleanse their mouth with water before sampling. Subsequently, children were instructed to inhale and exhaled normally and then exhale deeply into the Tedlar® bag previously holding their breath for 5 s. The collection method was successfully done by all volunteers. Each subject provided one sample using a disposable mouthpiece. Before collecting exhaled breath, all bags were thoroughly cleaned to remove residual contaminants by flushing with high purity nitro-gen gas allowing the re-use of the Tedlar® bags. The bags were transported to the laboratory and the analysis was performed to a maximum of 6 h as recommended by Mochalski et al.[22]. On average, the analysis was performed 2–3 h after sampling. The bags were storage at 22◦C. Parallel room air sampling was also per-formed using a large volume syringe to fill a Tedlar bag with room air.
2.4.3. Intra-individual variability evaluation
There have been reports on the intra-individual variation of exhaled breath over a period of time[23]. This is an important parameter to be assessed for the developed methodology to verify if
the individual profile is repeatable or consistent over time. Hence, the exhaled breath of a child with allergic asthma was collected over a period of three consecutive weeks, six replicates were per-formed and analysed in the same day. All sampling was perper-formed in the same room.
2.4.4. HS-SPME general procedure
Breath analysis was performed with the optimized conditions using the DVB/CAR/PDMS fibre in a 22◦C thermostated room for 60 min. Following the extraction procedure, the SPME fibre was retracted from the Tedlar®bag and inserted in the GC system injec-tion port for 5 min where the compounds were thermally desorbed and transferred to the GC column.
2.5. GC–qMS analysis
The SPME coating fibre containing the volatile compounds from the standard working solution and exhaled breath was manually introduced into the GC injection port at 250◦C and kept for 5 min for desorption. The injection port was lined with a 0.75 mm I.D. glass liner. The desorbed volatile compounds were analysed in an Agilent Technologies 6890N Network gas chromatograph, equipped with a 60 m×0.32 mm I.D., 0.25m film thickness DB-FFAP fused silica capillary column (J&W Scientific, Folsom, CA, USA), connected to an Agilent 5973 quadrupole mass selective detector. Splitless injec-tions were used (5 min). The oven temperature program was set initially to 50◦C, with a temperature increase of 5◦C/min to 220◦C held (6 min). Helium carrier gas had a flow rate of 1.7 mL/min and the column head pressure was 12 psi. The mass spectrometer was operated in the electron impact mode (EI) at 70 eV scanning the range 33–300m/zin a 4.76-s cycle, in a full scan acquisition mode. The identification of the chromatogram peaks was done comparing all mass spectra with the library data system of the GC–qMS equip-ment (NIST 05 MS Library). The spectra were also compared with spectra found in the literature. The identification of each volatile compound was confirmed by comparing its mass spectrum and retention time with those of the pure standard compounds, when available. The GC peak area data were used as an indirect approach to estimate the relative content of each volatile compound. All measurements concerning the chemical standards were made with three replicates and the reproducibility was expressed as Relative Standard Deviation (RSD %). Each breath represents a single sam-ple, and was analysed once. To verify the absence of any carry over, blanks, corresponding to the analysis of the coating fibre not sub-mitted to any extraction procedure, were run between sets of three analyses.
2.6. Statistical analysis
Single factor ANOVA was performed in the evaluation of the intra-individual variability over a period of three weeks. A critical value of 0.05 was used as a criterion of significance and all calcula-tions were performed using the Excel®software (Microsoft). Partial Least Squares (PLS) is a very important procedure for both regres-sion and classification purposes. Concerning the classification application of PLS, known as Partial Least Squares–Discriminant Analysis (PLS–DA) [24], the most common approach is to use
a Y matrix containing dummy variables which defines
clas-Fig. 1.Full factorial design of solid-phase microextraction conditions for GC–qMS analysis of exhaled breath.
sification model complexity (number of latent variables) and classification rate were estimated by internal cross-validation (7 blocks splits).
3. Results and discussion
3.1. Experimental design: HS-SPME optimization
The first stage of this study addressed the HS-SPME parame-ters optimization that influences the extraction process. Different chemical standards reported in literature[8,15]to be present in exhaled breath were used: hexane, acetone, hexanal, 3-heptanone, undecane, 1-hexanol, (E)-2-nonenal and phenol. Experimental design allows estimating the effect of several variables simulta-neously and the complete factorial design enabled the evaluation of three significant factors that greatly influences the vapour pressure and equilibrium of the target compounds in the headspace, therefore affecting the extraction efficiency: fibre coat-ing (DVB/CAR/PDMS, PDMS/DVB, PDMS and PA), temperature (5 and 22◦C) and extraction time (5, 15, 30, 45 and 60 min) with a total of 120 runs being performed. The obtained results can be seen inFig. 1, in which each bubble represents the total chromatographic area of the eight standards under study inherent to three different variables (extraction temperature, extraction time and SPME fibre coating). Through the bubble illustration, shown inFig. 1, it is easy to evaluate the overall extraction efficiency, since a larger bubble represents a higher total chromatographic area.
The comparison was made in terms of total extraction efficiency and reproducibility. The highest extraction efficiency was obtained using the DVB/CAR/PDMS fibre in all studied extraction times and temperatures while PA (22◦C) and PDMS (5◦C) showed the lowest sorptive capacity. The nature of the analytes influences the SPME fibre selection. Previous reports[7,25] on exhaled breath analysis used PDMS because these studies were focused in alka-nes and aromatic hydrocarbons. These compounds are non-polar, so it is preferable a PDMS phase. The methodology optimized in the present manuscript is to be used in a wide range of analytes, which explains that DVB/CAR/PDMS fibre obtained the best results, as its stationary phase has a synergistic effect between adsorp-tion and absorpadsorp-tion. The mutually synergetic effect of adsorpadsorp-tion and absorption of the stationary phase promotes a high retention capacity and, consequently, a higher sensitivity than fibres based on absorption only. Therefore, as DVB/CAR/PDMS presents a wide range capacity of sorbing compounds and it is recommended by the producers in the analysis of compounds with different physic-ochemical properties within a molecular weight ranging from 40 to 275.
44
22
0 5 10 15 20 25 30 35 40 45 50
0.0E+00 2.0E+07 4.0E+07 6.0E+07 8.0E+07
Tedlar Biovoc
Number of Compounds
Total Peak Area (a.u.)
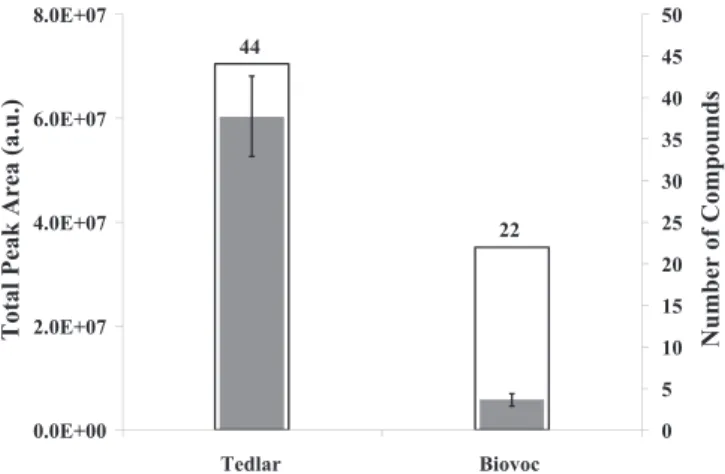
Fig. 2.Total peak area and number of compounds comparison between two breath collection containers (Tedlar®gas sampling bags and BIOVOC®). a.u. – arbitrary
units.
The extraction time was studied by increasing the fibre expo-sure time from 5 to 60 min. Higher extraction time promoted higher extraction efficiency for all the fibres under study. For the selected standards, higher extraction efficiency was achieved with an extraction time of 60 min. Although this is a long extraction time, maximum sensitivity is desirable, at this particular stage, so that the knowledge of exhaled breath is maximized.
The SPME process is also influenced by temperature. Higher extraction temperature usually increases the analytes release, therefore increasing their concentration in the headspace, due to the enhanced mass transfer (kinetics). Two temperatures were studied: 5◦C and 22◦C (room air temperature). Higher tempera-tures were avoided because heating these containers could possibly release contaminants or produce artifacts to the headspace, there-fore influencing the results. For all fibres and extraction times under study, 22◦C allowed higher extraction efficiency.
The extraction at 22◦C for 60 min with the SPME coating fibre DVB/CAR/PDMS was selected for further breath extractions. For the selected conditions, RSD was considered acceptable (10%).
3.2. Breath analysis
Beside the HS-SPME optimization for breath analysis there are several factors that have to be considered and optimized. Among the factors, we optimized the type of breath sampling containers used, the cleaning procedure adopted to such containers as well as an important parameter such as intra-individual variability. After these optimization steps, the developed methodology was applied to a set of 50 children (35 with allergic asthma, among these 13 had also allergic rhinitis and 15 healthy controls).
3.2.1. Breath sampling containers
There are a wide range of methods for sampling exhaled breath, which can include canisters, cold trapping, adsorbing agents, BIOVOC®, Teflon and Tedlar® gas sampling bags. These contain-ers should be easy to operate, easy to handle and be able to store a sample for a prolonged period of time (in breath sampling the stor-age time is a major drawback). Cost, re-usability, durability, size and versatility are other important issues to take in consideration when choosing the adequate container. As a result, Tedlar®gas sampling bags and BIOVOC®were chosen for further studies.
M. Caldeira et al. / J. Chromatogr. A1218 (2011) 3771–3780 3775
Table 2
Volatiles identified in Tedlar bags and cleansing procedure effects with rising number of nitrogen flushes.
Retention time (min) Compounds CAS number Volatiles identified in Tedlar bags
No nitrogen flushes 3 nitrogen flushes 10 nitrogen flushes
Linear alkanes
6.34 Hexanea 110-54-3 x x x
7.20 2,4-Dimethyl-heptane 2213-23-2 x n.d. n.d.
7.65 4-Methyl-octane 2216-34-4 x n.d. n.d.
11.40 Undecanea 1120-21-4 x n.d. n.d.
Carbonyl compounds
7.39 Acetonea 67-64-1 x x n.d.
26.48 Benzaldehydea 100-52-7 x x x
21.10 Acetic acida 64-19-7 x x x
Aromatic compounds
33.77 Phenola 108-95-2 x x x
13.56 dMethEthBenzb 1075-38-3 x x x
14.32 m/z105, 122, 91 – x x x
Miscellaneous
8.57 Dichloromethanea 75-09-2 x x x
10.20 ␣-pinenea 80-56-8 x x x
10.10 Chloroforma 67-66-3 x x n.d.
25.23 (N,N-dimethyl)-acetamide 127-19-5 x x x
35.18 Diethyl phthalate 84-66-2 x x x
36.71 Phthalate isobutyrate 103-28-6 x x x
n.d. – not detected.
aCompounds confirmed by chemical standards.
b dMethEthBenz: 1-(1,1-dimethylethyl)-3-methyl-benzene.
breath. There was a great difference between both containers with the identification of forty-four compounds for samples stored in Tedlar® bags, while for samples stored in BIOVOC® twenty-two were identified. In terms of total peak area, the difference between BIOVOC®and Tedlar®bag was considerable as BIOVOC®total peak area only represented 10% of the obtained by using the Tedlar®bag. For follow-up procedures, the Tedlar®bag was chosen.
Tedlar®bags are frequently used to collect exhaled breath[26] as it fulfils the requisites for sampling and storing this type of sam-ples. Nevertheless, Tedlar®bags have two main disadvantages: (1) impurities derived from the manufacturing process and (2) sam-ple leakage due to adsorption or diffusion through the walls. The manufacturer recommends flushing the bag three times with com-pressed air or nitrogen before use so that the contaminants are eliminated. The effectiveness of this routine on Tedlar®bags was
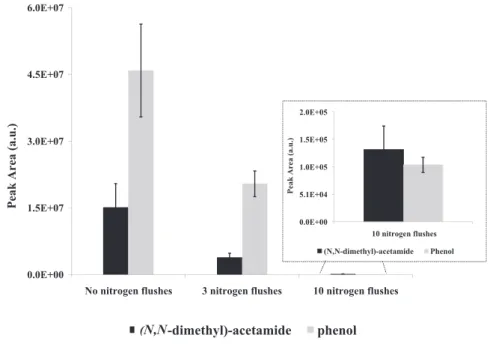
evaluated from no flush, flushing three and ten times using the previously HS-SPME/GC–qMS developed methodology. Blank runs were made, filling the Tedlar®gas sampling bags with compressed air and several pollutants, a total of sixteen compounds, were iden-tified (Table 2). Increasing the number of nitrogen flushes produces a positive result as the number of compounds diminishes. Never-theless, a more detailed overview of these results is demonstrated taking into consideration two contaminants reported in literature [26], (N,N-dimethyl)acetamide and phenol. There is a significant reduction of the total peak areas with the increase of number of flushes. For (N,N-dimethyl)acetamide, the total peak area dimin-ished 74% and 94% whereas for phenol the reductions were of 57% and 99% with three and ten flushes respectively, relatively to the initial composition (no flush) (Fig. 3). For further analysis, Tedlar® bags were vacuumed and flushed ten times with nitrogen. With
0.0E+00 5.1E+04 1.0E+05 1.5E+05 2.0E+05
10 nitrogen flushes
Peak Area (a.u.)
(N,N-dimethyl)-acetamide Phenol
0.0E+00 1.5E+07 3.0E+07 4.5E+07 6.0E+07
No nitrogen flushes 3 nitrogen flushes 10 nitrogen flushes
Peak Area (a.u.)
(N,N-dimethyl)-acetamide
phenol
(N,N
Table 3
Identified compounds in exhaled breath in both children with allergic asthma and control children and obtained from ambient air parallel sampling.
Peak number R.T. (min) Compounds CAS number m/z Breath Ambient air
Alkanes
1 6.34 Hexanea 110-54-3 57b, 43,41 x x
3 7.20 2,4-Dimethylheptane 2213-23-2 43,57,85 x n.d.
5 7.65 4-Methyloctane 2216-34-4 43,41,85 x x
6 8.94 2,2,4-Trimethylhexane 16747-26-5 57,56,41 x x
7 9.57 Decanea 124-18-5 43,57,41 x n.d.
8 10.19 3,3-Dimethylheptane 4032-86-4 43,57,71 x n.d.
10 10.29 2,4-Dimethyloctane 4032-94-4 57,71,85 x n.d.
12 11.15 3-Ethyl-3-methylheptane 17302-01-1 71,43,85 x n.d.
13 11.27 2,3,7-Trimethyldecane 62238-13-5 43,71,57 x n.d.
14 11.40 Undecanea 1120-21-4 71,43,57 x n.d.
16 11.61 2,3-Dimethyldecane 17312-44-6 71,43,85 x n.d.
19 14.10 Dodecanea 112-40-3 57,43,71 x x
21 15.15 3,9-dimethylundecane 17301-31-4 71,57,43 x n.d.
25 16.56 3,6-Dimethyldecane 13150-81-7 71,43,57 x n.d.
26 16.57 Tridecanea 629.50-5 57,43,71 x n.d.
28 16.82 n.i. – 43,71,57 x n.d.
29 17.11 n.i. – 71,57,43 x n.d.
31 17.42 2,5,6-Trimethyldecane 62108-23-0 71,57,43 x n.d.
33 19.35 Tetradecanea 629-59-4 57,43,71 x x
38 21.64 Pentadecanea 629-62-9 71,43,85 x x
39 21.90 n.i. – 43,85,71 x n.d.
41 22.50 n.i. – 57,71,85 x n.d.
42 22.73 n.i. – 71,43,57 x x
47 24.30 Hexadecanea 544-76-3 57,43,71 x n.d.
48 25.08 2-Methyl-tridecane 1560-96-9 57,43,71 x n.d.
52 25.86 2,6,10-Trimethyldodecane 3891-98-3 57,71,43 n.d. x
53 26.24 2-Methylpentadecane 1560-93-6 57,43,71 x x
59 28.26 n.i. – 57,71,85 n.d. x
Ketones
4 7.39 Acetonea 67-64-1 43,58,42 x x
30 17.27 Cyclohexanonea 108-94-1 55,98,42 n.d. x
32 18.08 6-Methyl-5-hepten-2-onea 110-93-0 43,41,69 x x
54 26.48 Acetophenonea 98-86-2 105,120,77 x x
Terpenic compounds
9 10.20 ␣-Pinenea 80-56-8 93,92,91 n.d. x
17 12.15 ␣-Phellandrenea 99-83-2 93,77,79 n.d. x
20 14.39 Limonenea 138-86-3 68,67,93 n.d. x
51 25.61 Menthola 1490-04-6 71,95 n.d. x
63 30.48 Nerylacetonea 3879-26-3 43,69,107 n.d. x
Aromatic hydrocarbons
11 10.93 Toluenea 108-88-3 91,92,65 x x
18 13.02 p-Xylenea 106-42-3 91,106,65 x x
24 16.21 Styrene 100-42-5 104,103,78 x n.d.
60 28.72 Napthalenea 91-20-3 128,120,102 n.d. x
76 37.23 2,6bmethnapthc 24157-81-1 197,212,155 n.d. x
Aldehydes
15 11.51 Hexanala 66-25-1 44,56,41 n.d. x
34 19.55 Nonanala 124-19-6 43,57,57 x x
40 22.24 Decanala 112-31-2 41,43,57 x x
44 23.46 Benzaldehydea 100-52-7 77,105,106 x x
Acids
36 21.10 Acetic acida 64-19-7 43,45,60 x x
43 23.20 Propanoic acida 79-09-4 74,45,73 x n.d.
57 27.83 Pentanoic acida 109-52-4 60,70,41 n.d. x
62 30.18 Hexanoic acida 142-62-1 60,73,41 n.d. x
66 32.24 2-Ethylhexanoic acid 149-57-5 88,73,57 n.d. x
67 32.40 Heptanoic acida 111-14-8 60,73,87 n.d. x
72 34.49 octanoic acida 124-07-2 60,73,43 n.d. x
Miscellaneous
2 6.48 2-Methyl-1,3-butadiene 78-79-5 67,68,53 x n.d.
22 15.27 n.i. – 57,55,43 x x
23 15.71 n.i. – 105,120,43 x n.d.
27 16.79 n.i. – 105,120,84 n.d. x
35 19.68 2-Butoxy-ethanol 111-76-2 57,45,41 x x
37 21.45 2,1meox2propd 20324-33-8 59,103,43 n.d. x
45 23.82 n.i. – 73,43,59 n.d. x
46 23.98 n.i. – 57,82,67 n.d. x
49 25.19 2etoxethe 111-90-0 45,59,72 n.d. x
50 25.50 Phenylethyl acetate 103-45-7 94,43,136 x n.d.
55 26.63 n.i. – 71,57,43 x x
56 26.77 4-tert-Butylcyclohexyl acetate 32210-23-4 57,80,73 n.d. x
58 28.00 Benzyl acetatea 140-11-4 108,91,90 n.d. x
61 29.19 n.i. – 57,41,71 n.d. x
M. Caldeira et al. / J. Chromatogr. A1218 (2011) 3771–3780 3777
Table 3 (Continued)
Peak number R.T. (min) Compounds CAS number m/z Breath Ambient air
65 31.97 2-Phenyldodecane 2719-61-1 91,73,122 n.d. x
68 32.51 1-Undecanola 112-42-5 55,43,69 n.d. x
69 33.19 2-Methyl-1-undecanol 10522-26-6 58,43,69 n.d. x
70 33.77 Phenola 87-66-1 94,66,65 x x
71 33.87 Isopropyl tetradecanoate 110-27-0 228,102,229 n.d. x
73 35.19 -Iononea 14901-07-6 177,119,135 n.d. x
74 35.66 2-Methyl--ionone 127-43-5 191,121,105 n.d. x
75 36.78 -Phenoxyethyl alcohol 9004-78-8 94,138,77 n.d. x
n.i.: not identified. n.d. – not detected.
aCompounds confirmed by chemical standards. b Used fragment for area determination.
c 2,6bmethnapth: 2,6-bis(1-methylethyl)naphthalene. d 2,1meox2prop: 2,1-(2-methoxy-1-methylethoxy)-2-propanol. e2etoxeth: 2-(2-ethoxyethoxy)ethanol.
these results a standard cleaning protocol for the Tedlar®bags was established for the present study.
3.2.2. Intra-individual variability evaluation
The intra-individual variability was examined, comparing the data per subject from day to day, and throughout each day, by repeating breath sampling for the same child with allergic asthma over a period of 3 weeks with six daily collections (n= 18). This is an important factor in the evaluation of the developed methodology to determine whether a breath sample is dependent on the period of time that it is collected.Fig. 4summarizes the results of six selected compounds that represent linear and rami-fied alkanes and aldehydes. Single factor ANOVA was performed to evaluate data variability and there were no significant differences between days, and throughout each day, represented by weeks 1, 2 and 3 (p< 0.05). However, accordingly toFig. 5, there are intra-individual variations between samples over different days of the three weeks as well as in the same day that can be explained by several factors, as for example the circadian rhythm, and diet (sam-pling were performed throughout the day, before and after meals with different daily diets). It was confirmed that the child asthma status was maintained during this experiment with no occurrence of an asthma crisis. This study was performed with a single subject, and the results obtained are similar to those reported in previous study that has used a larger number of subjects[4].
3.2.3. Exhaled breath analysis
The developed HS/SPME-GC–qMS methodology was applied to exhaled children breath samples. Forty-four volatile compounds were identified belonging to different chemical families such as alkanes (linear and ramified), ketones, aromatic hydrocarbons, aldehydes, acids, among others (Table 3). The predominant group identified in exhaled breath were the alkanes (26 compounds). The identified compounds are also reported in other studies performed using exhaled breath[27–29].
Parallel room air sampling was also performed by the reported fact that in the environment there are a whole range of volatiles from several sources, which may influence the obtained results. Room air analysis allowed the identification of fifty-three com-pounds that belong to several different chemical families: alkanes (linear and ramified ketones, terpenic compounds, aromatic hydro-carbons, aldehydes, acids, among others (Table 3)). From these, twenty-one compounds were common to children exhaled breath. Compounds that were present in room air with higher areas than in breath were discarded for PLS–DA analysis, as hexane for example, among others.
3.3. Multivariate analysis
Twenty-eight from the forty-four volatiles were selected for multivariate analysis. This selection was made taking account the compounds that were present in all children with allergic asthma and by disregarding compounds that are known as sol-vents and contaminations (for example, aromatic hydrocarbons). PLS–DA was applied to the GC chromatographic unit variance scaled areas to establish a preliminary classification model and assess the relationships between the compounds and the chil-dren under study. Fig. 5a shows the scores scatter plot of the first two Latent Variables (LV1xLV2), while Fig. 5b shows the corresponding loading weights plot which establishes the con-tribution of each volatile metabolite that promotes the observed discrimination. The classification model was assessed by inter-nal cross-validation (7 blocks) giving a model with 4 LVs with a classification rate of 88%. A limited number of metabolites (28) were used to classify children with allergic asthma and healthy controls using discriminant analysis, with special highlight to com-pounds linked to oxidative stress such as alkanes and aldehydes [30]. These metabolites were not unique to children with allergic asthma and were also observed in healthy children in greater or lesser abundance as normal human metabolism generates a wide variety of metabolites. Airway inflammation plays a central role in the pathophysiology of asthma and during this process a degra-dation of polyunsaturated fatty acids occurs due to the imbalance between oxidants and antioxidants. This imbalance is explained by the continuous production of reactive oxygen species (ROS) caused by an influx of leukocytes characteristic of lung inflamma-tion in asthma. During this process volatile metabolites are formed by lipid peroxidation of-3 and-6 polyunsaturated fatty acids [31].
Fig. 4.Evaluation of the intra-individual variability over a period of three weeks for selected group of six metabolites.
Fig. 5.PLS–DA LV1xLV2 scores scatter plot (a) and loading weights plot (b) of exhaled breath for allergic asthma (AA and AA + RA) and control (CTL) children. Peak iden-tification is presented inTable 3(2: 2-methyl-1,3-butadiene,4: acetona,7: decane,8: 3,3-dimethylheptane,10: 2,4-dimethyloctane,12: 3-ethyl-3-methylheptane,13: 2,3,7-trimethyldecane,14: undecane,16: 2,3-dimethyldecane;19: dodecane,21: 3,9-dimethylundecane,25: 3,6-dimethyldecane,26: tridecane,28: n.i.m/z43,71,57,29: n.i.m/z71,57,43,31: 2,3,6-trimethyldecane;33: tetradecane,38: pentadecane,41: n.i.m/z43,85,71;42: n.i.m/z71,43,57,47: hexadecane,48: 2-methyltridecane,53: 2-methylpentadecane).
Clinical data such as therapy, spirometry values, IgE values and prick test results were also available. The PLS–DA scores scatter plot was tentatively explained using clinical data. Allergic asthma is a condition associated to airspace inflammation with increas-ing evidence that lipid peroxidation may have an important part in the differentiating the composition of exhaled breath between
M. Caldeira et al. / J. Chromatogr. A1218 (2011) 3771–3780 3779
the nose. Both allergic asthma and rhinitis are systemic inflamma-tory conditions and usually over 80% of asthmatics have rhinitis and 10–40% of patients with rhinitis have asthma. In the studied population, 63% were diagnosed with allergic asthma (AA) while 37% with allergic asthma and allergic rhinitis (AA + AR) and from the PLS–DA we denote that AA + AR cases are predominantly in LV1 negative LV2 positive whereas for AA children there is a higher scattering throughout LV1 axis. Both diseases are inflammatory dis-eases; however inflammation in rhinitis is concentrated in the nose while in allergic asthma occurs in the airways modifying the volatile composition as observed inFig. 5a.
Prick tests were also available with 54% of the studied cases being allergic to dust mites, 9% dust mites and gramineae, 9% dust mites and cat fur and 3% to dust mite, gramineae and car fur. Due to a higher number of cases, the cases with positive prick tests to dust mites are highlighted in the PLS–DA and from this data we observe a high dispersion through LV1 axis. As for the other possible combinations, a higher number of cases are necessary to exert any conclusions.
Several medication combinations are prescribed by clinicians to control allergic asthma and rhinitis. Inhaled corticosteroids prevent asthma symptoms by blocking the late-phase immune reaction to an allergen, reduce airway hypersponsiveness and decreases inflammation and inhibit inflammatory cells such as mast cells, eosinophils and basophils. Leukotriene receptor antag-onist or leukast are drugs that inhibit the leukotrienes receptors, compounds that are produced by the immune system that cause inflammation in asthma and that constrict airways whereas a his-tamine antagonist or antihishis-tamine is an agent that inhibits the action of histamine that is released in excess by an allergic reac-tion. Bronchodilators are used to dilate the bronchi and bronchioles decreasing airway resistance and thereby facilitating airflow. In our population, the three most frequent combinations were: inhaled corticosteroids and leukotriene receptor antagonist, inhaled cor-ticosteroids and anti-histamines or inhaled corcor-ticosteroids and bronchodilator. As far as medication effects on breath volatile composition that should reflect the inflammation, we observed in the PLS–DA (highlighted with an asterisk inFig. 5a) differences between the exhaled breath of children that used a combination between corticosteroid and leukotriene receptor antagonist for asthma control as these individuals presented themselves closer to control subjects than other subjects that were under cortico-steroid and anti-histaminic or corticocortico-steroid and bronchodilator therapy. This occurrence may be explained by the properties of the combination of inhaled corticosteroids and leukotriene receptor antagonist as both decrease inflammation consequently affecting the volatile composition of exhaled breath and thereby inflamma-tion compounds such as linear and ramified alkanes.
4. Conclusions
In this study, we report the development of HS-SPME/GC–qMS methodology using a full factorial design. Breath sampling related subjects such as breath sampling containers and their cleaning, as well as an important parameter like intra-individual variability were also determined. The optimization of SPME parameters was done with selected standards representative of different chemi-cal families previously reported in human breath[8,15]and the higher extraction efficiency was obtained with the mixed phase DVB/CAR/PDMS fibre with an extraction of 60 min and a tempera-ture of 22◦C.
The comparison between 1 L Tedlar® gas sampling bags and BIOVOC®, for breath collection, showed Tedlar®gas sampling bags to be the most adequate containers for collecting breath samples. The cleaning protocol for the Tedlar® bags was also established
and consists of flushing the bag with nitrogen ten times, pre-ceded by vacuum. As for intra-individual variability, results show that there was no statistical difference between sampling exhaled breath within the same day as well as sampling between different weeks, if the asthma status is maintained.
The developed methodology was then successfully applied to breath samples of allergic asthma children and healthy controls, allowing the identification of forty-four volatiles from different chemical families, namely: alkanes (linear and ramified) ketones, aromatic hydrocarbons, aldehydes, acids, among others. Multivari-ate studies were performed (PLS–DA) using a set of 28 selected metabolites and the corresponding loadings suggested the com-pounds that promoted the observed distinction between allergic asthma and control children. The allergic asthma population was characterized mainly by the compounds possibly linked to oxida-tive stress, such as alkanes and aldehydes, which is a characteristic of airway inflammation. Furthermore, more detailed information can be achieved about the asthma metabolic volatile profile by the proposed approach. The advantage of the developed method-ology was observed when the volatile metabolic data processed by PLS–DA was explained using the clinical data. Further studies are being performed increasing the number of allergic asthma and healthy children.
Although the number of cases studied is relatively small (50), the obtained results generated fundamental information which represents the scientific basis for the definition of a rapid and non-invasive diagnostic tool. The results of this study provided a novel methodological approach to characterise allergic asthma as a func-tion of its metabolomic patterns, which will open new strategies to early diagnosis, therapy monitoring, and understanding the asthma pathogenesis that affects millions around the world.
Acknowledgments
M. Caldeira thanks FCT (Fundac¸ão para a Ciência e Tecnologia) for his PhD grant (SFRH/BD/40374/2007). The authors are grateful to the donors that kindly supplied the samples and to Paediatric Service of the Hospital D. Pedro (Aveiro, Portugal) for the conditions to perform this study and for the financial support of the Research Unit 62/94, QOPNA.
References
[1] M.E. Van den Akker-van Marle, J. Bruil, S.B. Detmar, Allergy 60 (2005) 140. [2] M.D. Lim, A. Dickherber, Anal. Chem. 83 (2011) 8.
[3] L. Pauling, A.B. Robinson, R. Teranishi, P. Cary, Proc. Natl. Acad. Sci. U. S. A. 68 (1971) 2374.
[4] J.W. Dallinga, C.M.H.H.T. Robroeks, J.J.B.N. Van Berkel, E.J.C. Moonen, R.W.L. Godschalk, Q. Jobsis, E. Dompeling, E.F.M. Wouters, F.J. Van Schooten, Clin. Exp. Allergy 40 (2009) 68.
[5] M. Barker, M. Hengst, J. Schmid, H.-J. Buers, B. Mittermaier, D. Klemp, R. Kopp-mann, Eur. Respir. J. 27 (2006) 929.
[6] I. Horváth, Z. Lázár, N. Gyulai, M. Kollai, G. Losonczy, Eur. Respir. J. 34 (2009) 261.
[7] E.M. Gaspar, A.F. Lucena, J.D. da Costa, H.C. das Neves, J. Chromatogr. A 1216 (2009) 2749.
[8] T. Ligor, M. Ligor, A. Amann, C. Ager, M. Bachler, A. Dzien, B. Buszewski, J. Breath Res. 2 (2008) 1.
[9] J.-H. Lee, S.M. Hwasng, D.W. Lee, G.S. Heo, B Korean Chem. Soc. 23 (2002) 488. [10] J.J.B.N. Van Berkel, J.W. Dallinga, G.-M. Moller, R.W.L. Godschalk, E. Moonen,
E.F.M. Wouters, F.J. Van Schooten, Respir. Med. 104 (2010) 557.
[11] M. Phillips, V. Basa-Dalay, G. Bothamley, R. Cataneo, P. Lam, M. Natividad, P. Schmitt, J. Wai, Tuberculosis 90 (2010) 145.
[12] S. Kischel, W. Miekisch, A. Sawacki, E. Straker, P. Trefz, A. Amann, J. Schubert, Clin. Chim. Acta 411 (2010) 1637.
[13] M.-R. Lee, Y.C. Yeh, W.S. Hsiang, C.C. Chen, J. Chromatogr. B 707 (1998) 91. [14] G. Deng, J. Zhang, X. Yu, W. Zhang, X. Zhang, J. Chromatogr. B 810 (2004) 269. [15] G. Song, T. Qin, H. Liu, G.B. Xu, Y.P. Pan, F.X. Xiong, K.S. Gu, G.P. Sun, Z.D. Chen,
Lung Cancer 67 (2009) 227.
[16] L.T. McGrath, R. Patrick, P. Mallon, L. Dowey, B. Silke, W. Norwood, S. Elborn, Eur. Respir. J. 16 (2008) 1065.
[18] S.L. Nordvall, C. Janson, P. Kalm-Stephens, T. Foucard, K. Torén, K. Alving, Allergy 60 (2005) 469.
[19] C.M. Robroeks, K.D. van de Kant, Q. Jobsis, H.J. Hendriks, R. van Gentw, E.F. Woutersz, J.G. Damoiseaux, A. Bastz, W.K. Wodzigk, E. Dompeling, Clin. Exp. Allergy 37 (2007) 1303.
[20] K. Schwarz, W. Filipaik, A. Amann, J. Breath Res. 3 (2009) 1. [21] A. Mashir, R.A. Dweik, Adv. Powder Technol. 20 (2009) 420.
[22] P. Mochalski, B. Wzorek, I. Sliwka, A. Amann, J. Chromatogr. B 877 (2009) 189. [23] J.J.B.N. Van Berkel, J.W. Dallinga, G.-M. Moller, R.W.L. Godschalk, E. Moonen,
E.F.M. Wouters, F.J. Van Schooten, J. Chromatogr. B 861 (2008) 101.
[24] L. Eriksson, E. Johansson, N. Kettaneh, N. Wold, S. Wold, Multi and Megavariate Data Analysis, Principles and Applications, Umetrics AB, Umea, Sweden, 2001. [25] H. Yu, L. Xu, P. Wang, J. Chromatogr. B 826 (2005) 69.
[26] M. Steeghs, S. Cristescu, F.J. Harren, Physiol. Meas. 28 (2007) 73.
[27] M. Ligor, T. Ligor, A. Bajtarevic, C. Ager, M. Pienz, M. Klieber, H. Denz, M. Fiegl, W. Hilbe, W. Weiss, P. Lukas, H. Jamnig, M. Hackl, B. Buszewski, W. Miekisch, J. Schubert, A. Amann, Clin. Chem. Lab. Med. 47 (2009) 550.
[28] W. Filipiak, A. Sponring, A. Filipiak, C. Ager, J. Schubert, W. Miekisch, A. Amann, J. Troppmair, Cancer Epidemiol. Biomarkers Prev. 19 (2010) 182.
[29] A. Bajtarevic, C. Ager, M. Pienz, M. Klieber, K. Schwarz, M. Ligor, T. Ligor, W. Filipiak, H. Denz, M. Fiegl, W. Hilbe, W. Weiss, P. Lukas, H. Jamnig, M. Hackl, A. Haidenberger, B. Buszewski, W. Miekisch, J. Schubert, A. Amann, BMC Cancer 9 (2009) 348.
[30] M. Phillips, R.N. Cataneo, B.A. Ditkoff, P. Fisher, J. Greenberg, R. Gunawardena, C.S. Kwon, F. Rahbari-Oskoui, C. Wong, Breast J. 9 (2003) 184.