Article
J. Braz. Chem. Soc., Vol. 25, No. 7, 1302-1310, 2014. Printed in Brazil - ©2014 Sociedade Brasileira de Química 0103 - 5053 $6.00+0.00
A
*e-mail: [email protected]
The Influence of Salinity and Matrix Effect in the Determination of Antifouling
Biocides in Estuarine Waters of Patos Lagoon (Southern Brazil)
Luís A. E. Dominguez,a Sergiane S. Caldas,b Ednei G. Primelb and Gilberto Fillmann*,a
aInstituto de Oceanografia, Programa de Pós-Graduação em Oceanografia Química, Física e Geológica and bEscola de Química e Alimentos, Programa de Pós-Graduação em
Química Tecnológica e Ambiental, Universidade Federal do Rio Grande-FURG, Av. Itália, km 8 s/n, 96203-900 Rio Grande-RS, Brazil
Um método para determinação de diuron e irgarol utilizando extração em fase sólida (SPE) com C18 e cromatografia líquida acoplada a espectrometria de massas com ionização por eletronebulização foi otimizado, validado e aplicado em amostras de águas estuarinas e costeiras sob influência dos portos de Rio Grande. Os impactos da pré-filtração e salinidade no processo de SPE, utilizando C18 e adsorvente polimérico, foram avaliados e não foi observado efeito. Recuperações entre 95 e 118% (desvio padrão relativo < 20%) e limites de detecção e quantificação do método de 1,3 e 4 ng L–1, respectivamente, foram determinados para ambos os compostos. As
curvas analíticas apresentaram coeficientes de correlação maiores que 0,99. O efeito matriz foi menor que 20% para irgarol e entre 45,7 e 63,5% para diuron. Diuron e irgarol foram encontrados em 8 e 9 dos 21 locais amostrados, respectivamente, com concentrações variando entre < 1,3 a 20,9 ng L–1. As baixas concentrações encontradas, juntamente com as restrições internacionais
de uso e a sua ausência nas quatro tintas anti-incrustantes usadas na região, indicam que os níveis de irgarol e diuron são provavelmente pouco relevantes nesta região. Além disso, estão abaixo daquelas capazes de causar danos às espécies aquáticas.
A method for the determination of irgarol and diuron using C18 solid-phase extraction (SPE) and liquid chromatography with electrospray interface tandem mass spectrometry was optimized, validated and applied in estuarine and coastal waters under the influence of Rio Grande harbors (Patos Lagoon). The impact of pre-filtration and salinity in the extraction processes by SPE using C18 and polymeric adsorbents were evaluated and no effect was detected. Recoveries between 95 and 118% (relative standard deviation lower than 20%) and limit of detection and quantification for the method of 1.3 and 4 ng L–1, respectively, were reached for both compounds. The analytical
curves presented correlation coefficients higher than 0.99. The matrix effect was lower than 20% for irgarol and between 45.7 and 65.3% for diuron. Diuron and irgarol were detected in 8 and 9 out of 21 sampled sites, respectively, with concentrations ranging from < 1.3 to 20.9 ng L–1.
The low concentrations found, together with international restrictions of use and their absence in the four main antifouling paints used in the region, indicate that levels of diuron and irgarol are probably not relevant in this region. In addition, these levels were below of those capable of causing effects on tested species.
Keywords: antifouling, estuarine water, SPE, LC-ESI-MS/MS, Patos lagoon estuary
Introduction
Marine biofouling can be defined as the undesirable accumulation of microorganisms, such as bacteria and microalgae, plants and invertebrates, on artificial surfaces submerged in seawater.1 The need for effective
antifouling biocides, which prevent the settlement and
growth of those marine organisms and other invertebrates on ships, boats and submerged structures is recognized worldwide.
environmental levels of TBT (10 ng L–1) can cause lethal
and sublethal effects on ecologically and economically important non-target species.2 Organotin antifouling
compounds have been regulated worldwide since the late 1980s, but only in 2008 an international regulation came into force. As a consequence, numerous alternative organic antifouling booster biocides have been developed and applied as organotin-free antifouling coatings.3
The term “booster biocides” encompasses a group of compounds that are added to antifouling paints, mainly copper-based formulations, to enhance their performance in preventing algae and seaweed from colonizing boat hulls.4 These biocides are added because
some common marine algae (e.g., Enteromorpha sp. and Amphora sp.) are tolerant to copper.5 Irgarol and diuron
were among the most commonly added substances to act as biocides agents in antifouling paints. Irgarol (2-methylthio-4-tertbutylamino-6-cyclopropylamino-s-triazine) is a symmetrical triazine while diuron (N -(3,4-dichlorophenyl)-N,N-dimethyl-urea) is a phenylurea. These herbicides inhibit photosynthesis and have toxic effects on the macrophytes and phytoplankton communities at µg L–1 and ng L–1 levels.6 The active
ingredients become available to the fouling organisms by leaching from the paint coating and also contaminating the aquatic environment. Thus, in areas with intense maritime activities, a complex mixture of those biocides can be found.7 Irgarol is not very toxic to fish and crustacean
species.2 On contrary, diuron is considered moderately
toxic to fish and slightly toxic to aquatic invertebrates, being considered a priority hazardous substance by the European Commission.8 Toxicological effects of diuron
and irgarol on various species have been compiled in review papers.6,9
Methods have been developed to determine the occurrence of irgarol and diuron in environmental waters. However, due to their wide variation on physical-chemical properties (e.g., salinity and pH), a special attention should be given to estuarine and marine waters, which might bias the analytical results. Thus, the influence of a pre-filtration step and salinity, as well as the performance of two different solid-phase extraction (SPE) adsorbents was evaluated. Since the presence of polar organic compounds, such as humic acids, and inorganic compounds may interfere in the analytical procedure, the matrix effect was also appraised.10 A liquid
chromatography with electrospray interface tandem mass spectrometry (LC-ESI-MS/MS) was used as detection method. The optimized and validated method was then applied to 21 water samples collected in the estuary of Patos Lagoon (southern Brazil).
Experimental
Study area
The Patos Lagoon is the world’s largest choked lagoon connected to the Atlantic Ocean by an 18 km long and 1-2 km wide channel between two 6 km long jetties draining waters from more than 200,000 km2 of urban and
rural areas from southern Brazil.11 It is highly important
for local residents due to its intense biological productivity that sustains significant fishing activity.12 The estuary has
minimal astronomical tidal influence and the flow of ocean waters into the Patos Lagoon depends on the combination of the wind effects and the volume of water from the river discharge. In periods of high river discharge, the influence of ocean waters is small, reducing the water residence time and expelling the dissolved and particulate materials to the nearby coastal area. During dry periods, seawater flows into the estuarine part of the lagoon.13
In the estuarine area is located one of the most important Brazilian harbor. The Rio Grande harbor complex comprises three harbors with about 6800 m of quay: the fishing harbor (old harbor) and the so-called new (public pier for ships) and super harbors (where large vessels load and unload grains, chemicals and containers). In this harbor complex, more than 27 million tons of cargo have been transported by 3200 vessels in 2010.14 The maritime
activities were further increased since new oil platform shipyards and maintenance companies have being recently installed in the area.
Reagents and chemicals
Analytical standards (purity > 98%) of irgarol and diuron were supplied by Sigma-Aldrich (Germany). High performance liquid chromatography (HPLC) grade methanol and acetonitrile were purchased from Mallinckrodt (Phillipsburg, NJ, USA). Ultrapure water was produced in the laboratory by the Direct-Q UV3®
(resistivity 18.2 MΩ cm) water purification system (Millipore, Bedford, MA, USA). Stock solutions of individual compounds were prepared in methanol at 1000 mg L–1 and stored at –10 °C. Working standard
Influence of sample filtration, salinity, SPE adsorbent type and matrix effect on the extraction processes and accuracy assessment
The influence of filtration (step before analytes pre-concentration), SPE adsorbent type (C18 and polymeric) and water salinity (0, 10, 15, 20 and 30) on the recovery of the compounds was performed at least, in triplicate, with 3 injections of each replicate into LC-ESI-MS/MS. Thus, the accuracy of the analytical method and the matrix effect were appraised in a range of concentrations (see below).
The influence of filtration on the recovery of the analytes was evaluated using synthetic (reconstituted) seawater (salinity 30) fortified with diuron and irgarol (final concentration of 10.0 µg L–1). Only the possible loss
of any analyte by adsorption onto filter was appraised. The filtration was done using a 47 mm diameter and 0.45 µm cellulose acetate filter (Sartorius, Germany), but just half of the samples were filtered.
Due to the low concentration levels of the compounds in water samples, SPE with two different types of adsorbents (C18 and polymeric) was used to extract and pre-concentrate the analytes. In addition, the recovery efficiency was checked using different salinities (0, 10, 15, 20 and 30) at concentration of 0.25 µg L–1 of diuron
and irgarol. The cartridges were conditioned by methanol (3 × 3 mL) followed by ultrapure water (3 × 3 mL). The samples (250 mL) were passed through the cartridge at a 10 mL min–1 flow rate. The cartridges were washed with
4 × 2.5 mL ultrapure water to remove salts, and air-dried for 10 min. The compounds were eluted by 3 × 2 mL methanol and the volume was reduced down to 1 mL under a gentle N2 stream.
15 Finally, the extracts (10 µL) were analyzed by
liquid chromatography.
Since no data of irgarol and diuron was available for the study area, the accuracy of the developed method was carried out at 3 different levels of fortification (4, 20 and 500 ng L–1). The analytes were spiked in water
with salinity adjusted to 10 (1000 mL to analyze 3 replicates of 250 mL), filtered, extracted in C18 cartridges (due to its better performance) and analyzed by LC-ESI-MS/MS. The percentage of recovery was done to determine the accuracy.16
Matrix effect was investigated by comparing the slopes in calibration solutions (0.001, 0.005, 0.010, 0.050, 0.100 and 0.500 mg L–1) prepared in seawater (matrix) and organic
solvent.17 Matrix-matched calibration solutions at different
concentrations were prepared using extracts of filtered seawater after SPE. Water collected on two different days (with salinity 22 and 25) were used for the study of the
matrix effect. The salinities were not adjusted to avoid any change in water composition.
Environmental water samples
Twenty-one sub-surface water samples were collected along the Patos Lagoon estuarine region (Figure 1). The sampling design covered areas under difference potential sources of those biocides including the three main harbors (G, I, K, L, M, Q, R, S, T and U) and Yacht club (F) of Rio Grande, areas under urban and industrial activities (E, H, J, N, O and P), the adjacent coastal area (A, B and C) and the region under the influence of upstream inputs of Patos Lagoon (D). Waters were sampled between March and April 2009 using pre-cleaned 2.5 L amber glass bottles. Once in the laboratory, samples (750 mL) were filtered and extracted by SPE (C18 cartridges). Cartridges were kept frozen (–10 oC) until further processing. Salinity was
measured using a conductivity meter Tyt CG583 (Schott Glass, Mainz, Germany).
LC-ESI-MS/MS
(50 × 3 mm, i.d. 3.5 µm) (Waters, Milford, MA, USA). The mobile phase was acetonitrile:water (52:48 v/v) with 0.1% formic acid at 0.4 mL min–1 flow rate. LC parameters
were optimized using a standard solution (1 mg L–1) at a
10 µL min–1 flow rate. The MS parameters were optimized
for the ionization of the compounds under study by using electrospray interface (ESI) in the positive mode (see Supplementary Information (SI) section).
Calibration of instrument was performed by using 6 different concentrations (0.001, 0.005, 0.010, 0.050, 0.100, 0.500 mg L–1) of each analyte with three replicates per
concentration. Linearity was checked by calculating the correlation coefficient (r2) of the linear regression equations
of the solutions. The solutions were injected (10 µL) three times (n = 3) and, in all cases, r2 > 0.99.
Limits of detection (LOD) were estimated from analyte solutions with concentrations that produce a signal/noise (S/N) ratio ≥ 3. LOD were 0.3 µg L–1 for diuron and
0.15 µg L–1 for irgarol. Limits of quantification (LOQ)
were calculated as 1.0 µg L–1 for diuron and 0.5 µg L–1 for
irgarol. The limit of quantification for the method (LOQm), which considered all steps of sample preparation (including a concentration factor of 250-fold), was determined as 4 ng L–1 for both compounds, whereas the limit of detection
for the method (LODm) was 1.3 ng L–1. These values are
comparable to those found in the literature for analysis of diuron and irgarol in water by LC-MS-MS.18
Statistical analyses
Normality was tested by Kolmogorov-Smirnov’s test and homoscedasticity by Levene’s test. Thus, ANOVA was used to evaluate the influence of salinity in SPE extraction with each type of cartridge. T-test was used to check the difference between recoveries with C18 and polymeric cartridges in each evaluated salinity.
Results and Discussion
Influence of filtration
Since the present study aimed to determine the concentration of diuron and irgarol dissolved in water, the filtration step with 0.45 mm filter is needed. However, any possible loss by means of interaction between the filtration media and the analyte (sorption processes) must be evaluated. Despite that, no significant influence was observed in the recovery levels for irgarol and diuron filtered by cellulose acetate membrane. The values of recovery (R%) and relative standard deviation (RSD %) were 114% (9%) without filtration and 109% (10%) with
filtration for diuron, while irgarol recovered 88% (9%) without filtration and 95% (2%) with filtration. In addition, both compounds were within the recommended levels for recovery (≥ 70 and ≤ 120%) and RSD (20%).19,20
In addition to the possible effect of sorption to filter, the suspended matter present in environmental samples could also be a factor of interference/loss. Water samples from environments such as Patos Lagoon estuary, where high amount of suspended matter (organic and inorganic) is normally found,21 usually require a filtration procedure
to avoid clogging up of the SPE cartridges. This might reduce SPE ability to retain the compounds of interest and also increase significantly the extraction time. Due to the complexity for testing the influence of suspended matter, since its amount and composition varies considerably in estuarine and coastal waters, this effect could not be thoroughly tested. However, future studies might consider evaluating its effect by appraising different ranges of concentration and composition within the specific site of study.
Influence of salinity and type of adsorbent on the extraction by SPE
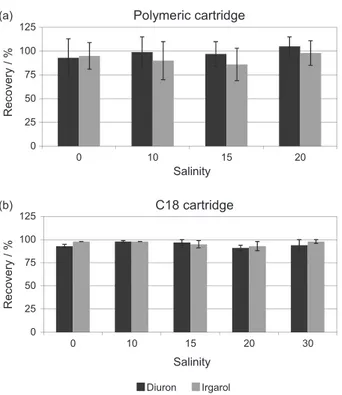
The recovery of diuron and irgarol fortified in water with different salinities (0, 10, 15, 20 and 30) and analyzed using C18 cartridges ranged from 91 to 98%, whereas RSD values were always below 7% (Figure 2). No significant difference was seen for the recoveries obtained using C18 under different salinities and analytes (p > 0.05). For the polymeric cartridge, the recovery ranged between 86 and 105% and RSD ≤ 20%. Similarly, no significant difference was seen for the recoveries obtained using polymeric cartridges under different salinities and analytes (p > 0.05). The recovery of polymeric cartridges was not determined for salinity 30 since cartridges of the same batch was no longer available for testing. In addition, no significant difference was seen for the recoveries of diuron and irgarol analyzed using either C18 or polymeric cartridges. Despite no appreciable effect of salinity on the recoveries of irgarol and diuron for both cartridges, C18 cartridges showed better analytical performance (< RSD) and, thus, were used to assess accuracy and matrix effect, and for the environmental analyses.
Accuracy
recovery ranged between 95 and 118% (RSD < 20%) (Figure 3). Thus, this method can be used to analyze diuron and irgarol in waters with this range of concentrations.
Matrix effect
Residue analyses of environmental samples could be significantly affected by matrix effect and this effect can vary according to the chemical of interest, the nature of matrix under study and the instrument used for the detection/quantification of analyte(s).22,23 The
present results showed that matrix effect varied between compounds and between the two tested seawaters (Table 1). Matrix effect was estimated as 11.2 and 3.7% for irgarol and 65.3 and 45.7% for diuron. Effects are
consider low when signal suppression/enhancement is ± 20%, medium for a range of ± 20% to ± 50% and high when higher than ± 50%.17 Hence, matrix effect can
be considered low for irgarol and medium to high for diuron. As expected, compounds containing more polar groups such as derivatives of urea (i.e., diuron) are more susceptible to the matrix effect.24
The difference seen for the tested seawaters indicate that characteristics other than the measured salinity, such as pH, composition and concentration of organic matter, alkalinity, etc., may also influence in the analytes ionization which resulted in the observed matrix effect. Because of the ease of measurement, salinity was used for a basic characterization of those two tested seawaters. Since the intensity of the matrix effect for a given compound is influenced by the nature of the sample and the type of co-extractives,24 it is
not possible to test matrix effect only once and consider it as constant for the whole set of samples.23 Thus, samples have
to be grouped according to common main characteristics and the matrix effect calculated for each group. Results must be corrected accordingly to the group they belong and applying the correction factor.24 In spite of that, concentrations of
diuron and irgarol for the environmental samples analyzed in the present work (see next item) were not corrected by the matrix effect since levels were very low and would not be affected by the correction factors.
Figure 2. Average recoveries (%) and RSD (%) of diuron and irgarol (0.25 µg L–1) fortified in water of different salinities (0, 10, 15, 20 and
30) extracted by polymeric cartridge (a) and C18 (b) and analyzed by LC-ESI-MS/MS.
Table 1. Matrix effect for irgarol and diuron in different waters
Salinity 25 Salinity 22
Curve in matrix Curve in solvent Curve in matrix Curve in solvent
Irgarol equation 74293.1x + 24.4696 83662x + 0.026 114152x + 63.99 118580x + 24.27
r2 0.9994 0.9988 0.9994 0.9991
Matrix effect / % 11.2 3.7
Diuron equation 19116.6x – 3.4 55020.1x + 1.782 29882.4x – 0.55 55020.1x + 1.782
r2 0.9985 0.9940 0.9987 0.9940
Matrix effect / % 65.3 45.7
Water samples analyses
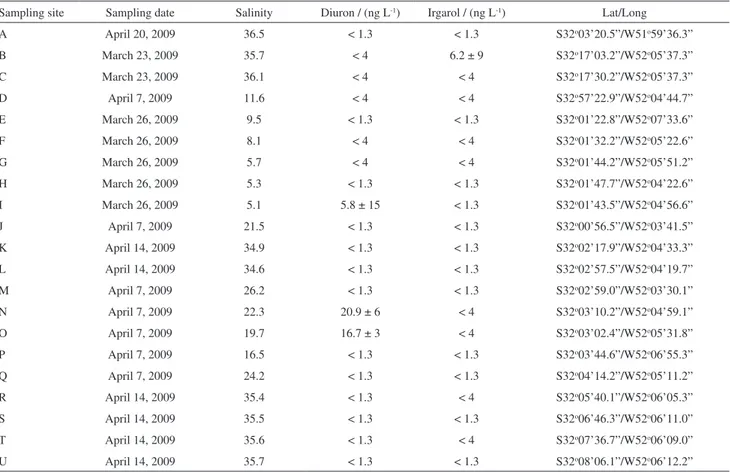
Levels of diuron and irgarol found in the 21 sites along the Patos Lagoon estuary under the influence of Rio Grande harbors are presented in Table 2. The concentration of diuron and irgarol ranged from < LODm (≤ 1.3) to 20.9 ng L–1 and < LODm (≤ 1.3) to 6.2 ng L–1,
respectively. Diuron and irgarol were detected in 8 and 9 out of 21 sites, respectively, whereas levels were above LOQm (> 4.0 ng L–1) in only 3 and 1 of those sites. However,
despite the small values the analytes were simultaneously present in 7 of those sites.
The Patos Lagoon estuary has some peculiarities, such as a small tidal range (0.47 m on average) and constant action of local and seasonal weather factors, especially meteorological tide (wind and rainfall effect), which affect the environmental and hydrological parameters of the region. There is a predominance of northerly winds (NE) between September and February and southerly winds (SO) in autumn and winter.25 The peaks of freshwater discharge
occur in winter and early spring, coinciding with the period of higher rainfall in the region.13 Despite that the estuary
was under the influence of variable regimes of flood and
ebb tide during the sampling period (beginning of autumn) (Supplementary Information S3).
The presence of irgarol and diuron in site D (northernmost site) indicate that the input of these compounds to the region may also occur from other upstream regions. Diuron (7-133 ng L–1) and irgarol (< 0.4 to 18 ng L–1)
were determined in the waters of the São Gonçalo channel, which flows into the Patos Lagoon right above site D.18 This
presence of diuron may be related to a wider use of this herbicide in different crops of the region because the period of high contamination coincided with the main period of agricultural activity.18 However, the occurrence of irgarol
cannot be straightforward related to this since it has never been registered for use on crops in Brazil. Although the sampling was done in a period that is not characterized by the predominance of river discharges, the salinity and current indicated a regime of ebb tide, which may help to dilute the antifouling biocides under investigation (Supplementary Information S3).
Among those sites directly related to the docking area (sites G, H, I, K, L, Q, R, S T and U), diuron was identified in 2 and irgarol in 3 of them. However, the highest values for diuron were found in site O (16.7 ng L–1) and
Table 2. Concentration (average ± RSD) of diuron and irgarol, salinity, coordinates and sampling date for the water samples from Patos Lagoon estuary
Sampling site Sampling date Salinity Diuron / (ng L-1) Irgarol / (ng L-1) Lat/Long
A April 20, 2009 36.5 < 1.3 < 1.3 S32o03’20.5”/W51o59’36.3”
B March 23, 2009 35.7 < 4 6.2 ± 9 S32o17’03.2”/W52o05’37.3”
C March 23, 2009 36.1 < 4 < 4 S32o17’30.2”/W52o05’37.3”
D April 7, 2009 11.6 < 4 < 4 S32o57’22.9”/W52o04’44.7”
E March 26, 2009 9.5 < 1.3 < 1.3 S32o01’22.8”/W52o07’33.6”
F March 26, 2009 8.1 < 4 < 4 S32o01’32.2”/W52o05’22.6”
G March 26, 2009 5.7 < 4 < 4 S32o01’44.2”/W52o05’51.2”
H March 26, 2009 5.3 < 1.3 < 1.3 S32o01’47.7”/W52o04’22.6”
I March 26, 2009 5.1 5.8 ± 15 < 1.3 S32o01’43.5”/W52o04’56.6”
J April 7, 2009 21.5 < 1.3 < 1.3 S32o00’56.5”/W52o03’41.5”
K April 14, 2009 34.9 < 1.3 < 1.3 S32o02’17.9”/W52o04’33.3”
L April 14, 2009 34.6 < 1.3 < 1.3 S32o02’57.5”/W52o04’19.7”
M April 7, 2009 26.2 < 1.3 < 1.3 S32o02’59.0”/W52o03’30.1”
N April 7, 2009 22.3 20.9 ± 6 < 4 S32o03’10.2”/W52o04’59.1”
O April 7, 2009 19.7 16.7 ± 3 < 4 S32o03’02.4”/W52o05’31.8”
P April 7, 2009 16.5 < 1.3 < 1.3 S32o03’44.6”/W52o06’55.3”
Q April 7, 2009 24.2 < 1.3 < 1.3 S32o04’14.2”/W52o05’11.2”
R April 14, 2009 35.4 < 1.3 < 4 S32o05’40.1”/W52o06’05.3”
S April 14, 2009 35.5 < 1.3 < 1.3 S32o06’46.3”/W52o06’11.0”
T April 14, 2009 35.6 < 1.3 < 4 S32o07’36.7”/W52o06’09.0”
U April 14, 2009 35.7 < 1.3 < 1.3 S32o08’06.1”/W52o06’12.2”
LODm = 1.3 ng L–1; LOQ
N (20.9 ng L–1), where traces of irgarol were also detected.
These sites are located in shallow areas (about 1 m deep) nearby the previous main municipal sewage outfall (N) and the refinery (O), which are sites with less influence of currents (lower dilution effect) in comparison to sites located along the harbor areas.
High concentrations of irgarol and diuron used to be found in commercial harbors26 and marinas, where small
recreational boats predominate.4 However, diuron and irgarol
was reasonably dispersed along the study area, showing reasonably low concentrations despite the direct influence of Rio Grande harbors. Low concentrations (< LOQm) were also observed at the Yacht Club (site F) due probably to the small number of boats and to the elevated cost of TBT-free paints in Brazil. Thus, it was difficult to determine the exact location of sources of contamination. This may be partly attributable to the very dynamic estuary with large variation between ebb and flow regimes. During the sampling period, for instance, salinity ranged between 5 and 36. In addition, it should be considered that hydrodynamic conditions of the estuary may cause dilution effects, either in periods of high fresh water discharge, in which there is decrease in the residence time of water and exportation of particulate and dissolved matter to adjacent coastal zone, or when the seawater dominates in the estuary.13
Furthermore, due to continual changes in environmental conditions and the physico-chemical characteristics of diuron and irgarol, these compounds can be distributed between the aqueous and sedimentary phases. Although diuron has higher solubility in water than irgarol (42 and 7 mg L–1, respectively), values of log K
oc are similar (2.4
for diuron and 2.7 for irgarol), indicating almost the same affinity for sediment organic matter.8,27 Despite that, these
moderately polar molecules have high mobility between the sediment and water. Furthermore, both compounds are
relatively persistent in sea water with half-lives estimated as 100 days for irgarol and between one month and one year for diuron, depending on the intensity of the sunlight.6,8,28
Thus, it can be seen that these compounds are spread throughout the sampling area, including those sites along the adjacent coast (sites B and C).
The concentrations of analytes found in B and C are probably due to the inputs from Patos Lagoon, since they were sampled in ebb period when the direction of coastal currents generated by winds were predominantly NE-SW.25
Diuron in this sampling sites does not necessarily mean that was used as antifouling biocide, since this compound is used for agricultural reasons and there are several washouts in this region.18 However, no evidence of irgarol being used
by farmers were found so far.
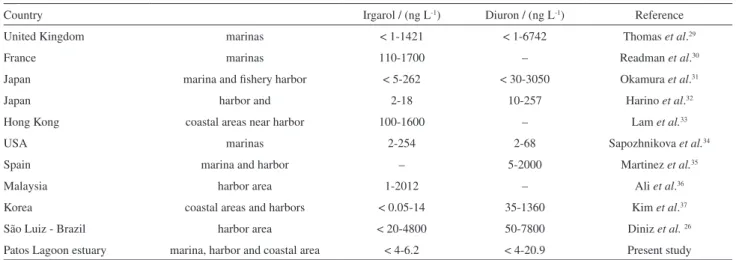
Despite the presence, the values of diuron and irgarol found in the present study (tens of ng L–1) are similar to
those found in non-contaminated areas around the world. A maximum permissible concentration of 24 ng L–1 for
irgarol in water has been proposed by the Dutch National Institute of Public Health and Environment.27 On contrary,
sites considered as contaminated showed concentrations of thousands of ng L–1 (Table 3).
It is important to consider that neither diuron nor irgarol were found in analyzes conducted with samples of the four major antifouling paints used on small shipyards in the region of Rio Grande. However, since diclofluanide and chlorothalonil were found in those four paints, it is likely that these thirdgeneration biocides are replacing irgarol and diuron in, at least, some antifouling paints used in Brazil. Despite the lack of regulations involving the new generation of booster biocides in Brazil,38 the detected
levels were lower than those capable of causing harm to aquatic species.9,39 The low concentrations found in the
present study, together with international restrictions of
Table 3. Levels of irgarol and diuron in seawater around the world
Country Irgarol / (ng L-1) Diuron / (ng L-1) Reference
United Kingdom marinas < 1-1421 < 1-6742 Thomas et al.29
France marinas 110-1700 – Readman et al.30
Japan marina and fishery harbor < 5-262 < 30-3050 Okamura et al.31
Japan harbor and 2-18 10-257 Harino et al.32
Hong Kong coastal areas near harbor 100-1600 – Lam et al.33
USA marinas 2-254 2-68 Sapozhnikova et al.34
Spain marina and harbor – 5-2000 Martinez et al.35
Malaysia harbor area 1-2012 – Ali et al.36
Korea coastal areas and harbors < 0.05-14 35-1360 Kim et al.37
São Luiz - Brazil harbor area < 20-4800 50-7800 Diniz et al.26
use and their absence in the four main antifouling paints used in the region, indicate that levels of diuron and irgarol are probably not relevant in the region under the influence of Rio Grande harbors. Their use is regulated and/or prohibited in many countries (e.g., UK and members of European Union) since 2000’s.6 Thus, the banning of
these compounds by vessels which operate in international harbors (and Rio Grande harbor has indeed an international profile receiving ships from all over the world) has resulting in a decreasing concentration of diuron and irgarol in harbors and marines in the UK.40 However, this cannot be
unequivocally accepted for the whole Brazilian coastal area based on a discrete sampling event and also because other international harbors such as Itaqui (Northern Brazilian coast)26 and major Korea harbors37 have recently shown
significant levels of irgarol e diuron in their waters. In addition, it cannot be ruled out that a decrease in oversight along international harbors could lead to a reuse of these compounds in antifouling paints.
Conclusion
An analytical method was optimized and validated for the analysis of diuron and irgarol by SPE and LC-ESI-MS/MS in estuarine and coastal waters. The method showed good accuracy (recoveries between 95 and 118%) and precision (RSD < 20%) determining irgarol and diuron in the range of ng L–1. There was no effect of filtration and salinity
on the recovery of compounds analyzed using C18 and polymeric cartridges, however C18 was chosen because showed better analytical performance (< RSD). Irgarol showed low matrix effect whereas diuron had medium to high matrix effect in seawater.
The waters in the Patos Lagoon estuary under the influence of Rio Grande harbor can be considered as low contaminated by diuron and irgarol (the highest concentrations were 21 and 6 ng L–1, respectively). These
levels were below of those capable of causing effects on tested species. Even considering the dynamics of the estuarine waters in the region and its effect on the dilution of antifouling biocides, no direct sources were identified. The low concentrations can be attributed to absence of diuron and irgarol in the composition of antifouling paints used by small shipyards of the region and the fact that many ships are coming from countries where the use of these compounds has been restricted.
Supplementary Information
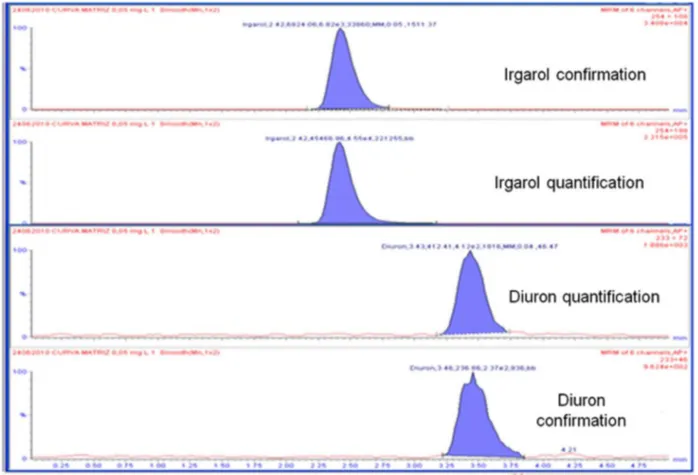
Supplementary data of interface conditions of the precursor ions (Table S1), chromatograms of optimized
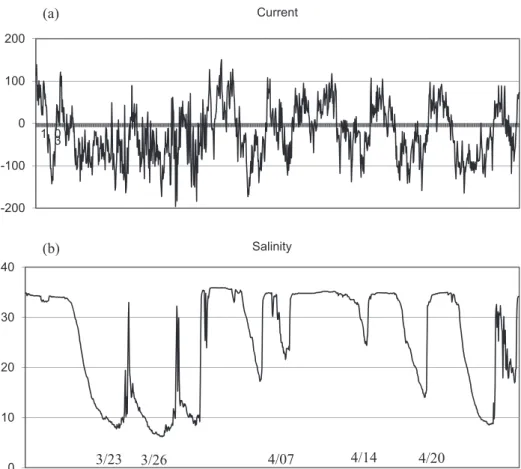
fragmentation with the ions used for irgarol and diuron quantification and confirmation (Figure S1) and intensity and direction of current and salinity obtained every hour between 03/16/09 and 04/26/09 in the channel that connects the estuary to ocean (Figure S2) are available at http://jbcs.sbq.org.br as PDF files.
Acknowledgments
The Brazilian National Research Council sponsored G. Fillmann (CNPq PQ No. 314335/2009-9). The authors thank Dr Italo B. de Castro for his valuable help during this study.
References
1. Yebra, D. M.; Kiil, S.; Dam-Johansen, K.; Prog. Org. Coat. 2004, 50, 75.
2. Readman, J.W. In: The Handbook of Environmental Chemistry Part 5; Wangersky, P. J., ed. Springer, 2006, ch.1.
3. Castro, I.; Westphal, E.; Fillmann, G.; Quim. Nova2011, 34, 1021.
4. Thomas, K. V.; McHugh, M.; Waldock, M.; Sci. Total Environ.
2002, 293, 117.
5. Boxall, A. B. A.; Comber, S. D.; Conrad, A. U.; Howcroft, J.; Zaman, N.; Mar. Pollut. Bull.2000, 40, 898.
6. Konstantinou, I. K.; Albanis, T. A.; Environ. Int.2004, 30, 235. 7. Thomas, K. V.; Langford, K. H. In: Ecotoxicology of Antifouling Biocides; Arai, T.; Harino, H.; Ohji, M.; Langston, W. J., eds.;
Springer: New York, 2009, ch. 18.
8. Giacomazzi, S.; Cochet, N.; Chemosphere2004, 56, 1021. 9. Mochida, K.; Fujii, K. In: Ecotoxicology of Antifouling Biocides;
Arai, T.; Harino, H.; Ohji, M.; Langston, W. J., eds.; Springer: New York, 2009, ch. 21.
10. Kowal, S.; Balsaa, P.; Werres, F.; Schmidt, T.; Anal. Bioanal. Chem.2009, 395, 1787.
11. Kjerfve, B. In: Estuarine Variability; Wolf, D. A., ed.; Academic Press: New York, 1986, pp. 63.
12. Vieira, J. P.; Garcia, A. M.; Grimm, A. M.; Braz. Arch. Biol. Technol. 2008,51, 433.
13. Fernandes, E.; Dyer, K. R.; Möller, O. O.; J. Coastal Res.2005,
21, 759.
14. h t t p : / / w w w. p o r t o r i o g r a n d e . c o m . b r / s i t e / d ow n l o a d . php?arq=arquivos/arquivo_600.pdf, accessed on May, 2014; http://www.portoriogrande.com.br/site/download. php?arq=arquivos/arquivo_609.pdf, accessed on May, 2014.
15. Gatidou, G.; Kotrikla, A.; Thomaidis, N.; Lekkas, T. D.; Anal. Chim. Acta2004, 505, 153.
17. Economou, A.; Botitsi, H.; Antoniou, S.; Tsipi, D.;
J. Chromatogr. A2009, 1216, 5856.
18. Demoliner, A.; Caldas, S.; Costa, F.; Gonçalves, F.; Clementin, R.; Milani, M.; Primel, E.; J.Braz. Chem. Soc. 2010,21, 1424.
19. Ribani, M.; Bottoli, C. B. G.; Collins, C. H.; Jardim, I. C. S. F.; Melo, L. F. C.; Quim. Nova 2004, 27, 771.
20. Caldas, S.; Demoliner, A.; Costa, F.; D’Oca, M.; Primel, E.;
J.Braz. Chem. Soc.2010, 21, 642.
21. Calliari, L.; Winterwerp, J.; Fernandes, E.; Cuchiara, D.; Vinzon, S.; Sperle, M.; Holland, K.; Cont. Shelf Res. 2009, 29, 515.
22. Kruve, A.; Künnapas, A.; Herodes, K.; Leito, I.; J. Chromatogr. A 2008, 1187, 58.
23. Radisic, M.; Grujic, S.; Vasiljevic, T.; Lausevic, M.; Food Chem. 2009, 113, 712.
24. Pinho, G. P.; Neves, A. A.; Queiroz, M. E. L. R.; Silvério, F. O.;
Quim. Nova2009, 32, 987.
25. Calliari, L. J.; Fachin, S.; Pesquisas (Univ. Fed. Rio Grande Sul, Inst. Geocienc.) 1993, 20, 57.
26. Diniz, L. R.; Jesus, M. S.; Dominguez, L. E.; Fillmann, G.; Vieira, E. M.; Franco, T. S.; J. Braz. Chem. Soc. 2014, 25, 380. 27. van Wezel, A.; van Vlaardingen, P.; Aquat. Toxicol.2004, 66,
427.
28. Okamura, H.; Chemosphere2002, 48, 43.
29. Thomas, K. V.; Fileman, T. W.; Readman, J. W.; Waldock, M. J.;
Mar. Pollut. Bull.2001, 42, 677.
30. Readman, J. W.; Wee-Knong, L. L.; Grondin, D.; Barocci, J.; Vileneuve, L. P.; Mee, L. D.; Environ. Sci. Technol.1993, 27, 1940.
31. Okamura, H.; Aoyama, I.; Ono, Y.; Nishida, T.; Mar. Pollut. Bull.2003, 47, 59.
32. Eguchi, S.; Harino, H.; Yamamoto, Y.; Arch. Environ. Contam. Toxicol.2010, 58, 684.
33. Lam, K.; Cai, Z.; Wai, H.; Tsang, V. W.; Lam, M. H.; Cheung, R. Y.; Yu, H.; Lam, P. K.; Environ. Pollut.2005, 136, 221. 34. Sapozhnikova, Y.; Wirth, E.; Schiff, K.; Fulton, M.; Mar. Pollut.
Bull.2013, 69, 189.
35. Martinez, K.; Ferrer, I.; Barcelo, D.; J. Chromatogr. A2000,
879, 27.
36. Ali, H. R.; Arifin, M. M.; Sheikh, M. A.; Shazili, N. A.; Bachok, Z.; Mar. Pollut. Bull.2013, 70, 253.
37. Kim, N. S.; Shim, W. J.; Yim, U. H.; Hong, S. H.; Ha, S. Y.; Han, G. M.; Shin, K.; Mar. Pollut. Bull. 2014, 78, 201. 38. http://www.dpc.mar.mil.br/normam/N23/N_23.htm, accessed
in May 2014.
39. Perina, F.; Abessa, D.; Pinho, G.; Fillmann, G.; Ecotoxicology 2011, 20, 1870.
40. Gatidou, G.; Thomaidis, N.; Zhou, J.; Environ. Int.2007, 33, 70.
Submitted on: January 24, 2014
Supplementary Information
Printed in Brazil - ©2014 Sociedade Brasileira de Química0103 - 5053 $6.00+0.00S
I
*e-mail: [email protected]
The Influence of Salinity and Matrix Effect in the Determination of Antifouling
Biocides in Estuarine Waters of Patos Lagoon (Southern Brazil)
Luís A. E. Dominguez,a Sergiane S. Caldas,b Ednei G. Primelb and Gilberto Fillmann*,a
aInstituto de Oceanografia, Programa de Pós-Graduação em Oceanografia Química, Física e Geológica and bEscola de Química e Alimentos, Programa de Pós-Graduação em
Química Tecnológica e Ambiental, Universidade Federal do Rio Grande-FURG, Av. Itália, km 8 s/n, 96203-900 Rio Grande-RS, Brazil
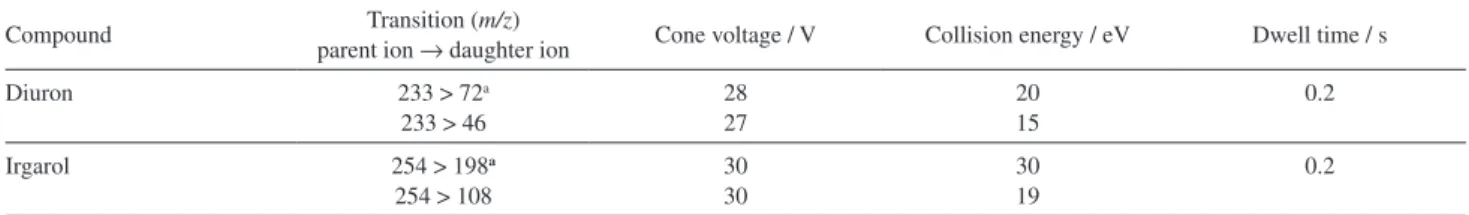
Table S1. LC-ESI-MS/MS conditions of fragmentation
Compound Transition (m/z)
parent ion → daughter ion Cone voltage / V Collision energy / eV Dwell time / s
Diuron 233 > 72a
233 > 46
28 27
20 15
0.2
Irgarol 254 > 198a
254 > 108
30 30
30 19
0.2
aTransition used for quantification.
Typical interface conditions of the precursor ions was: capillary voltage 4 kV, nebulizer gas flow 550 L h–1,
desolvation flow gas 50 L h–1, source block temperature
100 °C and desolvation temperature 350 °C. Nitrogen was
Figure S2. Intensity (cm s-1) and direction (positive - flooding; negative - ebb) of current (a) and salinity (b) obtained every hour between 03/16 and