Work Project, presented as a part of the requirements for the Award of a Master Degree in Management from the Nova School of Business and Economics
Financial Reporting about Investment Properties:
Evidence from Portuguese Listed Companies
Catarina Sofia Correia Araújo, No. 974
A Project carried out for the achievement of a Major in Accounting and Financial Reporting, under the supervision of Professor Leonor Ferreira.
2 Title:
Financial Reporting about Investment Properties: Evidence from Portuguese Listed Companies
Abstract
Companies are increasing their investment properties; however they are not disclosing the information that is required by the IAS 40. It regulates the financial reporting of those assets, it defines the scope and the models that companies may use when measuring their investments properties. This research provides insights to understand which model the companies choose (fair value or the cost model) and why. The findings suggest that the Portuguese listed companies do not provide satisfying information about investment properties, as increases the financial leverage or the age of a company, it is more likely to adopt the fair value model.
3 1. Introduction
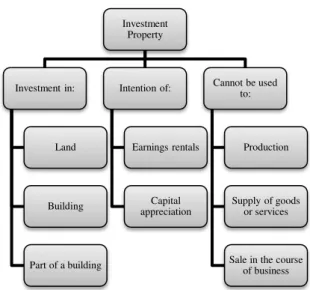
Every day, the world is becoming more global. Somehow, everything and everyone is connected in a more intensive way. This fact reached the markets to all the companies disclose their financial information according to the same standards. In 2002, the European Union adopted the International Accounting Standard / International Financial Reporting Standards (IAS/IFRS)1. All the European listed companies should have implemented until 2005 the (IAS/IFRS). In the set of standards that the EU countries had to adopt is IAS 40 Investment Properties. This standard has as main subject investment properties2, that is “an investment in land or a building, part of a building, or both, that are held by the owner with the intention of
earning rentals or capital appreciation” (Epstein & Jermakowicz, 2010).
This standard allows for accounting choice regarding recognition of this type of non-current asset.The purpose of this research is to get insight into financial reporting about investment properties, how companies are recognising and measuring these type of assets, what type of information is being disclosed about them, and understand the reasons that motivate the Portuguese companies to choose the fair value or the cost model to measure the investment properties. This study is based on a sample of all the companies that were listed in the Euronext Lisbon on December 31th, 2011, which and present investment properties in the statement of financial position on that date3.
1
IAS were issued by the International Accounting Standards Committee (IASC) and were released from 1973 until to 2001. In this year the International Accounting Standards Board (IASB) superseded the IASC and adopted the IAS and the Standard Interpretation Committee (SIC) (these standards are the interpretations of the IAS). The IFRS are the new standards issued by the IASB.
2Usually, investment properties in US are known as “real estate property”. The 'real' in 'real estate' means relating to a thing. According to the Oxford Dictionary of Law (4th edition), New York: Oxford University Press, 1997) ,in British usage, "real property", often shortened to just "property", and generally refers to land and fixtures, while the term "real estate" is used “mostly in the context of probate law, and means all interests in land held by a deceased person at death, excluding interests in money arising under a trust for sale of or charged on land”
3
4
Despite of the IAS 40 be a mandatory standard to all public company, they are not disclosing all the information required in the standard and in some cases they are disclosing the required information but not in the right way. The principal issues that this Work Project it is to analyses if the companies are adopting the IAS 40 in full and which variables can lead the choice of the model (cost model or fair value model).
This research provides evidence on the current financial reporting practices about investment properties by Portuguese companies listed in the Euronext Lisbon.
This work project proceeds as follows. After the introduction, Section 2 introduces the concept investment properties, key concepts that will be used in the Work Project and briefly describes the regulatory framework which applies to the consolidated financial reports of listed companies, that is IAS 40. Section 3 presents the literature review about investment properties. Section 4 contains the description of research questions. Section 5 describes the methodology and sample. Session 6 shows the results and its interpretations, and recommendation. Finally, it comes the conclusion, limitations and suggestions for future research in Section 7.
2. Conceptual and Regulatory Framework
5
To measure the investment properties according to IAS 40, companies can choose either the Cost Model or the Fair Value Model. When adopting the former, should use the Cost Model in accordance with IAS 16, which states that the cost is “the amount of cash or cash equivalents paid or fair value of other consideration given to acquire an asset at the time of its acquisition or
construction” (IAS 40, 2009). Regarding the latter, the fair value is “the amount for which an
asset could be exchanged between knowledgeable, willing parties in an arm’s length
transaction” (IAS 40, 2009). The carrying amount is “the amount at which an asset is presented
in the statement of financial position” (Epstein & Jermakowicz, 2010). The carrying amount is
estimated in formula 1.
[1]
The initial acquisition cost is modified, year after year. When following the cost model, the carrying amount is subject to depreciation year after year. Depreciation is the “process that
Investment Property
Investment in:
Land
Building
Part of a building
Intention of:
Earnings rentals
Capital appreciation
Cannot be used to:
Production
Supply of goods or services
Sale in the course of business
6
reduces the value of an asset as a result of wear and tear, or obsolescence, i.e., is a method of
measuring the “consumption” of the value of long-term assets” (Epstein & Jermakowicz, 2010).
There are various possible methods to estimate annual depreciation, such as straight-line, declining balance, and sum-of –the digits. The formula to calculate the straight-line method is presented in formula 2.
[2]
The cost is the purchasing price or the revalued amount if the company is following a revaluation policy, and the estimated economic life or useful life of the asset is usually defined in the accounting rules. (Elliott & Elliott, 2009)
Impairment is normally a loss to the company. It is “the excess of the carrying amount of an asset or a cash-generating unit over its recoverable amount” (Epstein & Jermakowicz, 2010). Regularly is due to “problems of measurement, recognition and presentation of material
reductions in value of non-current assets” (Elliott & Elliott, 2009).
The risk of the financial leverage can be measure by the Debt to Equiy Ratio.
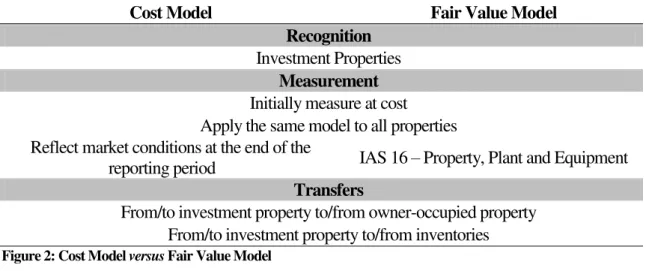
IAS 40 is the specific standard which regulates the reporting of investment properties. It covers the four key points: recognition, measurement, transfers, disposals and disclosure (IAS 40, 2009). The figure 2 resumes the previous three issues.
Figure 2: Cost Model versus Fair Value Model
Cost Model Fair Value Model
Recognition
Investment Properties
Measurement
Initially measure at cost Apply the same model to all properties Reflect market conditions at the end of the
reporting period IAS 16 – Property, Plant and Equipment
Transfers
7
The recognition is about understanding if the asset respects the definition of IP and if the cost could be measured reliably by the chosen model (IAS 40, 2009).
The measurement in the first time is always done at cost. Subsequently, the item can be measured either at cost or using the fair value model. The fair value model should reflect the market conditions at the end of the reporting period. It is not required, but it is recommended that an entity should have an independent appraiser to recognize the fair value (IAS 40, 2009).
The cost model should respect the IAS 16, which concerns Property, Plant and Equipment. In each year the property will be depreciated (unless if it is a land) using the straight-line method. The carrying amount which is presented in the statement of the financial position is estimated by subtracting the accumulated depreciation and the accumulated impairment losses to the cost. The companies should apply the same model to all properties. This allows a better comparison and respects the consistency, which are two desirable characteristics of the financial statements according to the IASB conceptual framework). However there are exceptions to this general rule. Sometimes, a company adopts the fair value model but cannot determine it reliably. In these cases the company can use the cost model (IAS 40, 2009).
A company may change from the cost model to the fair value model. However, normally they do not change from fair value to the cost model because the information will be less reliable and comparability may be affected (IAS 40, 2009).
IAS 40 also includes rules that should apply to transfers from investment property to owner-occupied property, from investment property to inventories (in order to sale it) and vice-versa (IAS 40, 2009).
8
The information disclosed under the notes to the financial statements should contribute to increase the usefulness of financial reporting and thus it is important that companies disclose all accounting choices adopted for the reporting period (in the income statement) or date of reporting (in the balance sheet) concerning investment properties, namely the model of valuation, the depreciation rate in use, the useful life of the investment property, the model of valuation, and assumptions for fair value. Figure 3 lists the set of disclosures common to both models of valuation and the disclosures that are specific for each model.
Cost Model Fair Value Model
Disclosures
Model adopted
Methods and assumptions applied to determine the fair value Rental income
Direct operating expenses Cumulative change in fair value
Fair value Carrying amount
Depreciation method Additions
Be Useful lives or depreciation rate Disposals
Gross carrying amount Net gains or losses
Accumulated depreciation Annual Depreciation
Figure 3: Disclosures about investment properties: Cost Model versus Fair Value Model
9
Concerning the fair value model the company should disclose the carrying amount, the additions done to their portfolio, the disposals and the net gains or losses (IAS 40, 2009).
3. Literature Review
The literature about investment properties is twofold. On one side, there are empirical papers about the actual practices of financial reporting of investment properties, most of them focusing in issues of measurement, namely the discussion between differences, pros and cons of cost model versus fair value model, and associations between the use of the measurement basis and some other variables. On the other side, there are normative studies stating what companies should do when reporting investment properties, or giving guidance to preparers of the accounting information by explaining and providing interpretations of the accounting standards which should apply, specially IAS 40. The latter are usually published in technical and professional journals, issued by the accountancy profession bodies, while the former are more often published in scientific journals, and subject to peer review.
These papers highlight the discussion between cost model and fair value model, stating pros and cons, as well as consequences of them regarding the qualitative characteristics of the financial reporting such as reliability, relevance, conservatism, and comparability. According to Kieso and Weygandt (1997), conservatism is “when in doubt choose the solution that will be least likely to overstate assets and income”. This has implications in the balance sheet and in the
10
After doing the analysis of the previous studies about conservatism in accounting, I can associate the choice of the cost model to a conservative option and the fair value model to a non-conservative option ((Demaria & Dufour, 2007).
Despite the fair value model is a relevant measurement basis, some concerns about reliability and comparability remains (Ernst & Young, 2005). Concerning reliability, and according to previous research by Ernst & Young (2005)“fair value measures can be considered reliable only if the variability in the range of reasonable fair value estimates is not significant”.
Regarding comparability, fair value has to be consistent over several methods. However, sometimes it is difficult to find a similar investment property (asset) in the market to make a comparison. In this case other techniques should be adopted, and the fair value will be estimated using a valuation model and doing assumption about the market price of the asset and its evolution. Regarding the definition of fair value4, the fair value should be estimated in a real market and not in simulated market (Ernst & Young, 2005).
Papers in another stream of research focus in measurement models and analyze the causes and consequences of this valuation accounting choice. Some studies suggest a positive association between the size of the company and the use of the fair value model as a measurement basis of assets (Basu, 2001). Among them, a US study shows that small companies are more risky than large companies and justify that argument: small companies’
returns are more unpredictable, and this motivates them to adopt a more conservative accounting to avoid the volatility associated with them (RYAN and ZAROWIN, 2001).
Previous literature also suggests that a positive relation exists between financial leverage and fair value model. Watts & Zimmerman (1990) and Fields et al. (2001) suggest that the choice of accounting methods is related with the avoidance of covenant violations. The managers will
11
have incentives to increase the income as the debt/equity ratio also increases. Additionally, the management teams select accounting measures that will maximize their own compensation (Watts & Zimmerman, 1990). These two facts will have a positive relation with the choice of the fair value.
According to Basu (2001), the financial sector seems to be more likely to adopt the ‘non
-conservative’ accounting practices than other industries. His research (Basu, 2001), conducted
before the recent financial crisis, suggests that financial companies are more likely to adopt the fair value model due to the fact that they need to improve each year their results to be more competitive year after year (Conceição, 2009).
12
To the best of our knowledge, still there are not studies in Portugal about financial reporting of investment properties. Thus, this Work Project aims at providing evidence about financial reporting of investment properties by Portuguese listed companies, namely knowing which models of valuation are being used, by them, which disclosures are made about this specific type of asset, what motivates the accounting choice between the cost and the fair value model, and understanding the factors underlying it.
4. Research Questions
This section introduces the research questions to be answered by this project. The purpose of this research is to provide evidence on accounting practices and get insight into financial reporting about investment properties in Portugal, namely provide evidence on reporting practices by Portuguese companies, to obtain evidence about valuation methods adopted for investment properties, and what disclosures related to them are made, and understand the factors that motivate the accounting choices (fair value model versus cost model) about the measurement basis of investment properties and the decision to disclose information about this type of assets., To accomplish this purpose seven research questions (RQ) are addressed.
13
models. The accounting regulation about investment properties (IAS 40) contains an option regarding the measurement basis. The first RQ is about accounting choice on measurement issues.
RQ1: Which measurement basis for investment properties valuation do Portuguese listed companies adopt?
The accounting regulation (IAS 40) lists the obligatory disclosures about investment properties, set as a minimum, being the companies free to disclose additional items. The second RQ is about disclosures.
RQ2: Are Portuguese listed companies disclosing the information about investment properties required by the IAS 40?
The following RQ will contribute to a deeper understanding on investment properties disclosures and accounting choice. By combining those variables, and develop some relationships between them. Helping to better know and understand the reporting of investment properties by Portuguese listed companies. Regarding bivariate analysis, correlations5 between variables were computed. to understand if the variables analysed are linked. The third RQ is about the effects of accounting choice:
RQ3: Is the model of valuation for investment properties adopted by Portuguese listed companies associated with changes in profit?
To the RQ4 the calculations are with the variables economic sector and the model selected. In the RQ5 the study considers that the value of the assets is a good measure to indicate the size of the company. In the next RQ is mandatory to calculate the financial leverage and to understand if there is a relation between that variable and the choice of the model. The last RQ is about to understand if there is a positive relation between the choice of the fair value and the age of the company.
5
Correlation Coefficient between two variables (X, Y), , cov (X, Y) is the covariance between X
14
RQ4: Is there a relation between the sector where the company operates and the valuation model chosen for investment properties?
RQ5: Is there a relation between size of the company and the valuation model chosen for investment properties?
RQ6: Is there a relation between the financial leverage (debt/equity) and the valuation model chosen for investment properties?
RQ7: Is there a relation between the age of the company and the valuation model chosen for investment properties?
4. Methodology and Data
This section describes the methodological issues and the procedures used to collect data for the research.
The initial sample for this research is composed by the companies listed in the Euronext Lisbon on December 31th, 2011. The fact that these companies are obliged to prepare their consolidated financial statements according to the IAS / IFRS, and so their consolidated financial reports adopt IAS 40 and report investment properties accordingly, together with the availability, easy access, and credibility of data6 were the criteria used to select the initial sample.
Listed companies must be comparable among them. It is not possible different fiscal years and all have to follow IAS 40. Out of the 51 companies that were listed in the Euronext Lisbon on December 31st, 2011, three adopted a twelve months reporting period which coincides with their operation cycle, ending on June 30th and were excluded from the final sample for this reason7. The remaining 51 companies adopt the same reporting period, which coincides with the fiscal year (begins in January 1st and finishes in December 31st).
6
Credibility is justified by the fact that that the financial reports are subject to more severe auditing (two audit reports, one by the official auditor and a second one by the external audit).
7
15
The initial sample with 48 companies that were listed in the Euronext Lisbon at 31th December 2011. Data was retrieved from the companies websites and was checked for validity purposes with the same information available in the Stock Market Authority (Comissão do Mercado de Valores Mobiliários, CMVM) website. The data analyzed was taken from the annual financial reports of companies listed in the Euronext Lisbon, for the periods 2010 and 2011, these periods being the most recent ones for which data is publicly available.
This study analyzes the consolidated financial statements. However, two companies do not publish investment properties in their consolidated financial statements, but only in their individual financial statements8. Exceptionally, the research will follow in the individual financial statements.
A previous question addressed is exploratory, as follows: Does the company have investment properties among its assets? Twenty four companies do not have investment properties and so were withdrawn from the sample. The final sample will consists of 249 companies (Appendix 1). One company recognized investment in land and building, held with the intention of
earnings rentals or for capital appreciation in the item 'Other Investments’10
and not in ‘Investment Properties’ as the remaining companies do.
The final sample includes 24 companies which will be searched for answers in the annual reports. Seventeen Companies (70.8%) in the sample are holding companies (Sociedade Gestora de Participações Sociais, SGPS), while only seven (29.2%) are not (Appendix 5).
8
The two companies which only report individual accounts are EDP - Energias de Portugal S.A. and Inapa - Investimentos Participações e Gestão, S.A.
9 This number includes the company that recognizes these non-current assets as ‘Other Investments’.
16
All the 24 companies reported this type of non-current assets in year 2011. However, out of the 24 companies in the final sample, three do not present investment properties in 201011 (Appendix 2).
First of all, in order to understand the importance of investment properties in each company the total amount of this item in euros and relative to total assets (common size) (Investment properties / Total assets) by Portuguese listed companies in 2010 and in 2011. In 2010, only six (28.6%) companies have more than 5% of its total assets invested in investment properties, the same number of companies with less than 1% and seven companies between 1% and 5%. However, three companies do not present investment properties in 2010 and in 2011. Present less than 1% of their assets in investment properties in 2011. The companies that already presented investment properties in 2010 do not show a material change in ratio investment properties to total assets (Appendix 2). So, no one move from the group ‘Less than 1%’, ‘Between 1% and 5%’ or ‘More that 5%’.
The results show that only three (12.5%) companies are not audited by one of ‘The Big
Four’, companies. PwC and Deloitte are the companies responsible for auditing most of the
companies in the sample, with one third and one quarter of the total number of companies, respectively. Thus, this result shows concentration (Appendix 5).
11
17
Companies in the sample are facing changes in their investment properties. The changes in the investment properties can be due to transfers, additions or disposals (Appendix 3). However, it is just possible to analyse these variables in some companies that have only a descriptive note. The data about the three variables indicate the same direction; the companies are increasing their investment properties. Concerning the transfers, 35% was from inventories or owner-occupied property to investment properties and 25% was from investment properties to inventories or owner-occupied property. Still, 40% of the companies reveal no transfers in the year of 2011. The figures about additions also disclose that 55% of the companies are doing additions to their portfolio of investment properties and just 35% of the companies did disposals.
7. Results
This section contains the results in order to answer to the research questions. Doing this analysis it is possible to recognize the reasons that lead the Portuguese companies to choose the fair value or the cost model, and if disclosures are appropriate and not missing.
Measurement basis (RQ1)
18
that 15 (62.5%) of the Portuguese listed companies which have investment properties adopt the cost model while 9 (37.5%) recognize this type of asset at fair value model.
From 2010 to 2011, none of the companies changed from one model of valuation to the other, thus respecting consistency in reporting and allowing for comparability, which is a desirable characteristic of financial reporting. Thus, changes in the amounts of investment value presented in the balance sheet are due to depreciation (this only for cases using the cost model), impairments, business combination, exchange rate effect, additions, disposals, transfers or write-offs or changes in fair value (this only for cases using the fair value model).
Disclosure (RQ2)
In section 2, there is a description of the main disclosures about investment properties required by IAS 40. Disclosures include items such has accounting policies, fair value disclosure, type of the investment, direct costs and rentals. This information is disclosed in the descriptive notes, most of the companies – 20 (83.3%) present a descriptive note, with the remaining four companies (16.7%) not presenting (Appendix 2). This note helps readers of the annual report to know the reasons why investment properties increases or decreases during the period.
19
disclose the additions, disposals, amount of impairments, differences in the exchange rate, and transfers to and from inventories and owner-occupied property (Appendix 3) (IAS 40, 2009).
Most of the companies disclose what type of properties are the investment properties, whether it is land, building or both. Only two companies do not disclose this type of information (Appendix 4). Thus comparability is affected.
Table 1: Type of Investment Properties
Land 3 12.5%
Buildings 4 16.7%
Land and Buildings 15 62.5%
NA 2 8.3%
Total 24 100.0%
Bear in mind, that the companies just release the mandatory information and nothing more. And in some cases, required information is missing. That is the case of 87.5% companies that not disclose the direct costs and 70.8% that not release the rentals (Appendix 4).
Table 2: Disclosure of Direct Costs and Rentals
Yes No
Direct Costs 3 12.5% 21 87.5%
Rentals 7 29.2% 17 70.8%
Regarding the narrative in the notes, one finds that in some cases the company just does copy past from the standards. This is the case, for example EDP - Energias de Portugal S.A. or Martifer, SGPS, S.A.
Change in Profit (RQ3)
The RQ3 is related with a significant change in profit (Appendix 6) due to the choice of the model. However, since 28.6% of the companies that adopt the cost model releases the fair value model the sample is very restricted12, being difficult to draw conclusions. Nevertheless, for all the companies that disclose the fair value, it is higher than the cost value. It is remarkable that
12
20
each company that disclose the fair value shows an increase in investment properties higher than 10%, even up to 180%. Yet, just one company has a change in the assets higher than 1%13. This is justified by the fact that the investment properties have a high depreciation rate14. The difference in the net income will depend of the tax rate15 applied to each company. If a company chooses to use the fair value model instead of the cost model the change16 in the net income will increase by the amount of depreciation associated to that year, however it is necessary to withdraw the amount of tax related with the depreciation. The amount of profit will also increase. When an asset is revaluated the amount that exceeds the carrying amount will increase the investment properties and the equity, this will increase the financial leverage ratio and reveal a better situation of the company. Regarding this, it is possible to conclude that the companies will benefit if they adopt the fair value model. These reveal an opportunism of the companies, because the fair value is always higher than the cost value, the same conclusion is stated in the Muller et al (2008).
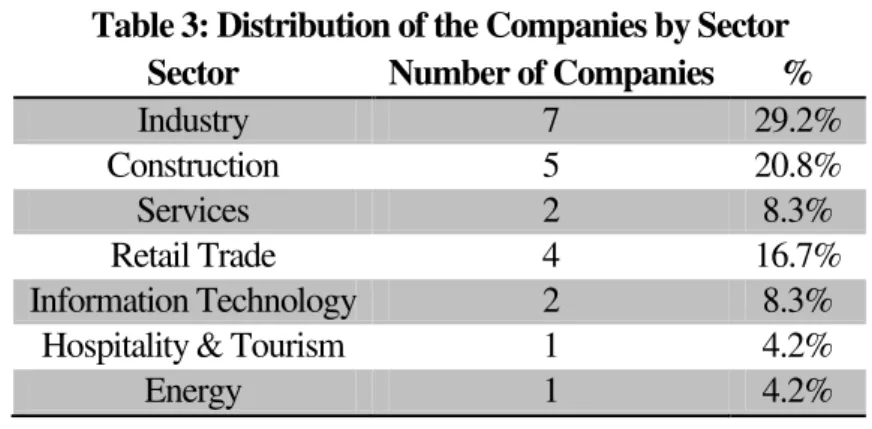
Economic Sector (RQ4)
The majority of the companies in the sample operate in the sectors of the industry (29.2%) and construction (20.8%) (Appendix 5).
Table 3: Distribution of the Companies by Sector
Sector Number of Companies %
Industry 7 29.2%
Construction 5 20.8%
Services 2 8.3%
Retail Trade 4 16.7%
Information Technology 2 8.3%
Hospitality & Tourism 1 4.2%
Energy 1 4.2%
13The company that presents the higher change in the Asset’s value is Toyo
ta Caetano Portugal, S.A with a change of 11.8%.
14
This company presents an average depreciation rate of 3.75% (the highest rate of the set of companies that disclose the fair value).
15
The average tax rate is 25%. 16
21
Financials 2 8.3%
Total 24 100.0%
The RQ4 is related with the choice of the model be or not independent of the economic sector. Since the correlation coefficient between both variables be 0.041, is possible to say that the variables are independent. This finding differs from the conclusion of Basu (2001). Still according to the same research by Basu, the companies operating in the financial sector are the more likely to choose the fair value. In this Work Project only two banks17 were included in the sample, and each one chooses a different model. Due to this, it is impossible to draw a conclusion regarding the financial sector.
Size of the Company (RQ5)
The correlation between the size of the company (Appendix 2) and the fair value model is near zero (ρ = -0.099). With this degree of correlation it is not possible to say that as the size of the company increases also increases the likelihood of they choose the fair value model. Is possible to conclude that the variables are independent, however is necessary to bear in mind the fact that the sample is small. The studies developed by Basu (2001) and RYAN and ZAROWIN (2001) indicate that a positive relation exists between these two variables.
Financial Leverage (RQ6)
The results show a slight correlation (ρ = 0.204) between financial leverage ratio and the fair value model (Appendix 6). It is possible to say that companies with a higher financial leverage ratio are more willing to choose the fair value model. This is related with the RQ3 in the fact that when a company chooses the fair value model the financial leverage ratio decrease in contrast with the same situation except the investment properties is disclosed under the cost
17
22
model. The research done by Basu (2001) and RYAN and ZAROWIN (2001) also supports this conclusion.
Conservatism (RQ7)
This research also analyses the correlation between the age of the companies (Appendix 6) and the choice measurement model for investment properties. The correlation found is ρ = 0.212. It is possible to state that older companies more likely to adopt the fair value. This can be supported by Basu (2001) that states that small firms are more probable to choose a conservative model (cost model). And younger firms, normally, are also smaller than the ones formed some years before. From this point of view this RQ is related with the RQ5, because the smaller companies have also the youngest companies.
The main recommendation that is possible to withdraw from this study is that the companies need to disclose all the mandatory information about investment properties. Without all the mandatory information is more difficult to do comparisons between the European companies, since this one of the purposes with the mandatory implementation of IFRS.
7. Conclusion
23
The literature review and the analysis of the legal framework helped to develop the research questions. Despite the scarce information that Portuguese listed companies disclose about investment properties, some relevant conclusions come out from this study and recommends to regulators, preparers and users in order to improve the practices of financial reporting about investment properties. There is evidence that most of the Portuguese listed companies adopt the cost model and only a small number uses the fair value when recognizing investment properties. The choice of the model is independent of the economic sector and of the size of the company. However, a slight correlation was found between the financial leverage ratio and the choice by the fair value model. The same happened with the number of years that the company operates and the fair value: firms adopting the fair value are more leveraged as well as older companies are more willing to adopt the fair value model.
There is room for improvement of investment properties reporting in Portugal, namely because companies are not disclosing all the mandatory information required by IAS 40, and there is unclear information. So this study recommends in order to addressing those issues. The main recommendation is addressed to preparers and users of the financial reporting of companies that were part of this study. Companies should follow the standards that are mandatory and disclose all the information that is required by the IAS 40 available. This will make company more transparent and the main stakeholders will value it.
24
of this Work Project, the reduced sample. Because Portuguese non-listed companies that do not adopt IFRS, differences in reporting may emerge from such a study. .Also, it is interesting to analyse differences in reporting investment properties in various countries, comparing companies in Portugal and in other countries, namely Spain.
Overall, this Work Project offers a first insight about measurement and disclosures issues in financial reporting of investment properties in Portugal and the reasons that leads or not the companies to choose either the fair value or the cost model.
8. References
Basu, Sudipta. 2001. "Discussion of on the asymmetric recognition of good and bad news in France, Germany and the United Kingdom." Journal of business, finance and accounting, Vol. 28(9) & (10): 1333-1349.
Batista, Fabiano F., Alexsandro G. S. Prado, and Emilio Luis Bonoli. 2012. “Avaliação das Propriedades para Investimento: Uma análise dos fatores que influenciam na decisão entre valor
justo e modelo de custo”. Paper presented at the 12º Congresso USP de Controladoria e
Contabilidade, Universidade de São Paulo, São Paulo
Christensen, Hans B., and Valeri Nikolaev. 2009. “Who uses fair value accounting for non -financial assets after IFRS adoption?” The University of Chicago Booth School of Business Working Paper 09-12.
Conceição, Liliana. 2009. “A Opção pelo “Justo Valor” como Método de Avaliação de
Activos na Adopção das IAS/IFRS em Portugal” Master Degree Thesis Universidade do Porto
Demaria, Samaria, and Dominique Dufour. 2007. “First time adoption of IFRS, Fair value option, Conservatism: Evidences from French listed companies”. http://hal.archives-ouvertes.fr/docs/00/26/61/89/PDF/First_adoption_and_fair_value_Demaria_Dufour.pdf.
Elliott, Barry, and Jamie Elliott. 2009. Financial Accounting and Reporting. Edinburgh: Pearson Education Limited.
Epstein, Barry J., and Eva K. Jermakowicz. 2010. Interpretation and Application of International Financial Reporting Standards. New Jersey: John Wiley & Sons. Inc.
Ernst & Young. 2005. “How fair is fair value?”
http://www2.eycom.ch/publications/items/ifrs/single/200506_fair_value/en.pdf.
European Commission. 2009. “International Accounting Standard 16 - Property, Plant and
Equipment.” http://ec.europa.eu/internal_market/accounting/docs/consolidated/ias16_en.pdf
European Commission. 2009. “International Accounting Standard 40 - Investment Property.” http://ec.europa.eu/internal_market/accounting/docs/consolidated/ias40_en.pdf
25 International Valuation Standards Council. 2013. International Valuation Standards Council. http://www.ivsc.org/workplan/investment-property (accessed January 2, 2013).
Kieso, D.E. and J. J. Weygandt. 1997. Intermediate Accounting. New York: John Wiley & Sons, Inc.
Muller, Karl A., Edward J. Riedl, and Thorsten Sellhorn. 2008. “Causes and Consequences
of Choosing Historical Cost versus Fair Value”.
http://www3.nd.edu/~carecob/May2008Conference/Papers/RiedlMRS03062008.pdf.
Muller, Karl A., Edward J. Riedl, and Thorsten Sellhorn. 2008. “Consequences of
Voluntary and Mandatory Fair Value Accounting: Evidence Surrounding IFRS Adoption in the
EU Real Estate Industry”. Harvard Business School Working Paper 09-033.
Watts, Ross L., and Jerold Zimmerman. 1978. "Towards a positive theory of the determination of accounting standards." The Accounting Review, 53(1): 112 -134.
Watts, Ross L., and Jerold Zimmerman. 1990. "Positive accounting theory: a ten year perspective." The Accounting Review, 65(1): 131-156.
9. Appendices
Appendix 1: Which companies present have investment properties?
Yes No
Banco BPI, S.A. Altri SGPS, S.A.
Banco Espírito Santo, S.A. Banco Comercial Português, S.A.
Banco Popular Español, S.A. Banif, SGPS, S.A.
Banco Santander Totta, S.A. Corticeira Amorim, SGPS, S.A.
Brisa - Auto-Estradas de Portugal, S.A. EDP - Energias de Portugal S.A.
Cimpor Cimentos de Portugal SGPS, S.A. Estoril Sol, SGPS, S.A.
Cofina SGPS S.A. F. Ramada - Investimentos, SGPS, S.A.
Compta-Equipamentos e Serviços de Informática, S.A. Grupo Soares da Costa, SGPS, S.A.
EDP Renováveis, S.A. Impresa - Sociedade Gestora de Participações Sociais, S.A.
Espírito Santo Financial (Portugal) SGPS,S.A. Inapa-Investimentos Participações e Gestão, S.A.
Fisipe - Fibras Sintéticas de Portugal, S.A. Jerónimo Martins,SGPS, S.A.
Galp Energia SGPS, S.A. Martifer, SGPS, S.A.
Glintt - Global Intelligent Technologies, SGPS, S.A. Mota-Engil, SGPS, S.A.
Grupo Media Capital, SGPS, S.A. Portugal Telecom, SGPS, S.A.
Ibersol, SGPS, S.A. Sacyr Vallehermoso, S.A.
Imobiliária Construtora Grão-Pará, S.A. SAG GEST - Soluções Automóvel Globais, SGPS, S.A.
Lisgráfica - Impressão e Artes Gráficas, S.A. Semapa - Sociedade de Investimento e Gestão, SGPS, S.A.
Novabase, SGPS, S.A. Sociedade Comercial Orey Antunes, S.A.
Portucel - Empresa Produtora de Pasta e Papel, S.A. Sonae Indústria, SGPS, SA
Reditus - SGPS, S.A. Sonae, SGPS, S.A.
REN - Redes Energéticas Nacionais, SGPS, S.A. Teixeira Duarte - Engenharia e Construções, S.A.
Sonae Capital, SGPS, S.A. Toyota Caetano Portugal, S.A.
SONAE.COM, SGPS, S.A. VAA - Vista Alegre Atlantis, SGPS, S.A.
26 10. Data-base
Appendix 2: Data selected from annual reports
Company IP 2010 Assets 2010 IP/Assets
2010 IP 2011 Assets 2011
IP/Assets 2011 Cost Model=0; Fair Value=1 Disclosure Fair Value Descriptive Note (No=0; Yes=1)
Altri SGPS, S.A. 214,213 € 1,190,476,397 € 0.02% 534,226 € 1,127,723,819 € 0.05% 0 - 1
Banco Comercial Português, S.A. 404,734,000 € 98,546,755,000 € 0.41% 560,567,000 € 93,482,076,000 € 0.60% 1 - 0
Banif, SGPS, S.A. 28,924,000 € 15,061,054,000 € 0.19% 56,221,000 € 16,725,859,000 € 0.34% 0 66,638,000 € 1
Corticeira Amorim, SGPS, S.A. 7,733,000 € 561,766,000 € 1.38% 7,576,000 € 605,053,000 € 1.25% 0 - 1
EDP - Energias de Portugal S.A. - 18,167,608,000 € - 11,468,000 € 18,710,681,000 € 0.06% 0 - 0
Estoril Sol, SGPS, S.A. 232,721 € 256,353,898 € 0.09% 226,551 € 278,401,982 € 0.08% 0 - 1
F. Ramada - Investimentos, SGPS, S.A. 81,721,677 € 186,127,402 € 43.91% 85,860,729 € 183,886,541 € 46.69% 0 - 1
Grupo Soares da Costa, SGPS, S.A. 10,026,295 € 1,661,281,528 € 0.60% 9,907,556 € 1,763,692,936 € 0.56% 0 15,990,000 € 1 Impresa - Sociedade Gestora de Participações
Sociais, S.A. 6,107,685 € 484,403,263 € 1.26% 6,229,834 € 441,809,872 € 1.41% 0 - 1
Inapa-Investimentos Participações e Gestão, S.A. 17,104,200 € 354,410,600 € 4.83% 16,540,400 € 357,208,500 € 4.63% 0 - 1
Jerónimo Martins,SGPS, S.A. 52,047,000 € 4,159,022,000 € 1.25% 52,128,000 € 4,481,283,000 € 1.16% 1 - 1
Martifer, SGPS, S.A. 14,981,893 € 1,095,697,651 € 1.37% 17,274,846 € 1,037,833,335 € 1.66% 1 - 1
Mota-Engil, SGPS, S.A. 88,614,797 € 3,456,166,184 € 2.56% 62,947,053 € 3,524,296,928 € 1.79% 1 - 1
Portugal Telecom, SGPS, S.A. 15,051,101 € 15,169,932,161 € 0.10% 12,821,604 € 22,943,790,952 € 0.06% 0 - 1
Sacyr Vallehermoso, S.A. 2,654,463,000 € 21,113,095,000 € 12.57% 2,623,606,000 € 16,710,346,000 € 15.70% 0 - 1 SAG GEST - Soluções Automóvel Globais, SGPS,
S.A. - 973,098,255 € - 1,478,500 € 801,777,520 € 0.18% 1 - 1
Semapa - Sociedade de Investimento e Gestão,
SGPS, S.A. 845,791 € 3,569,649,634 € 0.02% 830,412 € 3,785,556,572 € 0.02% 0 - 0
Sociedade Comercial Orey Antunes, S.A. 4,650,900 € 103,114,994 € 4.51% 4,581,483 € 95,788,152 € 4.78% 1 - 1
Sonae Indústria, SGPS, SA 1,401,731 € 1,485,594,812 € 0.09% 1,357,473 € 1,431,607,388 € 0.09% 0 1,500,000 € 1
Sonae, SGPS, S.A. 1,733,205,596 € 7,551,813,932 € 22.95% 1,679,859,268 € 7,740,715,012 € 21.70% 1 - 1
Teixeira Duarte - Engenharia e Construções, S.A. 509,516,000 € 2,721,252,000 € 18.72% 522,016,000 € 2,753,194,000 € 18.96% 1 - 1
Toyota Caetano Portugal, S.A. 16,910,528 € 291,170,549 € 5.81% 17,113,956 € 261,292,853 € 6.55% 0 48,000,000 € 1
VAA - Vista Alegre Atlantis, SGPS, S.A. 21,472,000 € 131,430,000 € 16.34% 24,962,000 € 130,872,000 € 19.07% 1 - 1 Zon Multimédia - Serviços de Telecomunicações e
27 Appendix 3: Changes in Investment Properties from 2010 to 2011
Company Change in IP
Value Depreciation Impairments
Business Combination
Exchange
Rate Effect Additions Sales
Transfers and
Write-offs
Changes in Fair Vale
Altri SGPS, S.A. 320,013 € - 10,818 € - - - 367,795 € - - 36.964 € -
Banco Comercial Português, S.A. 155,833,000 € - - - -
Banif, SGPS, S,A, 27,297,000 € - 321,000 € - 3,076,000 € - - 22,157,000 € - 1,443,000 € 9,980,000 € -
Corticeira Amorim, SGPS, S,A, - 157,000 € - 700,000 € - - - 53,000 € - 266,000 € 756,000 € -
EDP - Energias de Portugal S,A, 11,468,000 € - - - -
Estoril Sol, SGPS, S,A, - 6,170 € - 6,170 € - - - -
F, Ramada - Investimentos, SGPS, S,A, 4,139,052 € - - - - 4,200,213 € - 61,161 € - -
Grupo Soares da Costa, SGPS, S,A, - 118,739 € - 232,956 € - - 12,535 € 691,537 € - - 589,855 € -
Impresa - Sociedade Gestora de Participações Sociais, S,A, 122,149 € - - - - 122,149 € - - -
Inapa-Investimentos Participações e Gestão, S,A, - 563,800 € - 563,800 € - - - -
Jerónimo Martins,SGPS, S,A, 81,000 € - - - - 19,000 € - 1,613,000 € - 1,551,000 €
Martifer, SGPS, S,A, 2,292,953 € - - - - 433,334 € - - 1,891,036 € 835,252 €
Mota-Engil, SGPS, S,A, - 25,667,744 € - - - 9,637 € 2,559,749 € - 29,401 € - 28,207,729 € -
Portugal Telecom, SGPS, S,A, - 2,229,497 € - 2,276,120 € - 94,709 € - - - -
Sacyr Vallehermoso, S,A, - 30,857,000 € - 51,320,000 € 4,904,000 € - 3,236,000 € 13,621,000 € - 1,370,000 € 72,000 € -
SAG GEST - Soluções Automóvel Globais, SGPS, S,A, 1,478,500 € - - - 1,478,500 € -
Semapa - Sociedade de Investimento e Gestão, SGPS, S,A, - 15,379 € - - - -
Sociedade Comercial Orey Antunes, S,A, - 69,417 € - - - - 78,900 € - 9,483 €
Sonae Indústria, SGPS, SA - 44,258 € - 44,258 € - - - -
Sonae, SGPS, S,A, - 53,346,328 € - - 192,054 € 3,000,000 € - 22,953,710 € 58,242,520 € - 66,699,764 € - 5,810,758 € - 18,932,562 €
Teixeira Duarte - Engenharia e Construções, S,A, 12,500,000 € - - - 2,459,000 € 1,721,000 € - - 82,000 € 8,402,000 €
Toyota Caetano Portugal, S,A, 203,428 € - 633,721 € - - - 837,149 € -
VAA - Vista Alegre Atlantis, SGPS, S,A, 3,490,000 € - 78,000 € - - - 3,412,000 €
28 Appendix 4: Data about Type of IP, Depreciation, Cost and Rentals
Company Type of IP Depreciation Method Useful Lives Buildings (Years) Costs Rentals
Altri SGPS, S.A. Land Straight Line 10 to 50 - -
Banco Comercial Português, S.A. - - - - -
Banif, SGPS, S.A. Land and Buildings Straight Line - -
Corticeira Amorim, SGPS, S.A. Land and Buildings Straight Line 20 to 50 - -
EDP - Energias de Portugal S.A. - Straight Line 8 to 50 - -
Estoril Sol, SGPS, S.A. Buildings Straight Line 50 - -
F. Ramada - Investimentos, SGPS, S.A. Land Straight Line 10 to 50 - 5,720,000 €
Grupo Soares da Costa, SGPS, S.A. Land and Buildings Straight Line 100 - -
Impresa - Sociedade Gestora de Participações Sociais, S.A. Land Straight Line 10 to 50 - -
Inapa-Investimentos Participações e Gestão, S.A. Land and Buildings Straight Line 10 to 50 - -
Jerónimo Martins,SGPS, S.A. Land and Buildings - - - -
Martifer, SGPS, S.A. Land and Buildings - - - -
Mota-Engil, SGPS, S.A. Land and Buildings - - - 2,729,641 €
Portugal Telecom, SGPS, S.A. Buildings - 80,186 €
Sacyr Vallehermoso, S.A. Land and Buildings Straight Line 50 to 68 40,759,000 € 230,820,000 €
SAG GEST - Soluções Automóvel Globais, SGPS, S.A. Buildings - - 9,462 € 65,388 €
Semapa - Sociedade de Investimento e Gestão, SGPS, S.A. Land and Buildings Straight Line 12 to 30 - -
Sociedade Comercial Orey Antunes, S.A. Land and Buildings - - - -
Sonae Indústria, SGPS, SA Land and Buildings Straight Line 20 to 40 273,453 € 316,870 €
Sonae, SGPS, S.A. Buildings - - - -
Teixeira Duarte - Engenharia e Construções, S.A. Land and Buildings - - - -
Toyota Caetano Portugal, S.A. Land and Buildings Straight Line 20 to 50 - -
VAA - Vista Alegre Atlantis, SGPS, S.A. Land and Buildings - - - 275,000 €
29 Appendix 5: Data about Sector, Auditor and SGPS
Company Sector Auditor SGPS (No=0; Yes=1)
Altri SGPS, S.A. Industry Deloitte 1
Banco Comercial Português, S.A. Financials KPMG 0
Banif, SGPS, S.A. Financials Ernst & Young 1
Corticeira Amorim, SGPS, S.A. Industry PwC 1
EDP - Energias de Portugal S.A. Energy KPMG 0
Estoril Sol, SGPS, S.A. Hospitality & Tourism Lampreia & Viçoso 1
F. Ramada - Investimentos, SGPS, S.A. Industry Deloitte 1
Grupo Soares da Costa, SGPS, S.A. Construction Grant Thornton 1
Impresa - Sociedade Gestora de Participações Sociais, S.A. Services Deloitte 1
Inapa-Investimentos Participações e Gestão, S.A. Industry PwC 0
Jerónimo Martins,SGPS, S.A. Retail Trade PwC 1
Martifer, SGPS, S.A. Industry PwC 1
Mota-Engil, SGPS, S.A. Construction Deloitte 1
Portugal Telecom, SGPS, S.A. Information Technology Deloitte 1
Sacyr Vallehermoso, S.A. Construction Ernst & Young 0
SAG GEST - Soluções Automóvel Globais, SGPS, S.A. Retail Trade Ernst & Young 1
Semapa - Sociedade de Investimento e Gestão, SGPS, S.A. Industry PwC 1
Sociedade Comercial Orey Antunes, S.A. Construction Ernst & Young 0
Sonae Indústria, SGPS, SA Industry PwC 1
Sonae, SGPS, S.A. Retail Trade Deloitte 1
Teixeira Duarte - Engenharia e Construções, S.A. Construction Mariquito, Correia & Associados 0
Toyota Caetano Portugal, S.A. Retail Trade PwC 0
VAA - Vista Alegre Atlantis, SGPS, S.A. Services Ernst & Young 1
Zon Multimédia - Serviços de Telecomunicações e Multimédia, SGPS, S.A. Information Technology PwC 1
30 Appendix 6: Data about Conservatism and Financial Leverage
Company Year Age Assets in 2011 recognized at Fair Value Asset Variation IP Variation Debt Equity Debt/Equity
Altri SGPS, S.A. 2005 7 - - - 986,961,190 € 140,762,629 € 7.01
Banco Comercial Português, S,A, 1985 27 - - - 89,107,706,000 € 4,374,370,000 € 20.37
Banif, SGPS, S,A, 1988 24 16,736,276,000 € 0,06% 18,53% 15,906,404,000 € 819,455,000 € 19.41
Corticeira Amorim, SGPS, S,A, 1870 142 - - - 322,761,000 € 282,292,000 € 1.14
EDP - Energias de Portugal S,A, 1976 36 - - - 11,973,896,000 € 6,736,785,000 € 1.78
Estoril Sol, SGPS, S,A, 1958 54 - - - 178,956,862 € 77,397,037 € 2.31
F, Ramada - Investimentos, SGPS, S,A, 1935 77 - - - 133,792,300 € 50,094,241 € 2.67
Grupo Soares da Costa, SGPS, S,A, 1918 94 1,769,775,380 € 0,34% 61,39% 1,647,170,444 € 116,522,493 € 14.14
Impresa - Sociedade Gestora de Participações Sociais, S,A, 1972 40 - - - 317,959,977 € 123,849,895 € 2.57
Inapa-Investimentos Participações e Gestão, S,A, 1965 47 - - - 157,945,100 € 199,263,400 € 0.79
Jerónimo Martins,SGPS, S,A, 1949 63 - - - 3,059,598,000 € 1,421,685,000 € 2.15
Martifer, SGPS, S,A, 1990 22 - - - 754,516,699 € 283,316,635 € 2.66
Mota-Engil, SGPS, S,A, 1946 66 - - - 3,109,472,342 € 414,824,586 € 7.50
Portugal Telecom, SGPS, S,A, 1887 125 - - - 19,200,984,859 € 3,742,806,093 € 5.13
Sacyr Vallehermoso, S,A, 1921 91 - - - 14,162,065,000 € 2,548,281,000 € 5.56
SAG GEST - Soluções Automóvel Globais, SGPS, S,A, - - - 771,235,451 € 30,542,068 € 25.25
Semapa - Sociedade de Investimento e Gestão, SGPS, S,A, 1991 21 - - - 2,403,536,685 € 1,382,019,887 € 1.74
Sociedade Comercial Orey Antunes, S,A, 1886 126 - - - 69,333,540 € 26,454,612 € 2.62
Sonae Indústria, SGPS, SA 1959 53 1,431,749,915 € 0,01% 10,50% 1,195,730,827 € 235,876,561 € 5.07
Sonae, SGPS, S,A, 1959 53 - - - 5,775,743,962 € 1,964,971,050 € 2.94
Teixeira Duarte - Engenharia e Construções, S,A, 1921 91 - - - 2,420,543,000 € 332,651,000 € 7.28
Toyota Caetano Portugal, S,A, 1946 66 292,178,897 € 11,82% 180,47% 129,169,038 € 132,123,815 € 0.98
VAA - Vista Alegre Atlantis, SGPS, S,A, 1824 188 - - - 97,574,000 € 33,297,000 € 2.93