AGRI-FOOD TRADE ANALYSIS: COMPARISON OF SLOVENIA WITH THE NINE NEW
MEMBER STATES
ZNAČILNOSTI TRGOVINE S KMETIJSKIMI IN ŽIVILSKIMI PROIZVODI: PRIMERJAVA
SLOVENIJE Z OSTALIMI NOVIMI ČLANICAMI EVROPSKE UNIJE
Darja MAJKOVIČ
1*, Jernej TURK
2and Emmanuelle CHEVASSUS – LOZZA
31*University of Maribor, Faculty of Agriculture, Vrbanska 30, 2000 Maribor, Slovenia. Phone : 00386 2 25 05 831, Fax : 00386 2 229 60 71, E-mail : darja.majkovic@uni-mb.si 2 University of Maribor, Faculty of Agriculture, Vrbanska 30, 2000 Maribor, Slovenia.
3 INRA (Nantes), Laboratoire d’Etudes et de Recherches Economiques – LERECO, Rue de la Géraudière – B.P.71627 44316 Nantes Cedex 3, France.
Manuscript received: October 7, 2005; Reviewed: January 3, 2006; Accepted for publication: June 23, 2006
ABSTRACT
The comparative analysis of trade with agricultural and food products of ten EU new member states (NMS), with emphasis on Slovenia, has been conducted at a highly disaggregated level. Slovenia has always been the net importer of agricultural and food products, and the same goes for the majority of ten NMS in the period analysed. For the purpose of assessing the similarities in their export structure, the export similarity index “S” has been used. By its use no signifi cant overlap of export structures between NMS is revealed, but the slightly increase in resemblance is observed from 1999 to 2003, indicating the simultaneous restructuring of NMS’ agri-food sectors. Another indicator introduced in this comparative analysis is Revealed Comparative Advantage “RCA”, measuring competitiveness through major groups of products. Slovenia has the comparative advantage in comparison with the rest of new member states in following groups of products: meat, dairy products, beverages and others.
Key words: New member states, Agri-food trade, Export Similarity Index, Revealed Comparative Advantage
IZVLEČEK
PODROBNI IZVLEČEK
V prispevku prikazujemo osnovne značilnosti trgovine s kmetijskimi in živilskimi proizvodi na območju desetih novih članic Evropske Unije (EU): Ciper, Češka Republika, Estonija, Latvija, Litva, Madžarska, Malta, Poljska,Slovaška in Slovenija. Pri analizi trgovinskih tokov omenjenih držav lahko razlike med le-temi v veliki meri pripišemo različni pomembnosti in stopnji napredka kmetijskega in prehranskega sektorja v posameznih državah. Za analiziranje stopnje konkurenčnosti in primerjavo slovenskega agro-živilskega sektorja s sektorjem v ostalih državah, smo uporabili dva bolj ali manj tradicionalna zunanjetrgovinska indikatorja, ki analizirata predvsem izvozno stran blagovne menjave. Prvi je t.i. »Export Similarity Index«(enačba (1)) ali indeks podobnosti izvoza S [8]. Drugi uporabljen indeks je »Revealed Comparative Advantage RCA« (glej enačba (2)) ali t.i. indeks komparativnih prednosti [2]. Analiza temelji na podatkih Slovenskega statističnega urada, kjer smo zajeli podatke o kmetijskih in živilskih proizvodih v prvih štiriindvajsetih poglavij Kombinirane Nomenklature (KN) na nivoju šestih decimalk. S to serijo podatkov pokrivamo obdobje od leta 1996 do leta 2002. Nadalje smo za potrebe komparativne analize z ostalimi novimi EU članicami uporabili podatke Eurostatove baze podatkov Comext na nivoju osmih decimalk KN 1-24 za petletno obdobje pred vstopom v EU (1999-2003). Rezultati analize nam prikazujejo specifi čno geografsko orientiranost slovenskih trgovcev s kmetijskimi in živilskim proizvodi (glej Tabela 1 in Slika 1). Saldo blagovne menjave omenjenih proizvodov je brez izjeme skozi celotno obdobje negativen. Pri proučevanju geografske porazdelitve nadalje ugotovimo, da je takšen saldo značilen za vse izvozne trge (npr. EU, CEFTA) z izjemo trgov bivše Jugoslavije, kjer dosegamo tradicionalne presežke v menjavi. Kot možen razlog za tovrstne geografske vzorce trgovanja v analiziranem obdobju lahko omenimo (pre)majhno stopnjo konkurenčnosti slovenskih agro-živilskih proizvodov na večini mednarodnih trgov. V nadaljevanju analize ugotovimo, da so poleg Slovenije neto uvoznice hrane tudi praktično vse ostale nove EU članice, z izjemo Madžarske, katere agro-živilski sektor lahko označimo kot enega najbolj uspešnih v smislu trgovanja med desetimi obravnavanimi državami (Tabela 2, 3 in 4). Poleg Madžarske, lahko uvrstimo med najmočnejše trgovinske partnerice evropskih držav tudi Poljsko, tako na področju predelanih kot nepredelanih proizvodov. V nadaljevanju prispevka interpretiramo vrednosti uporabljenih
zunanjetrgovinskih kazalcev in njihov pomen, pri čemer ugotavljamo, da Slovenija polagoma izgublja na svoji konkurenčnosti izvoženih agro-živilskih proizvodov v primerjavi z ostalimi novimi članicami EU.
INTRODUCTION
In the 2004 enlargement towards East, ten new member states (NMS) joined the European Union: beside Slovenia, two island states (Cyprus and Malta) and the following Central and Eastern European countries: Czech Republic, Slovakia, Poland, Estonia, Lithuania, Latvia and Hungary. They form all but homogeneous group; in some of NMS agricultural sector still accounts the proportional share of GDP and/or employment (e.g. Poland), while in the others (Slovenia, Czech Republic, Hungary, Estonia) this share is currently close to the EU average level. Unequal signifi cance and level of development of agricultural and also food sector can be seen when analysing the trade patterns of ten NMS. The dissimilarities are deepened while they are developing different specialization patterns along agri-food chain, with various degree of competitiveness from one country to another. Some indications about the magnitude of effi ciency of the agri-food sector1 are presented in the
continuation, emphasising Slovenian trade performance in comparison with the rest of NMS. In Section 2, the methodology and data used are presented, while the Section 3 continues with the results and discussion. Section 4 concludes this paper.
METHODOLOGY AND DATA
For examination of competitiveness and comparison of Slovene agricultural sector and food industry with the rest of NMS, the highly disaggregated data from two sources have been analysed, comprising agricultural and food products from fi rst twenty-four chapters of Combined Nomenclature (CN). Firstly, for the detailed analysis of Slovene agricultural and food trade, which is partially presented in this paper, the data from Slovene Statistical offi ce from 1996 to 2002 has been used on the level of 6 digits of (CN) and secondly, the comparison with the rest of NMS has been investigated on level of 8 digits CN from Eurostat’s Comext database for the period 1999 – 2003.
Methodology used to assess the relative state of competitiveness of Slovenian agri – food sector compared to the rest of NMS can be based on usage of selected
trade indicators. One of them is Export Similarity Index (S) [8], defi ned as:
�
( ), ( )�
100 ), (
� � � �
� � �
�
i MinimumXiac Xibc
c ab
S
(1)
It measures the similarity of export patterns of countries (or country groups) a and b to market c. is the share of commodity i in a’s exports to c. If the commodity distribution of a’s and b’s are identical ( =
for each i), the index will take on a value of 100. If a’s and b’s export patterns are totally dissimilar (for each >0, =0, and vice versa), the index will be zero. Index compares only patterns of exports across product categories, so it is not infl uenced by the relative sizes or scales of total exports. But, it should be noted here that this measure may be subject to aggregation bias (as the data are more fi nely disaggregated, the index will tend to fall) and hence embodies a certain arbitrariness due to product choice.With the aim to compare Slovenian exports with the exports of respective NMS the index S was computed on the 6 digits level of CN for all the products, which were later disentangled into two major groups of primary and processed products. For these two groups we assume different level of value added - processed products reveal higher value added content than primary ones2. The S for the two groups refl ects
2 We refer to primary products as the ones, are classifi ed by BEC (Broad Economic Categories classifi cation of United
Nations) into following categories: 111=food and beverages, primary, mainly for industry; 112=food and beverages, primary, mainly for household consumption; 21=industrial supplies not else specifi ed-primary. The processed products refer to following categories:121=food and beverages, processed, mainly for industry; 122=food and beverages, processed, mainly for HH consumption; and 22=industrial supplies not else specifi ed-processed.
the similarity / dissimilarity of exports of agricultural and food products respectively and thus illuminate their degree of competition separately.
Measure of revealed comparative advantage (RCA), originating from [2] can be used to help assessing a country’s export potential. The RCA indicates whether a country is in the process of extending the products in which it has a trade potential, as opposed to situations in which the number of products that can be competitively exported is static. It can also provide useful information about potential trade prospects with new partners. The RCA index of country i for product j is measured by the product’s share in the country’s exports in relation to its share in world trade (since our purpose is the comparison of NMS, we will refer to NMS’ shares instead of world shares):
wt wj it ij
ij
X
x
X
x
RCA
�
(2)where xij and xwj are the values of country i’s exports of product j and world (NMS) exports of product j and where Xit and Xwtwtwt refer to the country’s total exports and world (NMS) total exports. A value of less than unity
Table 1. Slovenian trade balance for agri-food products with respect to geographical repartition (in mio €).
EU1 ex Yu2 CEFTA3 ROW4 Total
1996
Export 65.58 175.52 8.25 33.04 282.38
Import 316.93 82.11 89.76 145.15 633.96
Balance -251.36 93.41 -81.51 -112.12 -351.57
2002
Export 83.19 269.30 11.35 43.65 407.49
Import 413.96 80.23 129.67 135.28 759.14
Balance -330.77 189.07 -118.33 -91.63 -351.65
1 EU 15 members
2 Bosnia and Hercegovina, Serbia and Montenegro, Croatia, Former Yugoslav Republic of Macedonia 3 Current CEFTA members in the respective years
4 The rest of the world (not included in 1, 2 or 3)
implies that the country has a revealed comparative disadvantage in the product (or group of products). Similarly, if the index exceeds unity, the country is said to have a revealed comparative advantage in the product (group of products).
RESULTS AND DISCUSSION
Looking from the trade perspective, Slovenian agri-food sector is certainly not a driving force of Slovene economy. The negative trade balance on all but former Yugoslav states’ market (Table 1) provides fi rst indication that Slovenia lacks competitiveness in the agricultural and food sector vis-à-vis the majority of its trading partners. Of course the status of net-importer country may be to some extent justifi ed by the fact that conditions for farming in Slovenia are unfavourable and that the supply cannot follow the demand. But for the structure of our trade with relatively low level of value added (see also [4]) no such justifi cation is to be seen, and the need for more effi cient structural reform of the agricultural and food sector seems to be the future necessity.
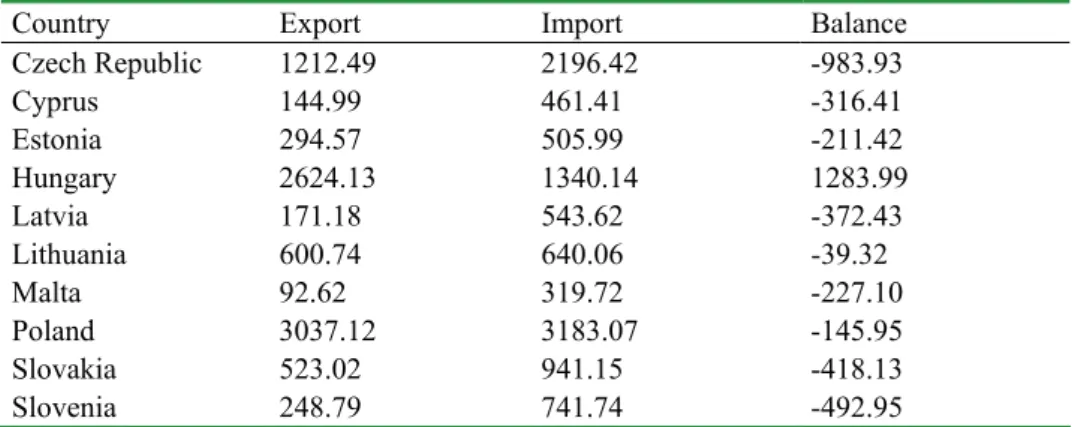
As Table 2 indicates, the trade balances for agricultural and food products of all but one NMS (Hungary) are negative. So all NMS (with the exception of Hungary), are net importers of agricultural and food products. Hungary is relatively abounded with natural land resource and internationally competitive, especially in crop and meat production. It is the NMS case where FDI
Table 2. Ten NMS trade balance for agri-food products in 2003 (in mio €).
Country Export Import Balance
Czech Republic 1212.49 2196.42 -983.93
Cyprus 144.99 461.41 -316.41
Estonia 294.57 505.99 -211.42
Hungary 2624.13 1340.14 1283.99
Latvia 171.18 543.62 -372.43
Lithuania 600.74 640.06 -39.32
Malta 92.62 319.72 -227.10
Poland 3037.12 3183.07 -145.95
Slovakia 523.02 941.15 -418.13
Slovenia 248.79 741.74 -492.95
Note: the results, when using the widely recognised Comext database, differ from those obtained from National statistic offices in respective countries (e.g. according to the official trade statistics for Slovakia trade balance in year 2003 reached -361.34 mio € and for Slovenia -419.27 mio €). Authors are fully aware of the problem of data availability and reliability especially in the case of NMS. The divergence in data (and results) between the national and EU databases comes mainly from different statistic regimes and ways of collecting and computing the data in respective countries. But for the purpose of this comparative analysis the use of such uniform database is necessary for correct calculation of different trade indicators (S,RCA) in order to obtain the direct comparison between NMS.
Source: own computations from Comext database.
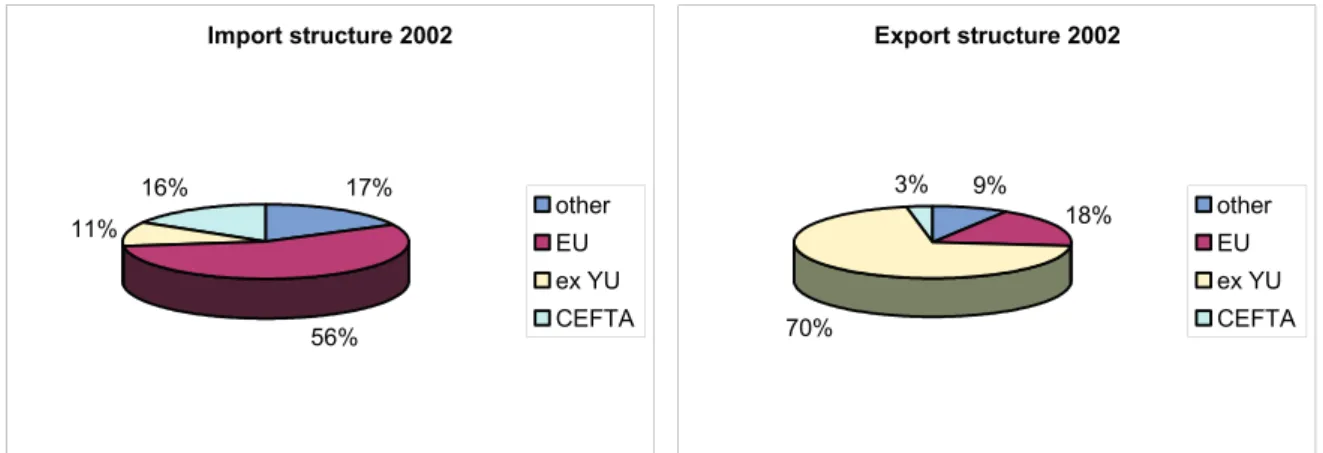
picture. Instead of orienting more towards EU market (due to the expected accession), Slovenian exporters still focused mainly on the markets of former Yugoslav republics and even expanded their exports to these markets. This can be explained by bilateral free trade agreements between Slovenia and former Yugoslav states, yet with the EU entry in 2004 the Slovenian preferential trade status is abolished. Slovene traders should focus to other markets in larger extent before the actual EU entry was stepping into the force in 2004, and by this at least partially avoid the shock of loosing shares on important southern markets. This intuitive thinking is confi rmed by [9], who argue that usually the effects of regional trade agreements are visible before their actual implementation and the same conclusions draw [7]. We must stress out here that this was not the case of Slovenia, exporting only 23% to the EU in 2002, and almost three quarters to the other countries, namely ex YU (see Figure 1). Being part of the same state until 1990s, thus historical links, similar language and common border (with Croatia) are probably the reason for this orientation. Unfortunately, the data to explore the changes in terms of trade before and after the breakdown of former Yugoslavia and use of common currency was not available to us3, but still, after
more than decade, Yugoslav markets remain the pivotal one for Slovenian exporters. Between the year 1996 and 2002 two important events occurred: Slovenia became the CEFTA member in the very same year (1996) and two
years later signed the European association agreement. One would think, major steps should be undertaken by Slovenian traders as a response to these occurrences. As [3] report, due to high prices of Slovenian agri-food products compared to other CEFTA members, Slovenian farmers feared the removal of import tariffs will induce increase of CEFTA’s imports and welfare losses for domestic producers. But, as Figure 1 shows, their fears did not become the reality, since CEFTA membership did not infl uence the trade signifi cantly. This is empirically confi rmed by [6], who used the gravity model to explain the level of border effects which are more signifi cant towards CEFTA than EU and so the integration towards the latter was much deeper that towards former.
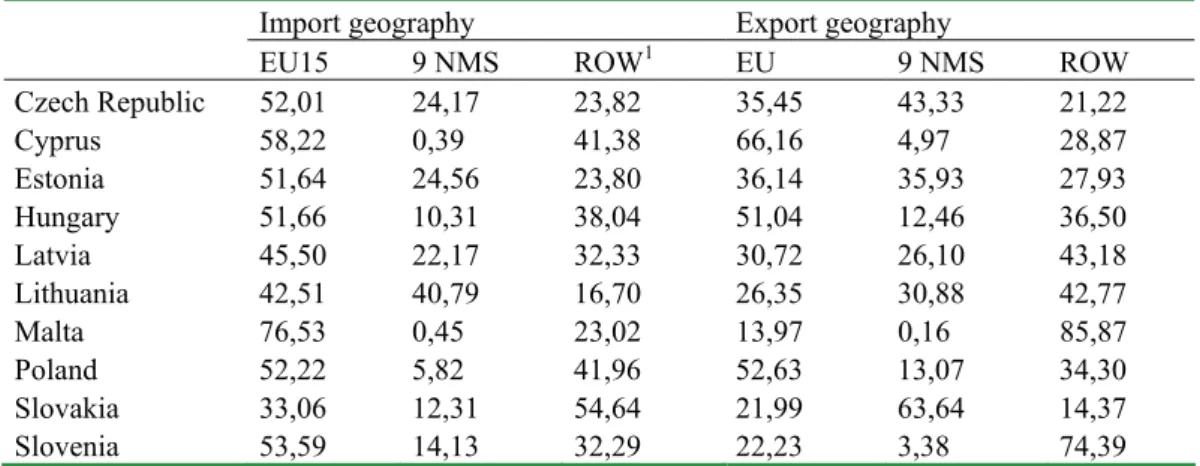
So is there a sort of trade resistance between Slovenia and its trading partners? And if so, does this hold for the rest of NMS as well; characteristically only for agri – food sector or does it hold in general for the whole economies? These questions could be further explored by the use of some empirical techniques (e.g. gravity modelling). To return to the trade orientation, in Table 3 the geographical patterns of all ten NMS in year 2003 are shown.
The differences between NMS occur more evidently when we take a closer look at their geographical patterns of trade (Table 3). Malta and Cyprus seem to trade more with EU and other countries, than with the rest of NMS, since both trade fl ows (export and import) to the NMS represent a very minor proportion. For the rest of eight Eastern and
3 According to [3], in 1992 the export of agri-food products to EU market accounted almost 32%, and former Yu
market 54%. On the import side, the EU share was 29% and former Yu 43%. So our export competitiveness toward EU has signifi cantly fallen, while supply from Yugoslav markets with unfavorable political situation was replaced by other countries, most notably EU.
Figure 1. Geographical patterns in Slovenian trade with agri-food products in 2002 (Source: own computations based on data from Slovene Statistical Offi ce).
Import structure 2002
17%
56% 11%
16%
other EU ex YU CEFTA
Export structure 2002
9%
18%
70% 3%
Table 3. Geographical repartition of the 10 NMS import and export (%) of agri-food products, respectively, in year 2003.
Import geography Export geography
EU15 9 NMS ROW1 EU 9 NMS ROW
Czech Republic 52,01 24,17 23,82 35,45 43,33 21,22
Cyprus 58,22 0,39 41,38 66,16 4,97 28,87
Estonia 51,64 24,56 23,80 36,14 35,93 27,93
Hungary 51,66 10,31 38,04 51,04 12,46 36,50
Latvia 45,50 22,17 32,33 30,72 26,10 43,18
Lithuania 42,51 40,79 16,70 26,35 30,88 42,77
Malta 76,53 0,45 23,02 13,97 0,16 85,87
Poland 52,22 5,82 41,96 52,63 13,07 34,30
Slovakia 33,06 12,31 54,64 21,99 63,64 14,37
Slovenia 53,59 14,13 32,29 22,23 3,38 74,39
1The market “Rest of the world” constitute all other trading partners but EU15 members and NMS.
Source: own computations from Comext database
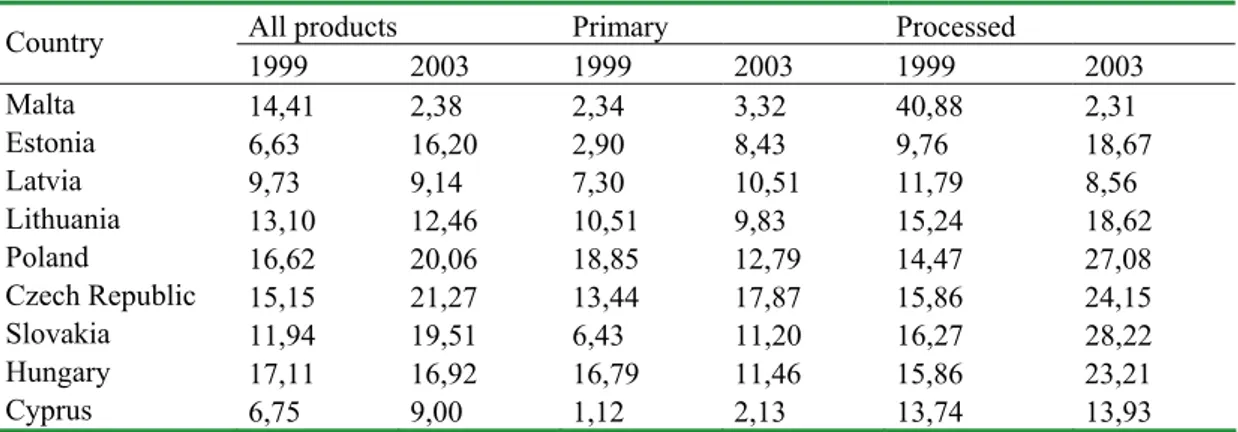
Central European NMS, which in the geographical way constitute the lax region, of course trade with other NMS does gain more important share, namely in the import of Czech Republic and Estonia on import side, as well as Slovakia and again Czech Republic on the export side. In fact, EU is a major importer to all NMS. On the export side, picture is much more heterogeneous. EU represents a major export market for Cyprus, Hungary, Poland and also Estonia (in the latter case with the shares almost equally distributed among export markets). Very important export market for Slovenia represents market ROW (almost three quarters - notably ex Yu), while for Malta this share of third countries is even higher. Slovenia now faces the direct competition of other twenty-four states on the single market. This competition will hopefully induce quicker and more effi cient restructuring in agricultural and food sector. To explore further the situation on two important markets for Slovenia, EU and countries of former Yugoslavia, the Export Similarity Index S was computed for Slovenia in comparison to the rest of NMS. With its use, the similarity of exports (by value added content) is revealed for years 1999 and 2003, which enables us to look closer at the competition on these markets we might face from other NMS. The degree of competition on Single European Market among NMS depends among others also on the similarity of their exports. The similarity of Slovenian exports with other compared NMS countries is not very signifi cant when competing on the global market, although it has risen or remained more or less on the same level in most cases in period from 1999 to 2003 (detailed computations available at authors). The only exception is Malta, which trade is obviously very much different from Slovenian
one. To take a look on EU market (Table 4), the increase from 1999 to 2003 in similar exports for Slovenia compared to 9 NMS is to be seen in most cases, most notably with Poland, Czech Republic and Slovakia. We may say, the more the exports are similar, the bigger the competition is that we are facing on the targeting market and likely trade diversion effect occurs – possibility of displacement of imports from Slovenia by other nine NMS countries becomes larger.
In general, the biggest similarities, revealed by the S indicator, are to be seen in the case of Slovenia with Czech Republic and with Slovakia. Regarding the market of former Yugoslav republics (see Table 5), which was in the analysed period very important for Slovenian agri-food trade, we notice that while in 1999 not all NMS exported their agri-food products, but four years later they expanded to these markets, most notably with processed products. As on all the other markets analysed, also on this one the most evident similarity is revealed with Czech Republic and Hungary, with Slovakia following. But attempts to maintain the market shares in the former Yugoslav region are visible at the moment: some of the major Slovene companies in the food sector merge due to more successful access to these markets.
Table 4. Slovenian export similarity with the rest of 9 NMS on the EU market.
All products Primary Processed
Country
1999 2003 1999 2003 1999 2003
Malta 14,41 2,38 2,34 3,32 40,88 2,31
Estonia 6,63 16,20 2,90 8,43 9,76 18,67
Latvia 9,73 9,14 7,30 10,51 11,79 8,56
Lithuania 13,10 12,46 10,51 9,83 15,24 18,62
Poland 16,62 20,06 18,85 12,79 14,47 27,08
Czech Republic 15,15 21,27 13,44 17,87 15,86 24,15
Slovakia 11,94 19,51 6,43 11,20 16,27 28,22
Hungary 17,11 16,92 16,79 11,46 15,86 23,21
Cyprus 6,75 9,00 1,12 2,13 13,74 13,93
Source: own computations from Comext database
Table 5. Slovenian export similarity with the rest of 9 NMS on the ex Yu market.
All products Primary products Processed products
Country 1999 2003 1999 2003 1999 2003
Malta /* 3,26 / 0,19 / 4,16
Estonia 8,69 0,25 0,96 / 12,35 0,32
Latvia / 0,23 / / / 0,29
Lithuania 0,57 6,13 0,00 5,21 0,90 6,40
Poland 5,75 10,58 3,88 17,74 13,94 7,35
Czech Republic 20,65 22,36 19,22 22,93 21,94 22,31
Slovakia 25,56 14,70 38,57 24,23 22,04 11,57
Hungary 23,48 24,01 14,30 18,22 30,85 27,76
Cyprus 2,02 1,44 3,38 1,13 2,41 1,82
*No exports from respective NMS to the ex Yu market were reported. Source: own computations from Comext database
broad commodity types described bellow. Comparative advantage is a dynamic concept, since the country’s ability to produce certain goods changes over time, due to various endogenous or exogenous factors, such as changes in factor endowments, including technology and human capital.
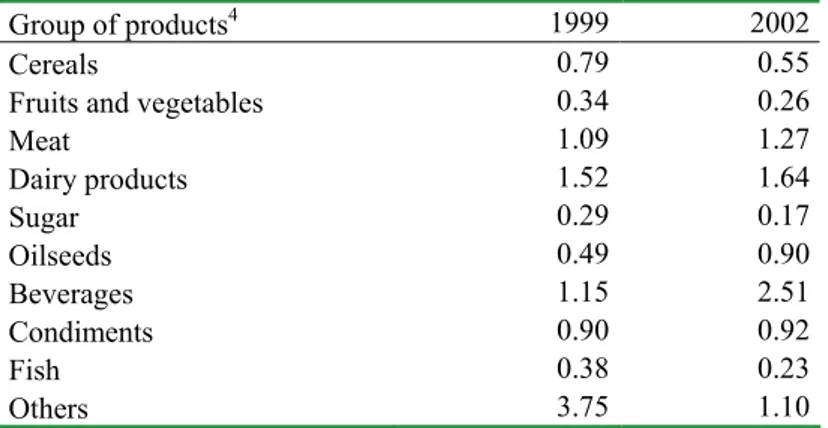
The results reveal competitiveness and structural changes which occurred in an analysed period. Although a country may have a RCA in particular industry at the time, this does not guarantee that the comparative advantage will be maintained straight forward. But the development and past changes might be seen evidently (see Table 6), probably even more if one has longer time series of the data available for the analysis. The sharp decrease of comparative advantages is seen in product’s group Others, while for Meat, Dairy products and markedly for Oilseeds and Beverages the advantages have risen.
CONCLUSIONS
REFERENCES
[1] Addison – Smith, D., Ireland’s Revealed Comparative Advantage, Quaterly Bulletin 1. Economic Analysis, Research and Publications Department, Central Bank & Financial Services Authority of Ireland (2005)1: 101-114.
[2] Balassa, B., Trade Liberalization and ‘Revealed’ Comparative Advantage, The Manchester School of Economic and Social Sciences (1965)33: 99-123.
[3] Bojnec, Š., Hartmann, M., Agricultural and Food Trade in Central and Eastern Europe: The Case of Slovenian Intra-Industry Trade, IAMO Discussion Paper No. 65, Halle (Saale): Institute of Agricultural Development in Central and Eastern Europe, 2004, pp. 1-35.
[4] Bojnec, Š., Majkovič, D., Globalization of Slovenian agricultural and food trade, Managing global transitions (2006) 4: 347-361.
[5] Chevassus-Lozza E., and Gallezot, J., Les effets de l’élargissement de l’Union aux PECO sur les marchés agricoles et agro-alimentaires, Study for French Ministry of Agriculture and Fish, convention no96 G5 01 02, 1998.
[6] De Sousa, J. and Disdier A.C., Legal Framework as a Trade Barrier – Evidence from Transition Countries: Hugarian, Romanian and Slovene examples, HWWA Discussion Paper no. 201, 2002, pp.1-41.
[7] Eichengreen B., and Irwin D.,
The Role
of History in Bilateral Trade Flows
,NBER
Working Papers
5565, National Bureau of Economic Research Inc., 1996.[8] Finger, J.M., Kreinin, M.E., A Measure of „Export Similarity“ and the Possible Uses. The Economic Journal (1979) 89: 995-912.
[9] Frankel, J., Stein, E. and Wei, S.,
Trading blocs
and the Americas: The natural, the unnatural,
and the super-natural
,Journal of Development
Economics
, Elsevier, (1995) 47: 61-95.[10] Jansik, C., Food Industry FDI – An Integrating Force between Western and Eastern European Agri-food Sectors, Eurochoices (2004) 3: 12-16.
[11] Swinnen, J., Will Enlargement Cause a Flood of Eastern Food Imports, Bankrupt the EU Budget and Create WTO Confl icts?, Eurochoices (2001) 1: 48-53.
4The products are classifi ed in ten groups according to the classifi cation key developed by [5].
Table 6. Slovene Revealed Comparative Advantages in 2002, compared to the rest of NMS.
Group of products4 1999 2002
Cereals 0.79 0.55
Fruits and vegetables 0.34 0.26
Meat 1.09 1.27
Dairy products 1.52 1.64
Sugar 0.29 0.17
Oilseeds 0.49 0.90
Beverages 1.15 2.51
Condiments 0.90 0.92
Fish 0.38 0.23
Others 3.75 1.10