J of Evolution of Med and Dent Sci/ eISSN- 2278-4802, pISSN- 2278-4748/ Vol. 3/ Issue 23/June 09, 2014 Page 6435
COMPARATIVE STUDY OF GLYCOSYLATED HAEMOGLOBIN WITH BLOOD
GLUCOSE LEVELS IN THE DIAGNOSIS OF DIABETES MELLITUS
Kavya S. T1, Nagaraja B. S2, Akila V3, G. Chandra Mohan4, Prakash Kikker Gowdaiah5
HOW TO CITE THIS ARTICLE:
Kavya S. T, Nagaraja B. S, Akila V, G. Chandra Mohan, Prakash Kikker Gowdaiah. Comparative Study of Glycosylated Haemoglobin with Blood Glucose Levels in the Diagnosis of Diabetes Mellitus . Journal of Evolution of Medical and Dental Sciences 2014; Vol. 3, Issue 23, June 09; Page: 6435-6443,
DOI: 10.14260/jemds/2014/2760
ABSTRACT: AIMS AND OBJECTIVES: 1. To compare and correlate glycosylated haemoglobin (HbA1C) values suggested by ADA with fasting blood glucose (FBG) and two-hours plasma glucose PG ≥ mg/dl during an OGTT in the diagnosis of diabetes. 2. To define the sensitivity and specificity of HbA1C estimates at the ADA recommended cut off of ≥ 6.5%. 3. To study the effect of changing the HbA1C cut off value on the sensitivity and specificity to diagnose diabetes mellitus in the Indian population. STUDY DESIGN AND METHODS: Patients were first tested for FBG and two-hours PPG. HbA1c was estimated for the 150 newly detected type 2 diabetes mellitus patients by using the immuneturbidometric method. RESULTS: The sensitivity and specificity of HbA1C at the ADA recommended ≥ . % cut off value in newly detected diabetic patients was 97.56% and 33.33% respectively with a positive predicted value of 86.96 % and a negative predictive value of 75.00 % at a p<0.001. CONCLUSION: Our study shows that HbA1C can be used along with blood sugar estimation but is not superior enough to replace blood glucose estimation. Cost and standardisation of HbA1C assays is a big hurdle in the Indian context. Blood sugars on the other hand are widely available and cost effective.
KEYWORDS: HbA1C, Blood Glucose, diagnosis of diabetes.
INTRODUCTION: Diabetes mellitus is a metabolic disorder characterized by chronic hyperglycemia resulting from defects in insulin secretion or action or both. Diabetes is a chronic illness associated with significant micro vascular and macro vascular complications.
India leads the world with largest number of diabetic subjects with the dubious distinction of being termed the diabetes capital of the world . According to the Diabetes Atlas published by the International Diabetes Federation, the number of people with diabetes in India is currently around 40.9millions and is expected to rise to 69.9millions by 2025 unless urgent preventive steps are taken. The so called Asian )ndian Phenotype refers to certain unique clinical and biochemical abnormalities in Indians which include increased insulin resistance, greater abdominal adiposity i.e., higher waist circumference despite lower body mass index, lower adiponectin and higher high sensitive C-reactive protein levels. This phenotype makes Asian Indians more prone to diabetes and premature coronary artery disease.(1)
Hence diagnosing diabetes, predicting and preventing complications accurately is of paramount importance in the Indian context considering the high prevalence of both the disease and its complications.
J of Evolution of Med and Dent Sci/ eISSN- 2278-4802, pISSN- 2278-4748/ Vol. 3/ Issue 23/June 09, 2014 Page 6436 representatives of the ADA, the International Diabetes Federation (IDF), and the European Association for the Study of Diabetes (EASD) recommended the use of the A1C test to diagnose diabetes, with a threshold of ≥ 6.5%,(5) and the ADA adopted this criterion in 2010.(4)
The diagnostic test should be performed using a method that is certified by the NGSP and standardized or traceable to the Diabetes Control and Complications Trial (DCCT) reference assay. The use of point-of-care (POC) A1C assay for diagnostic purposes could be problematic because proficiency testing is not mandated for performing the test even though they may be NGSP certified.
A test result diagnostic of diabetes should be repeated to rule out laboratory error, unless the diagnosis is clear on clinical grounds. It is preferable that the same test be repeated for confirmation, since there will be a greater likelihood of concurrence in this case.(2) For example, if the HbA1C is
7.0% and a repeat result is 6.8%, the diagnosis of diabetes is confirmed.
However, if two different tests (such as HbA1C and FPG) are both above the diagnostic threshold values, the diagnosis of diabetes is also confirmed. On the other hand, if two different tests are available in an individual and the results are discordant, the test whose result is above the diagnostic cut point should be repeated, and the diagnosis is made based on the confirmed test.
Criteria for the diagnosis of diabetes – ADA 2014(2)
HbA1C ≥ . . The test should be performed in a laboratory using a method that is NGSP certified and standardized DCCT assay.#
OR
FPG ≥ mg/dl. Fasting is defined as no caloric intake for at least past hrs.#
OR
Two-Hours PG ≥ mg/dl during an OGTT. The test should be performed as described by the WHO, using a glucose load containing the equivalent of 75g anhydrous glucose dissolved in water.#
OR
In a patient with classic symptoms of hyperglycemia or hyperglycemic crisis, a random plasma
glucose ≥ mg/dl
# In the absence of unequivocal hyperglycemia, result should be confirmed by repeat testing.
METHODS AND MATERIALS:
Study Design: This was a cross sectional study done at Bowring and Lady Curzon Hospital and Victoria Hospital, Bangalore between the time period November 2012 to July 2013 on randomly selected individuals who were not known diabetic patients. The individuals were first tested for fasting blood glucose and then two-hours PPG levels. HbA1c was estimated subsequently for the first 150 newly detected diabetic patients using the blood glucose criteria.
Inclusion Criteria:
J of Evolution of Med and Dent Sci/ eISSN- 2278-4802, pISSN- 2278-4748/ Vol. 3/ Issue 23/June 09, 2014 Page 6437
Exclusion Criteria:
Patients with anemia, malaria, and history of haemoglobinopathies. Patients with dyslipidemia.
Patients with hepatic and renal dysfunction. Patients with thyroid dysfunction.
Investigations Done:
Complete Blood count. Peripheral smear. Fasting blood sugar. Two-Hours PPG.
Glycosylated Haemoglobin levels using immunoturbido metric method. Liver function test.
Renal function test. TSH.
Lipid profile.
Statistical Methods: Descriptive and inferential statistical analysis has been carried out in the present study. Results on continuous measurements are presented on Mean SD (Min-Max) and results on categorical measurements are presented in number (%). Significance is assessed at 5% level of significance.
Chi-square/ Fisher Exact test has been used to find the significance of study parameters on categorical scale between two or more groups. Diagnostic statistics viz. Sensitivity, Specificity, PPV, NPV and accuracy have been computed to find the correlation of FBS with different levels of HbA1c.
Statistical software: The Statistical software namely SAS 9.2, SPSS 15.0, Stata 10.1, Med Calc 9.0.1, Systat 12.0 and R environment ver.2.11.1 were used for the analysis of the data and Microsoft word and Excel have been used to generate graphs, tables etc.
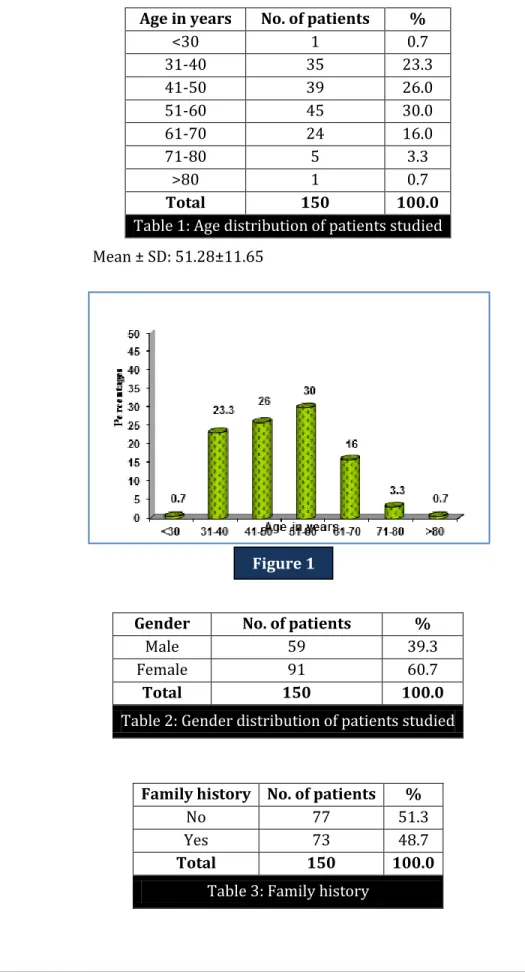
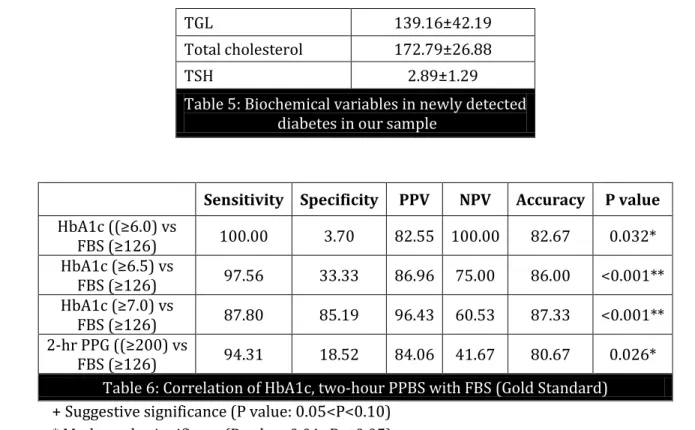
RESULTS: A total of 150 newly detected diabetic patients were studied. The mean age was 51.28±11.65 (Table 1) with 39.3% males and 60.7% females (Table.2). 48.7% patients had a positive family history. The mean elevated FBG and two-hours PPG was 190.14±77.89 and 301.02±102.85 mg/dl respectively. The mean HbA1C in newly detected diabetes was 8.65±2.15 % (Table.4). The sensitivity and specificity of HbA1C at the ADA recommended ≥ . % cut off value in newly detected diabetic patients was 97.56% and 33.33% respectively with a positive predictive value of 86.96 % and a negative predictive value of 75.00 % at p<0.001.
J of Evolution of Med and Dent Sci/ eISSN- 2278-4802, pISSN- 2278-4748/ Vol. 3/ Issue 23/June 09, 2014 Page 6438
Age in years No. of patients %
<30 1 0.7
31-40 35 23.3
41-50 39 26.0
51-60 45 30.0
61-70 24 16.0
71-80 5 3.3
>80 1 0.7
Total 150 100.0
Table 1: Age distribution of patients studied
Mean ± SD: 51.28±11.65
Gender No. of patients %
Male 59 39.3
Female 91 60.7
Total 150 100.0
Table 2: Gender distribution of patients studied
Family history No. of patients %
No 77 51.3
Yes 73 48.7
Total 150 100.0
Table 3: Family history
J of Evolution of Med and Dent Sci/ eISSN- 2278-4802, pISSN- 2278-4748/ Vol. 3/ Issue 23/June 09, 2014 Page 6439
No. of patients
(n=150) % Mean ± SD FBG
<126 27 18.0
190.14±77.89
126-200 68 45.3
>200 55 36.7
Two-Hour PG
<200 13 8.7
301.02±102.85
200-240 38 25.3
>240 99 66.0
HbA1c
5.7-6.4 12 8.0
8.65±2.15
6.5-7.0 33 22.0
7.1-8.0 33 22.0
8.1-9.0 23 15.3
>9.0 49 32.7
Table 4: Blood glucose and HbA1C parameters
Mean ± SD
Hemoglobin 13.09±1.41
MCV 88.75±4.59
MCH 30.24±2.36
MCHC 31.41±1.71
Total count 7925.92±2859.19
ESR 15.66±8.03
Urea 29.06±16.17
Creatinine 0.71±0.39
Total bilirubin 0.79±0.72 Direct bilirubin 0.21±0.14
SGOT 31.15±12.27
SGPT 32.50±14.89
ALP 53.72±34.04
Total Protein 6.91±0.53
Albumin 3.55±0.55
Globulin 3.36±0.52
LDL 111.65±29.41
HDL 37.25±10.15
J of Evolution of Med and Dent Sci/ eISSN- 2278-4802, pISSN- 2278-4748/ Vol. 3/ Issue 23/June 09, 2014 Page 6440
Sensitivity Specificity PPV NPV Accuracy P value
(bA c ≥ . vs
FBS ≥ 100.00 3.70 82.55 100.00 82.67 0.032*
(bA c ≥ . vs
FBS ≥ 97.56 33.33 86.96 75.00 86.00 <0.001**
(bA c ≥ . vs
FBS ≥ 87.80 85.19 96.43 60.53 87.33 <0.001**
2-hr PPG ≥ vs
FBS ≥ 94.31 18.52 84.06 41.67 80.67 0.026*
Table 6: Correlation of HbA1c, two-hour PPBS with FBS (Gold Standard)
+ Suggestive significance (P value: 0.05<P<0.10) * Moderately significant (P value: 0.01<P 0.05) ** Strongly significant (P value: P 0.01)
TGL 139.16±42.19
Total cholesterol 172.79±26.88
TSH 2.89±1.29
Table 5: Biochemical variables in newly detected diabetes in our sample
J of Evolution of Med and Dent Sci/ eISSN- 2278-4802, pISSN- 2278-4748/ Vol. 3/ Issue 23/June 09, 2014 Page 6441
DISCUSSION:
Glycosylated Haemoglobin(6): Hemoglobin is made up of two globin dimers, each with an associated heme moiety. In most adults, of the total Hb, HbA ( 2, 2) comprises 97%, A2 ( 2, 2) comprises 1.5– 3.5%, and fetal haemoglobin (HbF; , forms < %. These percentages may change with certain hemoglobinopathies. For example, HbF levels are increased in the presence of hereditary persistence of HbF, -thalassemia, sickle cell disease, pregnancy, anemia, and certain leukemias. Levels may also be increased in hospitalized patients.
The components of HbA were identified by charge separation on cation exchange resin and named according to their order of elution as follows: A0, A1a, A1b, and A1c. A1c is the Hb component that is composed chiefly of glycohemoglobin. Glycohemoglobin is formed by the non-enzymatic glycation of the N-terminal valine on the chain of Hb. HbA1c levels may vary with patients’ race/ethnicity.(7,8)
Pros and cons of blood glucose and HbA1C: Blood sugar levels are easily measured and cost effective. It also reflects the pathophysiology of diabetes better. Assays used for estimation of blood sugar levels are time tested and well standardized.(9) Blood sugars are not affected by erythrocyte
turnover and can be used in patients with dyslipidemia, hepatic, renal or thyroid dysfunction. It is also widely available in the primary health care set up and can be used to effectively diagnose diabetes in the large rural Indian population.
Blood sugar estimates though require stringent 8 hours fasting. This is usually not achieved as most of our population is unaware and do not adhere to the fasting requirements. Also evening or early morning exercise prior to drawing blood sample may lead to spuriously lower estimates.(9)
A1C reflects the average plasma glucose over the past 8 to 12 weeks and captures chronic hyperglycemia. It can be done at any time of the day and does not require fasting. It reflects the glycation of proteins and hence correlates with micro and macro vascular complications which are due to glycation of proteins. It can also pick up diabetes patients who are more vulnerable to protein glycation and hence complications.(9) Also A1c is not affected by concurrent stress, diet, exercise or
smoking. Baseline A1C can be used for further monitoring of diabetes treatment and glycemic control. Assays for A1C have been standardized better nowadays.
A1C measurements are expensive and not widely available especially in the Indian context. Haemoglobinopathies though having a low prevalence of 3 to 4% in India,(10) interfere with A1C
measurement. A1C is also affected by other conditions with accelerated red cell turnover like malaria, anemia. Chronic liver disease affects erythropoiesis and leads to decreased A1C while chronic kidney disease increases glycation and hence A1C. Hypertriglyceridemia can interefere with the assay with reduced A1C. Hypothyroidism on the other hand gives elevated A1C levels.(6)
Comparison with other studies: N(ANES study in USA showed that a (bA C cut point of ≥ . %
identifies one-third fewer cases of diabetes than a fasting glucose.(11) The Strong Heart Study in USA
concluded that using HbA1c alone in initial diabetes screening identifies fewer cases of diabetes than FPG while using both criteria may identify more people at risk.(12) A Korean Study concluded that the
agreement between the fasting plasma glucose and HbA1c for the diagnosis of diabetes was moderate for Korean adults with a kappa index of 0.50.(13) The New Hoorn Study in Netherland also showed
J of Evolution of Med and Dent Sci/ eISSN- 2278-4802, pISSN- 2278-4748/ Vol. 3/ Issue 23/June 09, 2014 Page 6442 HbA1C level of ≥5.8%, representing 12% of the population, had the highest combination of sensitivity (72%) and specificity (91%) for identifying newly diagnosed diabetes.(14) Indian studies are yet to be
done.
CONCLUSION: Our study shows that HbA1C can be used along with blood sugar estimation but is not superior enough to replace blood sugar estimation. Cost and standardisation of HbA1C assays is a big hurdle in the Indian context. Also the sensitivity and specificity of the HbA1C is similar to 2hrs plasma glucose estimates. Hence, the question remains if we should subject our population to an expensive diagnostic test. Blood sugars on the other hand are widely available in the primary health care set up and are cost effective. It is not affected by erythrocyte turnover and can be used in patients with dyslipidemia, hepatic, renal or thyroid dysfunction.
Future research Opportunities:
Larger studies are required to support or refute the above conclusion. Ideal HbA1C context in the Indian population??
Effect of anemia, dyslipidemia, hepatic, renal or thyroid dysfunction on HbA1C estimates and its impact on the diagnosis of diabetes.
REFERENCES:
1. Mohan V, Sandeep S, Deepa R, Shah B, Varghese C. Epidemiology of type 2 diabetes: Indian scenario. Indian J Med Res2007; 125; 217-230.
2. American Diabetes Association. Standards of Medical Care in Diabetes-2014. Diabetes Care 2014; 37(Suppl. 1): S14–S80.
3. Use of Glycated Haemoglobin in Diagnosis of Diabetes Mellitus – Abbreviated Report of a WHO Consultation. WHO/NMH/CHP/CPM/11.1.
4. American Diabetes Association. Diagnosis and classification of diabetes mellitus. Diabetes Care 2010; 33 (Suppl. 1): S62–S69.
5. International Expert Committee. International Expert Committee report on the role of the A1C assay in the diagnosis of diabetes. Diabetes Care 2009; 32: 1327–1334
6. Gallagher EJ, Le Rohit D, Bloomgarden ZT. Review of hemoglobin A1c in the management of diabetes. Journal of Diabetes, 2009; 1; 9–17.
7. Ziemer DC, Kolm P, Weintraub WS, et al. Glucose-independent, black-white differences in hemoglobin A1c levels: a cross-sectional analysis of 2 studies. Ann Intern Med 2010; 152: 770–777.
8. Kumar PR, Bhansali A, Ravikiran M, et al. Utility of glycated emoglobin in diagnosing type 2 diabetes mellitus:a community-based study. J Clin Endocrinol Metab 2010; 95: 2832–2835 9. Enzo Bonora, Jaakko Tuomilehto. The Pros and Cons of Diagnosing Diabetes with A1C.
Diabetes Care 2011.
J of Evolution of Med and Dent Sci/ eISSN- 2278-4802, pISSN- 2278-4748/ Vol. 3/ Issue 23/June 09, 2014 Page 6443 11.Catherine et al. Prevalence of Diabetes and High Risk for Diabetes Using A1C Criteria in the
U.S. Population in 1988–2006. Diabetes Care 2010; 33: 562–568.
12.Wenyu Wang et al. Fasting Plasma Glucose and Hemoglobin A1c in Identifying and Predicting Diabetes. Diabetes Care 2011; 34: 363–368.
13.Woo-Jun Yun1 et al. A Comparison of Fasting Glucose and HbA1c for the Diagnosis of Diabetes Mellitus among Korean Adults. Journal of Preventive Medicine and Public Health 2010; 10.3961/jpmph. 2010; 43.5.451.
15.Riet E, Alssema M, Rilkelilkhuizen JM, Kostense PJ, Nijpels G et al. Relationship between A1C and Glucose Levels in the General Dutch Population. Diabetes Care 2010; 33:61-66.
16.Rohlfing CL, Wiedmeyer H, Little R, England JD, Tennill A et al. Defining the Relationship Between Plasma Glucose and HbA1c -Analysis of glucose profiles and HbA1c in the Diabetes Control and Complications Trial. Diabetes Care 2002; 25: 275–278.
17.Bernard Rosner (2000), Fundamentals of Biostatistics, 5th Edition, Duxbury, 80-240.
18.Robert H Riffenburg (2005), Statistics in Medicine, second edition, Academic press. 85-125. 19.Rao PSS, Richard J. An Introduction to Biostatistics, a manual for students in health sciences.
Prentice hall of India, 4th edition; 86-160.
20.Griner PF, Mayewski RJ, Mushlin AI, Greenland P Selection and interpretation of diagnostic tests and procedures. Annals of Internal Medicine 1981; 94: 555-600.
21.Suresh KP, Chandrasekhar S. Sample Size estimation and Power analysis for Clinical research studies. Journal Human Reproduction Science 2012; 1:7-13.
AUTHORS:
1. Kavya S. T. 2. Nagaraja B. S. 3. Akila V.
4. G. Chandra Mohan 5. Prakash Kikker Gowdaiah
PARTICULARS OF CONTRIBUTORS:
1. Associate Professor, Department of Medicine, BMCRI, Bangalore.
2. Professor, Department of Medicine, BMCRI, Bangalore.
3. Post Graduate Student, Department of Medicine, BMCRI, Bangalore.
4. Post Graduate Student, Department of Medicine, BMCRI, Bangalore.
5. Associate Professor, Department of Medicine, BMCRI, Bangalore.
NAME ADDRESS EMAIL ID OF THE CORRESPONDING AUTHOR:
Dr. Akila V, Post Graduate,
Department of Internal Medicine, Bangalore Medical College & Research Institute, Bangalore. E-mail: [email protected]