Cop
yright
© AE&M all rights r
eser
ved.
1 Centro de Referência de
Neurofibromatose, Universidade Federal de Minas Gerais (UFMG), Belo Horizonte, MG, Brasil
2 Departamento de Nutrição,
Universidade Federal de Minas Gerais (UFMG), Belo Horizonte, MG, Brasil
3 Departamento de Clínica
Médica, Universidade Federal de Minas Gerais (UFMG), Belo Horizonte, MG, Brasil
Correspondence to: Nilton Alves de Rezende Centro de Referência de Neurofibromatose,
Departamento de Medicina Interna, Universidade Federal de Minas Gerais Alameda Álvaro Celso, 55
30150-260 – Belo Horizonte, MG, Brasil
[email protected] Received on Dec/22/2016 Accepted on Jun/12/2017
DOI: 10.20945/2359-3997000000007
in individuals with
neurofibromatosis type 1
Aline Stangherlin Martins1, Ann Kristine Jansen2,
Luiz Oswaldo Carneiro Rodrigues1, Camila Maria Matos1,
Marcio Leandro Ribeiro Souza1, Débora Marques Miranda3,
Nilton Alves de Rezende1
ABSTRACT
Objects: To compare insulin resistance (IR) and metabolic aspects of patients with neurofibromatosis type 1 (NF1) and individuals without the disease. Subjects and methods: Forty patients with NF1 were matched by sex, age, and body mass index (BMI) to 40 controls from the community. Blood samples were collected for biochemical assessment. Homeostasis model assessment adiponectin (HOMA-AD), Homeostasis model assessment insulin resistance (HOMA-IR), and adiponectin/leptin ratio (ALR) were used to identify IR. Results: The median HOMA-IR values were similar between the groups. However, the HOMA-AD value was significantly lower and the ALR significantly higher in the NF1 group. Fasting blood glucose (FBG), leptin, and visfatin levels of patients with NF1 were significantly lower, although adiponectin levels were significantly higher than those in the controls. Fasting insulin and blood glucose levels 2 hours after administration of 75 g of dextrose, glycated hemoglobin, and resistin showed no significant differences between groups. The HOMA-AD correlated with BMI, FBG, blood glucose levels 2 hours after administration of 75 g of dextrose, fasting insulin, glycated hemoglobin, adiponectin, leptin, visfatin, ALR, and HOMA-IR. The ALR correlated with BMI leptin, visfatin, and adiponectin. Conclusions: Lower levels of FBG, leptin, visfatin, and HOMA-AD, and higher adiponectin levels and ALR may be related to increased insulin sensitivity and lower occurrence of type 2 diabetes mellitus in patients with NF1. Arch Endocrinol Metab. 2018;62(1):34-9
Keywords
Blood glucose; neurofibromatosis 1; diabetes mellitus; type 2; insulin resistance
INTRODUCTION
A
rare disease is generally defined as a disease with a very low prevalence (1). Although considered individually rare, as a group, these diseases affect a significant percentage of the population and present a relevant health problem (2). Therefore, research is needed to better understand these diseases.Neurofibromatosis type 1 (NF1) is a rare, autosomal-dominant disorder caused by inherited or new mutations on chromosome 17. These mutations result in dysfunction of the neurofibromin protein, which is involved in growth control and behavior of various tissues (3). It is one the most common human monogenic diseases, with an estimated prevalence of approximately 1: 3,500 births (4).
The clinical NF1 criteria include café-au-lait spots, neurofibromas, axillary and/or inguinal freckling, Lisch nodules in the iris, optical gliomas, specific bone
dysplasia, and familial history (5). NF1 is a multisystem disease, affecting the musculoskeletal, cardiovascular, endocrine, and central and peripheral nervous systems as well as learning skills (6).
Data suggest a lower prevalence of type 2 diabetes mellitus (T2DM) in patients with NF1 (7,8). Madubata and cols. (9) showed that patients with NF1 had a lower chance of having DM compared to healthy individuals. Moreover, Martins and cols. (10) reported that patients with NF1 showed significantly lower fasting blood glucose (FBG) levels compared to controls without the disease.
Cop
yright
© AE&M all rights r
eser
ved.
IR validated index is the homeostasis model assessment for insulin resistance (HOMA-IR) (13). This index shows a strong correlation with hyperinsulinemic euglycemic clamp findings (14). However, there is some debate regarding its ability to detect IR in individuals with normal glucose or impaired glucose tolerance (15).
Matsuhisa and cols. (16) developed a modified HOMA index, the HOMA-adiponectin (HOMA-AD), by including adiponectin levels in the denominator. This modification makes the HOMA index a more sensitive marker of IR (16,17).
Mediators produced by adipose tissue, called adipocytokines (leptin, visfatin, resistin, and adiponectin) affect glucose homeostasis, appetite regulation, inflammation, and atherosclerosis and are associated with IR (18). Studies have shown increased levels of leptin, visfatin, and resistin in individuals with T2DM (18). In contrast, adiponectin levels are reportedly lower in patients with DM and metabolic syndrome (19) and studies have shown that their levels may be markers of the risk of prediabetes (20).
In addition, some studies have suggested that the adiponectin-leptin ratio (ALR) may be an effective parameter for the assessment of IR in individuals with or without diabetes (21).
The results of previous studies lead us to hypothesize that patients with NF1 may have (1) genetic differences that modify glucose utilization and cellular control and/or (2) phenotypic characteristics that result in increased insulin sensitivity, favoring the maintenance of lower levels of FBG and reducing the risk of developing T2DM. Thus, this study aimed to evaluate IR and metabolic aspects of patients with NF1 compared with control individuals without the disease.
MATERIALS AND METHODS
Population
The study included patients over 20 years of age with NF1 followed at the Reference Center on Neurofibromatoses at the Federal University of Minas Gerais (CRNF-UFMG) who met at least three criteria for the diagnosis of disease according to the National Institute of Health (22).
The control group consisted of volunteers from the community (e.g., university students, CRNF-UFMG officials, and companions of patients seen at the clinic)
who were similar in terms of sex, age, and BMI to the included patients with NF1.
Individuals diagnosed with diabetes, liver disease or malignancy, and infection as well as those using steroids, antibiotics, statins, insulin, and oral hypoglycemic agents were excluded from both groups.
Sample
The sample size was calculated based on the results of the study by Martins and cols. (10), and we used a standard deviation of 13 units, a least significant difference of 10 units, and power of 90%, resulting in the requirement for a minimum of 37 participants in each group.
Ethical aspects
The study was approved by the Ethics and Human Research of the UFMG (number 258.325, year 2013) and all participants signed an informed consent form.
Procedures
Weight and height of the participants were measured, and BMI calculated based on protocols established by the World Health Organization (23).
We assessed the physical activity level by the International Physical Activity Questionnaire (24) and the diet by means of a 3-day non-consecutive dietary record. For each record, the total amounts of the following components were calculated using the food composition tables: calories, carbohydrates, lipids, proteins, fiber, cholesterol, saturated fatty acids, monounsaturated and polyunsaturated fatty acids, zinc, magnesium, selenium, and vitamin D.
Blood samples were collected from the partici-pants for analysis of FBG, blood glucose 2 hours after administration of 75 g of dextrose, glycated hemoglo-bin (HbA1c), and fasting insulin, adiponectin, leptin, visfatin, and resistin according to the protocol used at the CRNF-UFMG.
Blood glucose and glycosylated hemoglobin (HbA1c) levels were measured using the Vitros equipment and
reagents from Ortho-Clinical Diagnostics® (blood
glucose coefficient of variation [CV] inter-assay, level 1: 2.24% and level 2: 2.23%; HbA1c CV, level 1: 5.11% and level 2: 6.04%). Insulin levels were measured using the Architect-Abbott® equipment, with Abbott®
Cop
yright
© AE&M all rights r
eser
ved.
The leptin assay was performed using the human leptin enzyme-linked immunoassay (ELISA) kit from Millipore (CV inter-assay: 3.7%; CV intra-assay: 4.4%, respectively). Resistin levels were measured using the
human resistin ELISA from eBioscience® (CV
inter-assay: 8.1%; CV intra-inter-assay: 5.1%). Adiponectin levels were measured using the human adiponectin ELISA kit from eBioscience® (CV inter-assay: 3.1%; CV
intra-assay: 4.2%, respectively). Visfatin was assayed using the
human visfatin ELISA kit from MyBioSource® (CV <
10%). The assays were performed according to the kit protocols.
FBG, HbA1c, and glucose levels 2 hours after administration of 75 g of dextrose were categorized according to the cutoff values established by the American Diabetes Association (11).
The markers of IR included the HOMA-IR (HOMA-IR = fasting insulin (U/mL) × FBG (mmol/L)/22.5), HOMA-AD (HOMA-AD = fasting insulin (U/mL) × FBG (mmol/L)/Adiponectin (μ/mL) and ALR.
Statistical analysis
Continuous variables were described as means and standard deviations or as medians and 25th and 75th
percentiles as appropriate. Categorical variables were described as absolute and relative frequencies.
The Kolmogorov-Smirnov test was used to test the normality of the variables. Paired t-tests were used to compare groups with normally distributed variables. The Wilcoxon test was used to compare groups with non-normal variables distribution. McNemar’s test was used to compare proportions between two groups. When McNemar’s test could not be used, we used chi-square or Fisher’s exact tests.
The Spearman correlation test was used to verify the correlations between HOMA-AD and ALR and other variables.
To determine whether the differences and associations were statistically significant, we used a 5% level of significance. Thus, P-values ≤ 0.05 were considered to represent statistically significant differences.
Data were analyzed using the Statistical Package for Social Science (SPSS) version 13.0.
RESULTS
We evaluated 47 patients with NF1 and 47 controls. Seven individuals were excluded from the NF1
group (one because of the use of corticosteroids, one because of suspicion of malignancy, and five owing to unavailability of blood test results). The respective controls were also excluded, finally amounting to 40 participants in each group.
The general characteristics of patients with NF1 and controls are described in Table 1. The average weight and the median height were significantly lower in the NF1 group.
Table 1. General characteristics of patients with NF1 and controls
Variables NF1 (n = 40) Controls (n = 40) P-value
Sexa
Female 28 (70.0) 28 (70.0) 1.000d
Male 12 (30.0) 12 (30.0)
Ageb 40.7 (11.8) 40.4 (12.1) 0.390e
Weight (kg)b 60.6 (13.1) 68.5 (14.5) < 0.001e
Height (m)c 1.57 (1.51–1.63) 1.62 (1.57–1.74) < 0.001f
BMI (kg/m2)c 24.2 (21.6–26.2) 24.6 (22.3–26.5) 0.096f
Physical activity level*
Not active 9 (22.5) 14 (35)
0.343d
Not very active 3 (7.5) 5 (12.5)
Moderately active 28 (70) 21 (52.5)
a n (%); b Mean (standard deviation); c Median (percentiles 25-75); d McNemar’s test; e Paired
t-test; f Wilcoxon Test; BMI: body mass index. *According to the International Physical Activity Questionnaire (25).
There were no statistically significant differences between the NF1 and control groups regarding the intake of any of the evaluated nutrients.
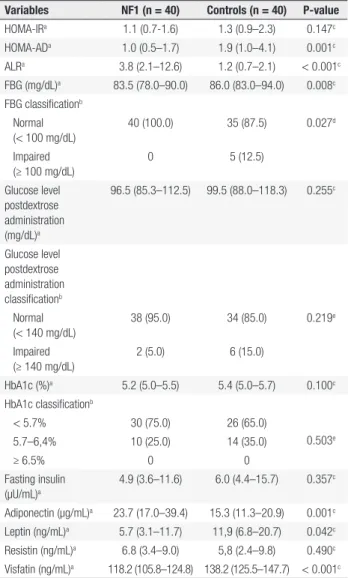
Table 2 shows the IR markers and metabolic characteristics of patients with NF1 and controls. The HOMA-IR values were similar between groups. However, the HOMA-AD value was significantly lower and ALR was significantly higher in the NF1 group. The FBG, leptin, and visfatin levels in patients with NF1 were significantly lower than those in controls. The adiponectin levels was significantly higher in the NF1 group. No significant differences were observed between groups in the levels of resistin, post dextrose glucose, HbA1c, and fasting insulin.
The HOMA-AD values were correlated with BMI, FBG, post dextrose glucose, fasting insulin HbA1c, adiponectin, leptin, and visfatin levels, as well as ALR and HOMA-IR values (Table 3).
Cop
yright
© AE&M all rights r
eser
ved.
DISCUSSION
The results of the present study revealed that HOMA-IR was similar between the NF1 and control groups. However, the HOMA-AD values were significantly lower in patients with NF1 than those in the control group. FBG, leptin, and visfatin levels were significantly lower and adiponectin levels and ALR were significantly higher in patients with NF1 than those in the control group.
While the HOMA-IR is the most widely used index for the determination of IR, some authors have reported that this index fails to identify IR in individuals with normal glucose levels and impaired glucose tolerance (15). In this study, 100% of patients with NF1 showed FBG within normal levels and only 12.5% of controls had impaired FBG levels. Thus, the HOMA-IR may not be the most appropriate method for identifying IR in patients with NF1, in this sample.
HOMA-AD has been reported to be a suitable method for identifying IR in specific populations, and some authors consider it a more sensitive marker of IR (16,17). The results of this study revealed a significantly lower median HOMA-AD level in the NF1 group, suggesting that these patients may have greater insulin sensitivity than controls.
The ALR has also been reported to be a more efficient marker of IR than HOMA-IR, showing an inverse correlation with IR markers (21). In the present study, ALR was significantly higher in patients with NF1, also suggesting a greater sensitivity to insulin in this group of patients.
The mechanisms to explain increased insulin sensitivity in individuals with NF1 are unknown. It is known that excess adipose tissue plays an essential role in the development of IR. However, Pal and cols. (25) demonstrated that patients with mutations in the tumor suppressor phosphatase and tensin homologue, which causes a syndrome of predisposition to cancer, have increased insulin sensitivity and excess weight compared to controls. The authors have also shown that the excess weight found in the patients was not due to increased lean or bone mass, but rather to increased adiposity, and suggest that the excess weight may be due to the improved action of insulin in the adipose tissue.
Studies have shown that suppression of lipolysis is highly sensitive to insulin (26). This way, considering the conclusions of these studies, patients with NF1 who exhibit insulin sensitivity could be obese. However, our patients had BMI within the normal range, and other Table 2. Insulin resistance markers and metabolic characteristics of
patients with NF1 and controls
Variables NF1 (n = 40) Controls (n = 40) P-value
HOMA-IRa 1.1 (0.7-1.6) 1.3 (0.9–2.3) 0.147c
HOMA-ADa 1.0 (0.5–1.7) 1.9 (1.0–4.1) 0.001c
ALRa 3.8 (2.1–12.6) 1.2 (0.7–2.1) < 0.001c
FBG (mg/dL)a 83.5 (78.0–90.0) 86.0 (83.0–94.0) 0.008c
FBG classificationb
Normal (< 100 mg/dL)
40 (100.0) 35 (87.5) 0.027d
Impaired (≥ 100 mg/dL)
0 5 (12.5)
Glucose level postdextrose administration (mg/dL)a
96.5 (85.3–112.5) 99.5 (88.0–118.3) 0.255c
Glucose level postdextrose administration classificationb
Normal (< 140 mg/dL)
38 (95.0) 34 (85.0) 0.219e
Impaired (≥ 140 mg/dL)
2 (5.0) 6 (15.0)
HbA1c (%)a 5.2 (5.0–5.5) 5.4 (5.0–5.7) 0.100c
HbA1c classificationb
< 5.7% 30 (75.0) 26 (65.0)
0.503e
5.7–6,4% 10 (25.0) 14 (35.0)
≥ 6.5% 0 0
Fasting insulin (µU/mL)a
4.9 (3.6–11.6) 6.0 (4.4–15.7) 0.357c
Adiponectin (µg/mL)a 23.7 (17.0–39.4) 15.3 (11.3–20.9) 0.001c
Leptin (ng/mL)a 5.7 (3.1–11.7) 11,9 (6.8–20.7) 0.042c
Resistin (ng/mL)a 6.8 (3.4–9.0) 5,8 (2.4–9.8) 0.490c
Visfatin (ng/mL)a 118.2 (105.8–124.8) 138.2 (125.5–147.7) < 0.001c
a Median (percentiles 25 and 75); b n (%); c Wilcoxon test; d Fisher’s exact test; e McNemar’s test.
HOMA-IR: Homeostasis Model Assessment Insulin Resistance; HOMA-AD: Homeostasis Model Assessment Adiponectin; FBG: fasting blood glucose; HbA1c: glycated hemoglobin; ALR: adiponectin-leptin ratio.
Table 3. Variables significantly correlated with HOMA-AD values in all study participants (n = 80)
Variable Correlation coefficienta P-value
BMI 0.349 0.002
FBG 0.448 < 0.001
Fasting insulin 0.667 < 0.001
Post dextrose glucose 0.388 < 0.001
HbA1c 0.315 0.004
Adiponectin -0.662 < 0.001
Leptin 0.300 0.007
Visfatin 0.269 0.016
ALR -0.547 < 0.001
HOMA-IR 0.700 < 0.001
a Spearman correlation coefficient; FBG: fasting blood glucose; HbA1c: glycated hemoglobin;
Cop
yright
© AE&M all rights r
eser
ved.
studies have already demonstrated a lower BMI in NF1 patients, contradicting the findings of Pal and cols. Two hypotheses could explain these findings, insulin sensitivity in individuals with NF1 may be mild, and it may not be sufficient to induce obesity or insulin sensitivity that is specific to non-fat tissues.
We believe that the characteristics of body composi-tion in NFI patients, demonstrated in other studies (27) and associated with increased adiponectin and lower vis-fatin and leptin levels, may be related to higher insulin sensitivity found in this group of individuals.
Regarding metabolic characteristics, the median values of FBG in patients with NF1 were significantly lower than those in control individuals; the number of individuals with impaired FBG was also significantly lower in the NF1 group than in the control group. These data agree with a previous study by our group (10), which evaluated 57 patients with NF1 and 171 controls and found significantly lower levels of FBG in patients with NF1.
HbA1c, blood glucose 2 hours after administration of dextrosol, and fasting insulin levels were also similar between the groups, suggesting that some mechanism involved in the control of fasting glucose may be responsible for the lower levels of FBG in the NF1 group. After a prolonged period of fasting, glucose levels in the blood decline, stimulating the pancreatic alpha cells to release glucagon. The result is hepatic glycogenolysis and gluconeogenesis to increase blood glucose levels (28). Thus, we hypothesize that the lower levels of FBG in NF1 could be a result of a change in the glycogenolysis or gluconeogenesis process.
Neurofibromin plays a role in the regulation of the hypothalamus and pituitary gland (29), which are involved in the regulation of energy balance (30). Neurofibromin could play a role in glucose metabolism, and its deficiency may cause reduced gluconeogenesis in patients with NF1. Moreover, the modified pathways resulting in insulin changes related to neurofibromin are not clear.
A second hypothesis to explain the lower levels of FBG in patients with NF1 is derivate of the production of insulin-like growth factor 2 (IGF2) by neurofibromas. Studies have shown that tumors produce IGF2, which increases the consumption of peripheral glucose and decreases the glucose production in the liver, resulting in hypoglycemia (31). However, further studies are needed to verify if the FBG levels in patients with NF1 can be accounted for by IGF2 produced by neurofibromas.
A third hypothesis that could explain the lower fasting glucose levels in patients with NF1 is related to adipocytokine levels. The results of this study showed that adiponectin levels in patients with NF1 were significantly higher and levels of visfatin and leptin were significantly lower than in controls. According to Yamauchi and cols. (32) one of the mechanisms through which adiponectin may decrease the risk of T2DM is the suppression of hepatic gluconeogenesis. Leptin can reduce hepatic glucose production by decreasing the synthesis of phosphoenolpyruvate carboxylase, which is the key enzyme in gluconeogenesis (33). However, Gutiérrez-Juárez and cols. (34) showed that administration of leptin in rats stimulated gluconeogenesis. Visfatin, in turn, appears to stimulate gluconeogenesis (35).
Thus, differences in the levels of these adipocytokines may contribute to lower hepatic gluconeogenesis and lower levels of FBG in patients with NF1. However, further studies are needed to validate this hypothesis. The reason for the changes in the levels of these adipocytokines in patients with NF1 remains unknown. No other studies have evaluated adipocytokine levels in NF1.
The correlation of HOMA-AD values with diabetes mellitus markers, FBG, post dextrose glucose, and HbA1c in addition to HOMA-IR values, levels of adiponectin, leptin, and visfatin, and ALR reinforce the hypothesis that the characteristics observed in patients with NF1 (lower levels of FBG, visfatin, and leptin and higher adiponectin and adiponectin/leptin levels) may explain the lower incidence of T2DM in these patients.
This study has several limitations, including the small number of patients involved, although NF1 is a rare disease for which surveys are usually performed with even fewer participants. In addition, IR was not evaluated using the gold-standard techniques.
In conclusion, the results of this matched case-control study suggested for the first time that NF1 individuals have increased insulin sensitivity, as well as lower levels of FBG, visfatin, and leptin and higher adiponectin levels, than those without the disease. These characteristics may be associated with the lower occurrence of T2DM in this group of patients.
Acknowledgments: we thank the patients of CRNF-UFMG, the volunteers who participated in the study, the researchers, and stu-dents of the Molecular Medicine Laboratory of University Fede-ral of Minas Gerais, and the employees of CRNF-MG for their collaboration.
Cop
yright
© AE&M all rights r
eser
ved.
and Fapemig (No. APQ-00928-11 and No. PPM-00120-14). ASM received a grant from Coordination for Improvement of Personnel with Higher Education.
Disclosure: no potential conflict of interest relevant to this article was reported.
REFERENCES
1. Denis A, Simoens S, Fostier C, Mergaert L, Cleemput I. Policies for rare diseases and orphan drugs. Health Technology Assessment (HTA). Brussels: Belgian Health Care Knowledge Centre (KCE) 2009. KCE reports 112C (D/2009/10.273/32).
2. Brasil. Ministério da Saúde. Diretrizes para Atenção Integral às Pessoas com Doenças Raras no Sistema Único de Saúde. Ministério da Saúde; 2014.
3. Riccardi VM. Neurofibromatosis type 1 is a disorder of dysplasia: the importance of distinguishing features, consequences, and complications. Birth Defects Res A Clin Mol Teratol. 2010;88(1):9-14. 4. Radtke HB, Sebold CD, Allison C, Haidle JL, Schneider G.
Neurofibromatosis type 1 in genetic counseling practice: recommendations of the National Society of Genetic Counselors. J Genet Couns. 2007;16(4):387-407.
5. Rodrigues LO, Batista PB, Goloni-Bertollo EM, de Souza-Costa D, Eliam L, Eliam M, et al. Neurofibromatoses: part 1 - diagnosis and differential diagnosis. Arq Neuropsiquiatr. 2014;72(3):241-50. 6. Souza JF, Toledo LL, Ferreira MC, Rodrigues LO, Rezende NA. Neurofibromatosis type 1: more frequent and severe then usually thought. Rev Assoc Med Bras (1992). 2009;55(4):394-9.
7. Rasmussen SA, Yang Q, Friedman JA. Mortality in neurofibromatosis 1: an analysis using U.S. death certificates. Am J Hum Genet. 2001;68(5):1110-8.
8. Masocco M, Kodra Y, Vichi M, Conti S, Kanieff M, Pace M, et al. Mortality associated with neurofibromatosis type 1: a study based on Italian death certificates (1995-2006). Orphanet J Rare Dis. 2011 Mar 25;6:11.
9. Madubata CC, Olsen MA, Stwalley DL, Gutmann DH, Johnson KJ. Neurofibromatosis type 1 and chronic neurological conditions in the United States: an administrative claims analysis. Genet Med. 2015;17(1):36-42.
10. Martins AS, Jansen AK, Rodrigues LO, Matos CM, Souza ML, de Souza JF, et al. Lower fasting blood glucose in neurofibromatosis type 1. Endocr Connect. 2016;5(1):28-33.
11. American Diabetes Association. Standards of medical care in diabetes. Diabetes Care. 2016;39:S1-S112.
12. Ausk KJ, Boyko EJ, Ioannou GN. Insulin resistance predicts mortality in nondiabetic individuals in the U.S.A. Diabetes Care. 2010;33(6):1179-85.
13. Matthews DR, Hosker JP, Rudenski AS, Naylor BA, Treacher DF, Turner RC. Homeostasis model assessment: insulin resistance and beta-cell function from fasting plasma glucose and insulin concentrations in man. Diabetologia. 1985;28(7):412-9.
14. Vasques AC, Rosado L, Rosado G, Ribeiro RC, Francesschini S, Geloneze B. Anthropometric Indicators of Insulin Resistance. Arq Bras Cardiol. 2010;95:e14-e23.
15. Kang ES, Yun YS, Park SW, Kim HJ, Ahn CW, Song YD, et al. Limitation of the validity of the homeostasis model assessment as an index of insulin resistance in Korea. Metabolism. 2005;54(2):206-11.
16. Matsuhisa M, Yamasaki Y, Emoto M, Shimabukuro M, Ueda S, Funahashi T, et al. A novel index of insulin resistance determined from the homeostasis model assessment index and
adiponectin levels in Japanese subjects. Diabetes Res Clin Pract. 2007;77(1):151-4.
17. Vilela BS, Vasques AC, Cassani RS, Forti AC, Pareja JC, Tambascia MA, et al. The HOMA-Adiponectin (HOMA-AD) Closely Mirrors the HOMA-IR Index in the Screening of Insulin Resistance in the Brazilian Metabolic Syndrome Study (BRAMS). PLoS One. 2016;11(8):e0158751.
18. Guzik TJ, Mangalat D, Korbut RJ. Adipocytokines - novel link between inflammation and vascular function? J Physiol Pharmacol. 2006;57(4):505-28.
19. Whitehead JP, Richards AA, Hickman IJ, Macdonald GA, Prins JB. Adiponectin--a key adipokine in the metabolic syndrome. Diabetes Obes Metab. 2006;8(3):264-80.
20. Jiang Y, Owei I, Wan J, Ebenibo S, Dagogo-Jack S. Adiponectin levels predict prediabetes risk: the Pathobiology of Prediabetes in A Biracial Cohort (POP-ABC) study. BMJ Open Diabetes Res Care. 2016;4(1):e000194.
21. Jung CH, Rhee EJ, Choi JH, Bae JC, Yoo SH, Kim WJ, et al. The relationship of adiponectin/leptin ratio with homeostasis model assessment insulin resistance index and metabolic syndrome in apparently healthy korean male adults. Korean Diabetes J. 2010;34(4):237-43.
22. National Institutes of Health Neurofibromatosis. NIH Consensus Statement Online. Available from: https://consensus.nih.gov/1987/1 987neurofibromatosis064html.htm; 1987. Accessed on 10 May, 2015. 23. World Health Organization. Physical status: the use and
interpretation of anthropometry. Geneva: World Health Organization; 1995.
24. Matsudo S, Araujo T, Matsudo V, Andrade D, Andrade E, Oliveira LC, et al. Questionário Internacional de Atividade Física: Estudo de Validade e Reprodutibilidade no Brasil. Rev Bras Ativ Fis Saude. 2001;6:5-18.
25. Pal A, Barber TM, Van de Bunt M, Rudge SA, Zhang Q, Lachlan KL, et al. PTEN mutations as a cause of constitutive insulin sensitivity and obesity. N Engl J Med. 2012;367(11):1002-11.
26. Karpe F, Tan GD. Adipose tissue function in the insulin-resistance syndrome. Biochem Soc Trans. 2005;33(Pt 5):1045-8.
27. Souza M, Jansen A, Martins A, Rodrigues L, Rezende N. Body composition in adults with neurofibromatosis type 1. Rev Assoc Med Bras (1992). 2016;62(9):831-6.
28. Röder PV, Wu B, Liu Y, Han W. Pancreatic regulation of glucose homeostasis. Exp Mol Med. 2016;48:e219.
29. Hegedus B, Yeh TH, Lee DY, Emnett RJ, Li J, Gutmann DH. Neurofibromin regulates somatic growth through the hypothalamic-pituitary axis. Hum Mol Genet. 2008;17(19):2956-66. 30. Van de Sande-Lee SV, Velloso LA. Hypothalmic dysfunction in
obesity. Arq Bras Endocrinol Metabol. 2012;56(6):341-50. 31. Iglesias P, Diez JJ. Management of endocrine disease: a clinical
update on tumor-induced hypoglycemia. Eur J Endocrinol. 2014;170(4):R147-57.
32. Yamauchi T, Kamon J, Minokoshi Y, Ito Y, Waki H, Uchida S, et al. Adiponectin stimulates glucose utilization and fatty-acid oxidation by activating AMP-activated protein kinase. Nat Med. 2002;8(11):1288-95.
33. Anderwald C, Müller G, Koca G, Fürnsinn C, Waldhäusl W, Roden M. Short-term leptin-dependent inhibition of hepatic gluconeogenesis is mediated by insulin receptor substrate-2. Mol Endocrinol. 2002;16(7):1612-28.
34. Gutiérrez-Juárez R, Obici S, Rossetti L. Melanocortin-independent effects of leptin on hepatic glucose fluxes. J Biol Chem. 2004;279(48):49704-15.