MASTER THESIS:
The Future of Services
Uncovering Latent Needs Through Trend Analysis
Name: Matthijs Emile Stephan Rameckers
Date of Birth: 20th November 1990
Study Program: Double Degree Master Program
University Maastricht Master Program: Master of Science: International
Business: Strategy and Innovation
Nova Universidade de Lisboa Master Program: Master of Management
University Maastricht Student ID: I6001949
Nova Universidade de Lisboa Student ID: MST15001404
University Maastricht Supervisor: Prof. Dr. G. Odekerken-Schroder
Abstract
Reflecting an increased interest in service design and service science, this study
develops a perspective that unites the Service Dominant Logic, the principles of
service design and the foundations of market orientation in a triangular relationship. In
this approach, the premises of the SD logic are used to provide support and structure
to the principles of service design and market orientation. This perspective is used as
a backdrop for the discovery of latent needs. Using an unconventional sample of
primary school pupils, customer journey maps and critical incidents were created. The
application of these service design tools generated insights into their needs, which
could be categorized into themes and-overarching value dimensions. Four dimensions
of value were uncovered, namely a Physical, Social, Utilitarian and Hedonic
Dimension. The analysis of the correlation of these themes and dimensions leads the
Table of Content
Abstract ... 2
Table of Content ... 3
Tables and Figures ... 5
1. Introduction ... 6
2. Literature Review ... 9
2.1 Service Dominant Logic ... 10
2.2 Service Design ... 11
2.3 Principles of Service Design Thinking ... 12
2.3.1 User-Centered ... 13
2.3.2 Co-creative ... 14
2.3.3 Sequencing ... 16
2.3.4 Evidencing ... 18
2.3.5 Holistic ... 19
2.4 Classifications of Services ... 21
2.5 Market orientation ... 22
3. Methodology ... 24
3.1 Customer Journey Maps in Service Design ... 25
3.2 Sample ... 25
3.3 Services Categorization ... 26
3.4 Data Collection ... 29
3.5 Data Analysis ... 31
4. Results ... 35
4.2 Overarching Value Constructs and Themes ... 37
5. Discussion ... 44
5.1 Problems and Solutions ... 44
5.2 Overarching Value Constructs ... 47
5.3 Conceptual Model ... 50
5.5 Limitations ... 51
6. Conclusion ... 54
6.1 Theoretical contributions ... 54
6.2 Managerial Implications ... 55
6.3 Future research ... 57
Tables and Figures
FIGURE 1 – Triangular Relationship of Concepts………9
TABLE 1 – Foundational Premises of the Service Dominant Logic……….10
TABLE 2 – Principles of Service Design………..12
TABLE 3 – Foundational Premises That Are User Centered in Nature………..13
TABLE 4 – Foundational Premises That Are Co-Creative in Nature ………..14
TABLE 5 – Foundational Premises That Are Sequencing in Nature ………..16
TABLE 6 – Foundational Premises That Are Evidencing in Nature……….18
TABLE 7 – Foundational Premises That Are Holistic in Nature………...19
TABLE 8 – Stages of the Service Design Process……….25
TABLE 9 – Categorization of the Six Studied Services……….27
TABLE 10 – Customer Journey Map………32
TABLE 11 – Overview of Overarching Value Constructs and Themes…....………..34
TABLE 12 – Description of Overarching Value Constructs………...35
TABLE 13 – Frequencies of Problems and Solutions………36
TABLE 14 – Problems per Service Categorization……….36
TABLE 15 – Cross-Tabulation of Problem Natures and Solution Natures………….37
TABLE 16 – Frequencies of Overarching Value Constructs and Themes………….38
TABLE 17 – Cross-Tabulation of Overarching Value Constructs………39
TABLE 18 – Pearson’s Chi-Squared Correlations of Overarching Value Constructs ……….40
TABLE 19 – Cross-Tabulation of Themes………..42
TABLE 20 – Pearson’s Chi-Squared Correlations of Themes……….43
1.
Introduction
Services continue to play an increasingly dominant role in today’s economy, with many
countries producing more than 70% of their gross domestic product in this field (Ostrom et
al., 2010). Services have not only been given a lot of attention by practitioners but also the
academic environment has had a profound interest in this field for multiple decades
(Berry, 2002; Bitner, 1990; Cermak, File, & Prince, 2011; Day & Wensley, 1988;
Parasuraman, Zeithaml, & Berry, 1985). Services will thus continue to interest and
challenge both practitioners and academics (Grove, Fisk, & John, 2003; Ostrom et al.,
2010).
The growing importance attached to services plays a motivating role for companies going
through servitization. Servitization is the “offering [of] fuller market packages or “bundles”
of customer-focused combinations of goods, services, support, self-service, and
knowledge” (Vandermerwe & Rada, 1988, p. 314). Companies can thereby offer a more
holistic solution to a problem, which increases the value that is delivered to customers
(Vandermerwe & Rada, 1988). The increasing interest in services and servitization has
led to the emergence of the Service-Dominant Logic (SD logic) (Vargo & Lusch, 2004a).
More than being a static theory, SD logic is a ‘dialogical and collaborative work’ (Vargo,
2008, p. 211) that aims to understand and establish a new marketing paradigm (Vargo &
Lusch, 2004a). The SD logic prescribes that goods do not have standalone value, but that
their value is determined in their use. It is to say that goods only have value when they are
used to serve a need. Companies that have gone fully through the servitization process
Based on developments such as the emergence of the SD logic, This is Service Design
Thinking was compiled to delineate and aid service design practices (Stickdorn &
Schneider, 2010). This work provides basic principles of Service Design Thinking, as well
as a wide range of service design tools that service designers can use at different phases
in their development process.
Understanding the needs of customers can be a valuable insight when developing new
successful services (Narver & Slater, 1990; Narver, 2004) Such needs may be on the
minds of customers already, in which case they are able to express those needs. They
may however also be latent needs, in which case they are not yet aware of these future
needs(Yannopoulos & Auh, S.Menguc, 2012). Trend analysis can be used to uncover or
forecast future or latent needs of customers, by drawing on patterns and developments of
the past and present, and extending them to the future (Floyd, 1972). Effective trend
analysis will allow companies to be market oriented by drawing on the insights into these
latent needs (Stickdorn & Schneider, 2010).
Companies with a market orientation are often framed as being driven by a demand-pull
rather than supply-push (Narver & Slater, 1990). By this definition market orientation is
structured around the use of customer needs, both expressed as well as latent (Narver,
2004). Having a market orientation has been found to be a successful and profitable
strategic direction (Narver & Slater, 1990; Slater & Narver, 1998). The propositions that
the SD logic puts forward also have an inherently market oriented approach. Customer
plays a pivotal role in both the service delivery as well as value evaluation (Lusch &
For trend analysis to be of value, two phases of the design process should be highlighted.
Firstly, trends must be identified. Secondly, service designers should use the trends as
input during their design process when developing new services (Stickdorn & Schneider,
2010). This research therefore aims to answer the question: How can key trends in
consumer needs be identified and used by service designers when developing new service offerings?
A key characteristic of services is that they cannot come into existence without the
inclusion of the customer (Fließ & Kleinaltenkamp, 2004). This characteristic underlies the
importance of the customer in the service delivery process. The customer is also the
co-creating and evaluator of quality (Lusch & Vargo, 2006). From these foundations it thus
flows that understanding customer needs is crucial for service developers to be able to
offer optimal value. This research question is therefore of interest to both academics and
practitioners. To answer the research question, the SD logic will be used as a frame of
reference and as a mindset within which the question is approached. The characteristics
of service design will also be defined and placed within the context of the SD logic. This is
because they are in fact two sides of the same coin, in that they are dependent on each
other.
Service Design Thinking provides the services to establish the SD logic. The SD logic
provides Service Design Thinking with societal relevance (Stickdorn & Schneider, 2010;
Vargo & Lusch, 2004a). Furthermore, thevalue of market orientation for service designers
and its relevance for need identification is conceptually re-enforced. The customers needs
play a pivotal role in delivering value. Gaining insight into these needs is therefore of
requires a market orientation (Narver & Slater, 1990; Vandermerwe & Rada, 1988). This
places the concepts and content of SD logic, Service Design Thinking and market
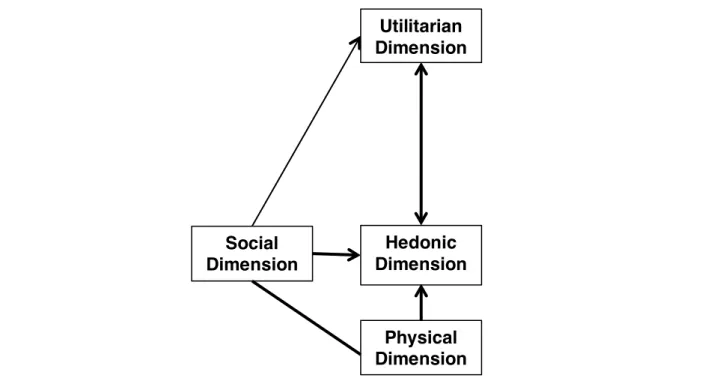
orientation in a triangular relationship (Figure 1). It formulates a basis on which to base
the practical application of the trend analysis tool as presented in This is Service Design
Thinking.
First the SD logic, service design and market orientation literature were be reviewed to
establish an understanding of the theoretical background that preceded this study
Research conduced with primary pupils provided customer journey maps and critical
touch points, which were abstracted and analyzed to uncover trends in service needs. The
themes and value constructs that allowed for the definition of propositions that were
visualized in a conceptual framework.
2.
Literature Review
Through offering services, companies may try to innovate or lengthen the life cycle of their
durable goods. This process is known as servitization, and has played an increasingly
important role in marketing (Vandermerwe & Rada, 1988). Servitization also highlights the FIGURE 1 – Triangular relationship of Concepts
Service
Dominant
Logic
Market
Orientation
Service
Design
awareness of companies that rather than offering products, they should offer more holistic
solutions to problems. In this context, the distinction between pure service offerings and
pure product offerings is blurred. When companies have completely gone though the
process of servitization, they in fact only offer solutions to problems (L. A. Smith et al.,
2012). These solutions may, depending on the problem, be composed of products and
services. In this case, they effectively approach business from the SD logic perspective
(Vargo & Lusch, 2004a).
2.1 Service Dominant Logic
The emergence of the SD logic reflects the need for the adoption of a new frame of
reference for marketing that incorporates this change in value creation. The core of the SD
logic is therefore not a theory but a mindset (Vargo & Lusch, 2004a). The service-centered
model of exchange that is derived from the SD logic is originally based on eight
foundational premises, but due to its the ‘dialogical and collaborative [nature]’ (Vargo,
2008, p. 211), these have been altered and tailored to the outcomes of discussions and
dialogs (Lusch, Vargo, & O’Brien, 2007; Lusch & Vargo, 2006; Vargo & Lusch, 2004a,
2004b; Vargo, 2008). Table 1 shows the most recent version of Foundational Premises
(Vargo & Lusch, 2008).
TABLE 1 – Foundational Premises of the Service Dominant Logic
Foundational Premise 1 Service is the fundamental unit of exchange
Foundational Premise 2 Indirect exchange masks the fundamental unit of exchange.
Foundational Premise 3 Goods are distribution mechanisms for service provision.
Foundational Premise 5 All economies are services economies.
Foundational Premise 6 The customer is always a co-creator of value.
Foundational Premise 7 The enterprise cannot deliver value, but only make value propositions.
Foundational Premise 8 A service-centered view is inherently customer oriented and relational.
Foundational Premise 9 All social and economic actors are resource integrators
Foundational Premise 10 Value is always uniquely and phenomenologically determined by the beneficiary.
(Vargo, 2008)
2.2 Service Design
Service design has only recently emerged as a distinctive field of expertise. Its exact
definition has therefore not yet fully crystalized. A recent definition by UK Design Council
(as cited in Stickdorn & Schneider, 2010, p. 31) defines service design as being “all about
making the service you deliver useful, usable, efficient effective and desirable”. The
intangibility nature is also expressed in the definition used by the Copenhagen Institute of
Interaction Design, which approaches services as “experiences using a combination of
intangible and tangible mediums” (as cited in Stickdorn & Schneider, 2010, p. 30). This
also reflects many of the characteristics of SD logic, which considers goods to have a
contingent value-in-use rather then an absolute value-in-transaction (Vargo & Lusch,
2004a).
The developments in execution and research of design processes have long been
relevant to academics and industry practitioners. The GD logic shows a clear evolution of
new product processes. The Phases Review Process crystalized into a more rigid
1994). New Service Development (NSD) processes have been subject to academic
debate (Alam & Perry, 2002; Matthing, Sanden, & Edvardsson, 2004). This process is
continuing into an age where servitization plays a key role, and so the developments in
service design will continue to fuel the debate (Ostrom et al., 2010).
2.3 Principles of Service Design Thinking
The premises of the SD logic have had a shaping function in the approach to service
marketing, and vice-versa. Though the field of service design is interdisciplinary, the
management disciple of marketing plays a central role (Lucy Kimbell, as cited in Stickdorn
& Schneider, 2010). For this reason, the premises of SD logic resonate throughout the five
principles that encompass service design. These principles are the basis of a dynamic
language that guides the service design process (Stickdorn & Schneider, 2010) (Table 2).
TABLE 2 – Principles of Service Design
Principle Description
Co-creative All stakeholders should be included in the service design process.
Sequencing The service should be visualized as a sequence of interrelated actions
Evidencing Intangible services should be visualized in terms of physical artifacts
Evidencing The entire environment of a service should be considered. (Stickdorn & Schneider, 2010, p 34)
The following section will elaborate on these five principles of Service Design Thinking,
2.3.1 User-Centered
Four of the foundational premises of the SD logic are particularly strongly related to the
user-centered aspect of service design (Stickdorn & Schneider, 2010; Vargo & Lusch,
2004a). These are summarized in Table 3:
TABLE 3 – Foundational Premises That Are User Centric in Nature
Foundational Premise 6 The customer is always a co-creator of value.
Foundational Premise 7 The enterprise cannot deliver value, but only make value propositions.
Foundational Premise 8 A service-centered view is inherently customer oriented and relational.
Foundational Premise 10 Value is always uniquely and phenomenologically determined by the beneficiary.
(Stickdorn & Schneider, 2010; Vargo, 2008)
Placing the customer at the center of service design is essential. Services cannot be
created or consumed without the inclusion of the customers (Fließ & Kleinaltenkamp,
2004), and so it follows that they must play a crucial role in the service design process.
Being effectively customer centered requires the development of relational affiliation
between the customer and service producer, and it is often found that managers aim to
develop such relationships (Alam & Perry, 2002). These relationships positively affect the
technical quality of services as well as innovation speed, which in turn has a positive
effect on the success of new service development. This is in accordance to Premise 6 and
10, which are both based on the view that customer perception and inclusion drives
exchange and value (Vargo & Lusch, 2004a, 2008). When exchange relationships are
increased loyalty (Czepiel, 1990; Mascarenhas, Kesavan, & Bernacchi, 2006). This is in
line with premise 7 of the SD logic (Vargo & Lusch, 2004a).
The effect of participation on service quality and customer satisfaction is also stronger for
participation in customer-producer affiliations that have been in place over an extended
period of time (Carbonell, Rodríguez Escudero, & Pujari, 2009; Cermak et al., 2011).
These findings are strongly in line with Premise 8 of the SD logic, that to be
service-centered, a company must inherently be customer orientated and relational (Vargo, 2008).
2.3.2 Co-creative
Six of the foundational premises of the SD logic are particularly strongly related to the
co-creative facet of service design (Stickdorn & Schneider, 2010; Vargo & Lusch,
2004a). These are summarized in Table 4:
TABLE 4 – Foundational Premises That Are Co-Creative in Nature
Foundational Premise 4 Operant resources are the fundamental source of competitive advantage
Foundational Premise 6 The customer is always a co-creator of value.
Foundational Premise 7 The enterprise cannot deliver value, but only make value propositions.
Foundational Premise 8 A service-centered view is inherently customer oriented and relational.
Foundational Premise 9 All social and economic actors are resource integrators
Foundational Premise 10 Value is always uniquely and phenomenologically determined by the beneficiary.
Services are created through interactions between the service provider and the customer.
Understanding the customer is thus key to encourage the most effective participation
(Stickdorn & Schneider, 2010). Early literature already suggested that involving customers
in service production can increase productivity (Lovelock & Young, 1979), and that
customers should be seen as “partial” employees of the service company in the creation
of value (Mills & Morris, 1986). This aspect not only reflects the co-creative nature of
services, but also reflects Premise 4 (Vargo & Lusch, 2004a). Premise 6 states that the
customer should always be seen as a co-creator of value (Lusch & Vargo, 2006), and
therefore can be seen, in part, as an employee of the service delivery process. The fact
that customers must participate to consume the service dictates that companies can only
offer value propositions, as it is impossible to define the exact value before the co-creative
interaction, which is in line with Premise 7 of the SD logic (Vargo & Lusch, 2004a, 2008).
Despite the fact that customers have frequently been regarded as co-producers or “partial”
employees (Fließ & Kleinaltenkamp, 2004; Mills & Morris, 1986), the co-creative role of
the customer has been the most vividly discussed of all the SD logic premises. Where the
original premise 6 determined that the customer was a co-producer of the service (Vargo
& Lusch, 2004a), the current notion regards the customer as a co-creator of value (Lusch
& Vargo, 2006). Value cannot be created without the participation of customers, and so a
shift is observed from ‘creating value for customers to creation value with customers’
(Moeller, Ciuchita, Mahr, Odekerken-Schroder, & Fassnacht, 2013, p. 472). This notion
also reflects Premise 10 of the SD logic (Vargo & Lusch, 2008).
The needs and expectations of customers, as well as the needs and expectations of other
crucial point of the design process. This is closely in line with Premise 9, as it includes the
stakeholder perspective (Vargo & Lusch, 2008). To be effective in considering the
diverging range of interests, involving theses customers and stakeholders to co-create the
service value proposition can add substantial value to both the new service development,
as well as during the service provision (Dong, Evans, & Zou, 2008; Poetz & Schreier,
2012; A. Smith & Fischbacher, 2005). Service loyalty is generated by delivering service
quality through the increase of customer satisfaction (Caruana, 2002; Sivadas &
Baker-Prewitt, 2000). The experience of co-creation and co-ownership is also likely to have a
positive influence on both the long-term engagement and customer loyalty (Lengnick-Hall,
1996; Stickdorn & Schneider, 2010). Premise 8 is reflected in these aspects of the
co-creative nature of Service Design Thinking (Lusch, Vargo, & Wessels, 2008)(Vargo &
Lusch, 2008).
2.3.3 Sequencing
Four of the foundational premises of the SD logic are particularly strongly related to the
sequencing aspect of service design (Stickdorn & Schneider, 2010; Vargo & Lusch,
2004a). These are summarized in Table 5:
TABLE 5 – Foundational Premises That Are Sequencing in Nature
Foundational Premise 2 Indirect exchange masks the fundamental unit of exchange.
Foundational Premise 4 Operant resources are the fundamental source of competitive advantage
Foundational Premise 8 A service-centered view is inherently customer oriented and relational.
Not only the service design process, but also the service provision process has many
dynamic and contingent elements, which can be tangible and intangible in physical nature
(Stickdorn & Schneider, 2010). This notion is incorporated in Premise 2 of the SD logic
(Vargo & Lusch, 2004a). By mapping a service timeline, service designers can
deconstruct the service process to get a better of understanding of the system around the
service (Stickdorn & Schneider, 2010).
The touch point interactions between the customer and service provider play an important
role in the assessment of the quality of the service. These touch points may consist of
different social or economic actors, that should all be considered as research integrators,
which is held by premise 9 (Vargo & Lusch, 2008). Service providers can only offer value
propositions, as is captured by Premise 7 (Vargo & Lusch, 2004a). Customers base their
evaluation of value on a previously established reference point (Wood & Moreau,
2006).The value of a service is hard to determine and strongly contingent to the reference
point of the customer (Bitner, 1992). It is therefore very important to manage this point of
reference, which reflects the view on operant resources of Premise 4 (Vargo & Lusch,
2004a). Creating an accurate sense of expectation is essential for the evaluation of
services. The finding that a higher experience-to-expectation evaluation ratio leads to
greater satisfaction with the service reflects the importance of positive disconfirmation,
and thereby the significance of effectively managing the reference point of customers
(Oliver, 1980; Wood & Moreau, 2006).
Sequencing implies is delivered and consumed over an extended period of time (Stickdorn
& Schneider, 2010). This suggests that the relationship with customers should also be
multiple actors will be resource integrators over the duration of this time. This is in line
with Premise 8 (Vargo & Lusch, 2004a).
2.3.4 Evidencing
Five of the foundational premises of the SD logic are particularly strongly related to the
Evidencing facet of service design (Stickdorn & Schneider, 2010; Vargo & Lusch,
2004a). These are summarized in Table 6:
TABLE 6 – Foundational Premises That Are Evidencing in Nature
Foundational Premise 2 Indirect exchange masks the fundamental unit of exchange.
Foundational Premise 3 Goods are distribution mechanisms for service provision.
Foundational Premise 4 Operant resources are the fundamental source of competitive advantage
Foundational Premise 7 The enterprise cannot deliver value, but only make value propositions.
Foundational Premise 10 The beneficiary always uniquely and phenomenologically determines value.
(Stickdorn & Schneider, 2010; Vargo, 2008)
Customers are likely to base their judgment of the value service to a large degree on
physical artifacts and proofs. Premises 2 and 3 of the SD logic highlight that services are
offered through a large range of tangible and intangible offerings (Vargo & Lusch, 2004a).
This nature of services offerings implies the importance that should also be attached to
the physical evidencing. The SD logic holds that goods can only be a distribution of
companies can only make value propositions as is reflected by the Premises 3 and 10
(Vargo & Lusch, 2004a, 2008).
When goods are the evidence of the quality of a service, the importance of effective
expectation management is once again reinforced. Customers are likely to use physical
evidence to create an expectation of quality, using it as benchmark to evaluate the quality
of the service afterwards (Bolton & Drew, 1991; Wood & Moreau, 2006) Value expectation
management is therefore highly important, and reflects elements of Premise 4 (Vargo &
Lusch, 2004a). Premise 7 holds that products only ever transmit a service rather than
deliver value alone, which underlines the importance of evidencing. It also reflects again
Premise 2 of the SD logic (Vargo & Lusch, 2004a). In some cases, part of the value of an
offering may be derived from the consumption of a product. The SD logic holds than that
the value of the offering lies not in the consumption of the product, but that is product is
the evidence of how well it served the need. Following this premise, goods will form a
large part of the evidence of the quality of the service.
2.3.5 Holistic
Six of the foundational premises of the SD logic are particularly strongly related to the
holistic aspect of service design (Stickdorn & Schneider, 2010; Vargo & Lusch, 2004a).
These are summarized in Table 7:
TABLE 7 – Foundational Premises of Service That Are Holistic in Nature
Foundational Premise 1 Service is the fundamental unit of exchange
Foundational Premise 4 Operant resources are the fundamental source of competitive advantage
Foundational Premise 7 The enterprise cannot deliver value, but only make value propositions.
Foundational Premise 9 All social and economic actors are resource integrators
Foundational Premise 10 The beneficiary always uniquely and phenomenologically determines value.
(Stickdorn & Schneider, 2010; Vargo, 2008)
Services are a complex set of offerings that are consumed in real time and in a physical
space, which is in line with Premise 2 (Vargo & Lusch, 2004a). While using a service,
consumers will experience perceptions with all senses. This can be considered as the
total customer experience. Customers will also experience the evidencing of the service in
ways that are not always directly related to the functional value delivery of the service
(Ostrom et al., 2010; Stickdorn & Schneider, 2010). Premises 7 and 10 reflect that this
total experience is not the same for everyone, and contingent to the evaluation of the
value (Vargo & Lusch, 2008). When the experience is performed properly it is “a totally
positive, engaging, enduring and socially fulfilling physical and emotional customer
experience across all major levels of one’s consumption chain” (Mascarenhas, 2006, p.
399). A holistic approach to service design therefore reflects an understanding of the
tangible and intangible aspects that influence service evaluation (Wakefield & Blodgett,
1999) and also reflects the holistic nature of the service exchange reflected in Premise 1
(Vargo & Lusch, 2004a).
The notion that companies can only offer value propositions rather than concretely
measurable value, as put forward in Premise 7 (Vargo & Lusch, 2004a), also implies that
within its servicescape to be able to judge the value they experience (Bitner, 1992; Reimer
& Kuehn, 2005; Vargo & Lusch, 2004a)
Of great importance to the holistic experience of the service encounter is the human
interaction component (Bitner, Booms, & Tetreault, 1990). Mapping the moods and
feelings of customers is key in understanding their emotions. Not only positive
disconfirmation of service performance, but also of the entire service experience lead to
higher evaluations (Price, Arnould, & Tierney, 1995). Expectation management becomes
a lot easier when a relationship of trust and understanding is built between the service
consumer and producer (Wood & Moreau, 2006). This reflects not only the relational and
user-centered characteristic of the Premise 6, but also the integration of multiple resource
integrators as in Premise 9 (Vargo & Lusch, 2004a, 2008).
2.4 Classifications of Services
There are multiple classification or categorization methods of services. This research
makes use of two of these methods. On the one hand, services can be categorized on the
basis of type of value that they offer. For this method the categorization is made along the
concepts of utilitarian, hedonic and semiotic value (Bloch, 2011). These concepts “should
be considered broadly and not restricted to tangible product characteristics” (Bloch, 2011,
p. 378). The utilitarian value is derived from the functional usefulness of the service.
Hedonic value reflects the pleasurable element of the consumption of a service. Semiotic
value is derived from the sign value, such as prestige and exclusivity, which consuming a
certain service has (Bloch, 2011). Customers may have range of needs, and may
therefore look for a range of values, either within the same services, or across different
Furthermore, services can be classified in terms of the timing of the evaluation of the
value in use. This classification system considers services to be search, experience or
credence services (Darby & Karni, 1973; Nelson, 1970). Search services allow for
accurate estimation of the value of the service before its consumption, whereas
experience services require the customer to consume the service before being able to
make this value judgment. Credence services are altogether different because they are of
such a complex or intrusive nature that it is impossible for customers to objectively
evaluate their value. Instead, they rely on more instinctive and intuitive judgments to
evaluate the service.
2.5 Market orientation
Of the five elements of Service Design Thinking, the user-centered and co-creative nature
of this design approach are most obviously in line with the aims of market orientation
(Stickdorn & Schneider, 2010). These are also elements that are closely in line with the
premises of the SD logic (Vargo & Lusch, 2004a, 2008), as has been discussed
previously. Customer centrality plays an important role in both Service Design Thinking
and the SD logic, and is also the main driver of effective customer orientation. Only by
analyzing the needs of customers, either expressed or latent, can a holistic experience be
designed (Alam & Perry, 2002; Matthing et al., 2004).
Market orientation is defined as “the organization wide generation of market intelligence
pertaining to current and future customer needs, dissemination of the intelligence across
departments, and organization wide responsiveness to it” (Kohli & Jaworski, 1990, p. 6).
the expressed or latent needs of customers (Narver, 2004; Yannopoulos & Auh,
S.Menguc, 2012). Market orientation is a strategic orientation that aims to facilitate the
development of incremental and radical innovations (Atuahene-Gima, 2005). Being
reactive lets companies exploit current competences to serve current customers with
incremental innovations. Alternatively, proactively market oriented companies will try to
develop and explore new competences to serve future customer needs with more radical
innovations (Alam & Perry, 2002; Atuahene-Gima, 2005).
Understanding customers requires a future focused approach, as this allows for the
inclusion on future customers (Narver & Slater, 1990). Only by learning to include the
latent needs of future customers can new product performance be enhanced (Matthing et
al., 2004; Yannopoulos & Auh, S.Menguc, 2012). Having a future focus by analyzing latent
needs has a strongly positive effect on new product performance (Grinstein, 2008; Narver,
2004). A future focused market orientation is generally considered to be a profitable and
beneficial strategic orientation, as it delivers superior customer value (Narver & Slater,
1990; Slater & Narver, 1998).
Many of the benefit and characteristics attributed to market and customer orientation are
inherently present in Service Design Thinking and the SD logic. Including customers in the
innovation process by means of co-creation does not only alter the quality of the
innovative output. It also generates a more innovative image of the companies that use
such innovation methods, and lets the outcome be considered more innovative(Hippel,
2005; Schreier, Fuchs, & Dahl, 2012). To establish an understanding of what the
customer-centered (Chandy, Hopstaken, Narasimhan, & Prabhu, 2006; Stickdorn &
Schneider, 2010).
On many occasions it is found that interdisciplinary and interdepartmental cooperation is
very important of the successful implementation of market orientation (Kirca,
Jayachandran, & Bearden, 2005). This interdisciplinary nature is also reflected in the SD
logic, which focuses in part on the value of knowledge that is often embedded
cross-functional or interdisciplinary cooperation (Vargo & Lusch, 2004a, 2008). A similar notion
is rooted in the Service Design Thinking. By sequencing and evidencing, service design is
given a holistic perspective, in which many aspects of both the customer experience as
well as the service provider are integrated (Stickdorn & Schneider, 2010).
3. Methodology
The current research was designed to uncover higher-order trends in the latent needs of
the participants. The research design was qualitative in nature, which allowed for the
development of in-depth insights into these needs (Yin, 2009). A group of primary school
pupils formed sample population, with the aim of generating original and creative data and
insights (Morrow & Richards, 1996). The research was conducted to provide exemplary
application of a service design tool (Stickdorn & Schneider, 2010) and with the aim to
uncover a definitive mechanism or relationship. This is much in line with the dynamic and
contingent nature of the SD logic, and servitization discussion in general (Lusch & Vargo,
3.1 Customer Journey Maps in Service Design
The service design process consists of four stages (Table 8). Before services can be
developed it is crucial to get “a clear understanding of the situation from the perspective of
current and potential customers” (Stickdorn & Schneider, 2010, p. 128). This reflects the
need for customer orientation as well as customer centrality (Alam & Perry, 2002).
Multiple tools may be used at this stage to develop such customer insights. One of these
is the development of visualized customer journey maps, which is used in the current
study (Stickdorn & Schneider, 2010, p. 158). The customer journey map is an elaborate
visualization of the story of the service experience. Its construction is often comprised of a
sequence of touch points at which customers interact in some shape or form with the
service provider. Systematically evaluating these touch points leads to interesting insights
that can be used for problem identification to be included in the service design process
(Stickdorn & Schneider, 2010).
3.2 Sample
The participants in the current study were a group of primary school pupils that attend the
public primary school OBS De Wissel in Born (The Netherlands). The sample was TABLE 8 – Stages of the Service Design Process
Stage Description
Exploration This stage aims to uncover problems to which solutions can be offered.
Creation Holistic solutions are conceptualized and designed at this stage.
Reflection At this stage the designed service prototyped and tested.
established through purposeful sampling (Marshall, 1996). All pupils were all finishing their
last year (group 8) of primary school education. Gender and age are important variables
that effect the difference between children (Morrow & Richards, 1996). The group
consisted of 35 pupils with ages ranging from eleven (11) to thirteen (13), (mean of 11.7
years, SD of 0.67 years), which provides uniformity in terms of age. In this group sixteen
(16)(46%) pupils were male and nineteen (19)(54%) pupils were female, which provides a
strong diversity in gender.
The value of using child participation in research is getting increasingly more accepted
(Alderson, 2001). Especially in early pilot stages of idea generation, the free-spiritedness
of children can lead to interesting and unforeseen insights (Morrow & Richards, 1996).
Children often have a less rigid frame of reference. Sometimes it is be better to have less
memory so that creativity is not hampered (Moorman & Miner, 1997). Children are often
more free-spirited and creative. In situations where creativity is an important driver of
success, children might deliver unexpected results (Alderson, 2001). In light of the
qualitative and exploratory nature of this study, the generation of new and creative
insights is very valuable. For this reason, the use of children is likely to generate creative
and unexpected insights, as they are more free-spirited.
3.3 Services Categorization
For this study, six service offerings were selected that are common to children. Children
often relate well to ‘pretend situations’, in which they have the opportunity to rely both on
their experiences as well as on their imagination for their frame of reference (Alderson,
2001). These services were categorized as search, experience and credence services
each of these services. Seeing as services are complex offerings, it is often hard to say
that a service has strictly utilitarian or hedonic value(Bloch, 2011). This distinction
becomes increasingly difficult to make as the complexity of the service offering increases
(Alam & Perry, 2002). However, within all three categories, one of the services has a more
utilitarian nature, and one has a more hedonic nature. This study does not analyze the
semiotic value in these services, as the “sign value” (Bloch, 2011, p. 379) in these
services is incomprehensive and generally difficult to observe. Table 9 summarizes the
services along the two classification schemes.
Planning a trip to McDonalds is a service of which the value can be predicted well. The
offering and quality are standardized and consistent, so the participants should be able to
estimate their evaluation beforehand, which makes this a search service (Nelson, 1970).
Fast food restaurants mainly aim at relieving their customers of their hunger within a
relatively short time frame. This is a useful and convenient service, which prescribes that it
is utilitarian in nature (Boztepe, 2007).
Going to the cinema will generate value that can be predicted well beforehand. A lot of
information about movies can be found online or elsewhere, in the form of trailers or
reviews for example. The holistic cinema experience is standardized and consistent,
making the value relatively easy to predict, which positions it as a search service (Nelson,
TABLE 9 – Categorization of the Six Studied Services
Search Service Experience Service Credence Service
Utilitarian Value Planning a trip to
McDonalds
First day of high school Going to the
orthodontist
1970). Going to the cinema serves less utilitarian needs, but is rather a free time activity to
be enjoyed to generate satisfaction. This describes the hedonic nature of this service
(Bloch, 2011).
The first day of high school is a time of much uncertainty, and the evaluation of the service
is contingent to many facets that are uncontrollable and unforeseeable for the participants.
The evaluation of this service can only occur after having experienced the service. These
elements make this an experience service (Mitra, Reiss, & Capella, 1999). Educational
services are primarily utilitarian in nature, as they are intended to provide the user with
valuable knowledge. The Infrastructural elements of this service are also aimed at
delivering utilitarian value (Boztepe, 2007).
Going to a theme park is also an experience service, as the evaluation of this service is
dependent on many aspects that the participants would be unable to predict. Many of
these elements, such as weather and busyness, are out of the control of customers
(Nelson, 1970). Going to a theme park is a hedonic service as it aims at offering an
enjoyable day and pleasing experience (Desmet & Hekkert, 2007).
Going to the dentist or orthodontist for a checkup is a credence service, as it is not within
the scope of the participants to judge the value of that service. The delivery of the service
requires the application of a specialized skill that is well beyond the scope of the
participants. For this reason the participants are unable to confidently judge the value of
the service (Darby & Karni, 1973). Though a dentist sometimes create comfort by relieving
Going on vacation is similarly hard for the participants to judge as it often spans over a
substantial period of time. The value that it generates therefore is dependent on
infrastructures that are difficult to understand or difficult to compare after the consumption
(Darby & Karni, 1973). Therefore it is a credence service. The aim of most vacations is to
have a pleasurable time and to engage in enjoyable activities. For this reason it should be
considered to deliver primarily hedonic value (Chitturi, 2009).
3.4 Data Collection
The collection method embodied multiple elements of the Critical Incident Technique
(Ruyter & Scholl, 1995), which is an effective technique to locate the dissatisfactory touch
points (Bitner et al., 1990). To obtain the most valuable insights from these pupils, the
data-collection method had a social-anthropological approach, in that data was
co-produced with pupils (Morrow & Richards, 1996). The data collection was somewhat
unorthodox in nature, in that it involved a group of primary school pupils, who expressed
themselves in a very creative way. For creativity to flourish it was important to encourage
free-spiritedness, and, to stay close to the participant in communication and approach
(Ruyter & Scholl, 1995). In the very unstructured approach, the pupils had the freedom to
express exactly where the critical incidences were. It allowed for the description and
decomposition of the entire service experience.
The pupils were asked to form six different groups, which they could form themselves.
Children often enjoy working in a group as they enjoy being together (Alderson, 2001).
Each group was presented with one of the service offering as mentioned above. Each of
the groups of was first presented with an empty design of a customer journey map. In their
could (Appendix A). They had access to an array of markers, pen and crayons to visualize
this journey.
After having completed the journey map the groups were asked to highlight three touch
points that could be made ‘cooler, nicer, more fun or less boring’. Individually, the pupils
were then asked to draw three pictures in which they described how the situation could be
improved (Appendix B). They had access to markers, pen and crayons, as well as printed
out visuals to express their suggested improvements. Only after having drawn the
improvements were they asked to describe their improvements in writing. This sequence
was intended to let the pupils express themselves in a creative way, while still giving
pupils who have less confidence in their drawing skills the opportunity to provide their
input. The use of these two data collection methods also provides the opportunity for
triangulation of the data (Alderson, 2001; Morrow & Richards, 1996).
Throughout the data collection procedure it was made very clear, both orally as through
actions taken, that the pupils were free to express themselves as they wished, and that it
was to be an enjoyable experience (Alderson, 2001). The pupils were invited by Service
Science Factory (SSF) to come to the university to participate in the study. SSF is a
service design consultancy associated with University Maastricht, where pupils,
researchers and industry experts work together on developing services (Mahr, Kalogeras,
& Odekerken-Schroder, 2013). Upon their arrival they were welcomed with sweets and
soft drinks, after which the set up and sequence of the activities was explained to them.
These refreshments were provided throughout the activity to sustain enthusiasm
The activity was not mandatory and unrelated to schoolwork or any form of evaluation or
examination, which likely promoted the willingness of the pupil to contribute (Morrow &
Richards, 1996). This was made clear both orally in the explanations, as well as in print on
the printed activity instructions. The provision of soft drinks and candy, as well as ample
coloring and other visualization media intended to set a free-spirited, creative and
enjoyable atmosphere (Alderson, 2001). This was to aid them in their creative process
and to allow them to express themselves in a way that reinforced the disconnection from
other school activities.
The study was conducted at the university, which was expected to be a new and
unfamiliar location for most of the pupils. It was also expected that a university setting
would motivate the pupils to participate enthusiastically, as it was intended to symbolize
the seriousness with which their contributions would be handled (Morrow & Richards,
1996).
3.5 Data Analysis
The pupils were asked to from six groups and each group was assigned a service. In their
groups they were asked to complete the journey map. In these customer journey maps the
participants had been asked to highlight three touch points that needed improvement. The
customer journey maps were analyzed and information was distilled from this data. The
classification of value of Bloch (2011) was used to try to define the nature of the touch
point. Inductive analysis of the individual touch point descriptions however revealed that
not all participants experienced the same problems at each of the touch points. This made
it unreasonable to classify the touch points on the basis of this classification. Rather, this
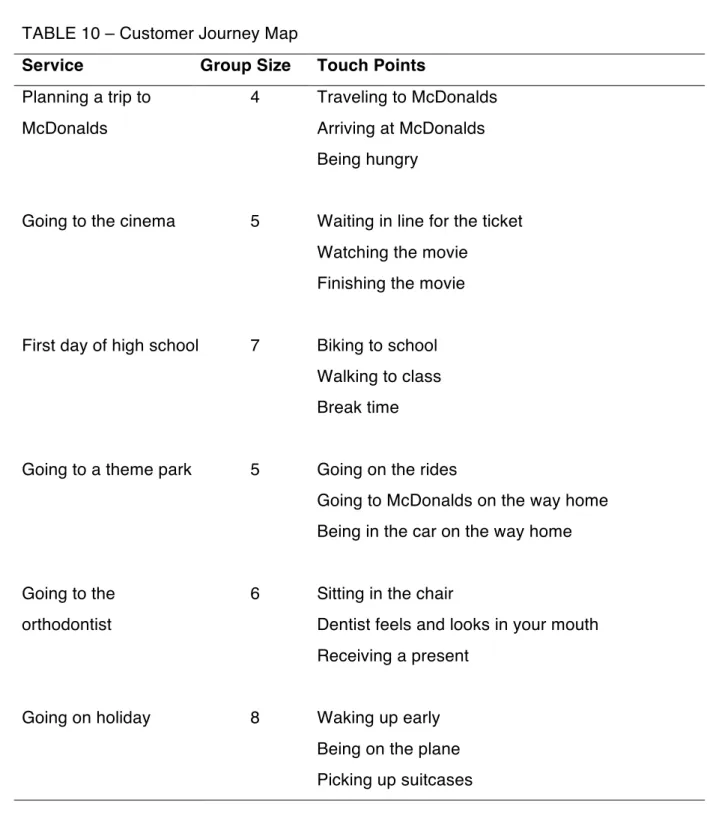
distilled. Table 10 provides a summary of the services that were assigned to each of the
groups, as well as the group sizes and the three touch points that each group highlighted
for improvement.
TABLE 10 – Customer Journey Map
Service Group Size Touch Points
Planning a trip to
McDonalds
4 Traveling to McDonalds
Arriving at McDonalds
Being hungry
Going to the cinema 5 Waiting in line for the ticket
Watching the movie
Finishing the movie
First day of high school 7 Biking to school
Walking to class
Break time
Going to a theme park 5 Going on the rides
Going to McDonalds on the way home
Being in the car on the way home
Going to the
orthodontist
6 Sitting in the chair
Dentist feels and looks in your mouth
Receiving a present
Going on holiday 8 Waking up early
Being on the plane
Picking up suitcases
the analysis of this data involved the development of a coding scheme to allow for
categorization of the date. Inductive logic and iteration was used to ‘identify emergent
categories from the data’ (Spiggle, 1994). By going through the drawing sequentially
conceptual themes within each of the suggestions were found. This resulted in the
development of 27 themes. A fellow Master (MSc) student coded the drawings and
explanations as well. They independently followed the same process to develop a coding
scheme. This was done to reduce the potential coding bias (Moeller et al., 2013). Their
categorization process led to the development of a coding scheme of 21 themes. A
discussion in which the similarities and differences were extensively deliberated led to the
conclusion that seventeen (17) themes of the second coding scheme were conceptually in
line with the themes of the original coding scheme (Seale, 1999). The four (4) themes that
remained after this discussion were added to the original 27 themes. This led to a total of
31 themes.
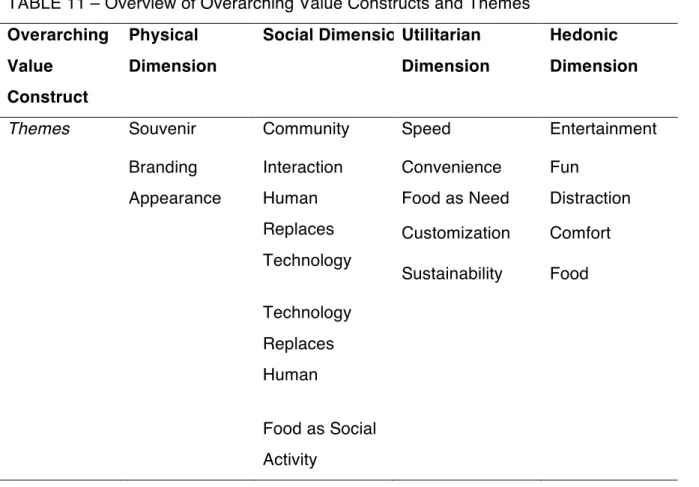
A number of the 31 themes that resulted out of the two coding schemes were merged on
the basis of their conceptual proximity, to develop a more compact set, with which would
allow the analysis to be more concise and structured. The final set of themes consists of
eighteen (18) themes. From the analysis of these themes, four (4) higher-order conceptual
construct emerged (Spiggle, 1994) (Table 11). The definitions of each of the higher-order
conceptual construct can be found in Table 12, and were deduced from the themes that
they cover. After having established the themes and overarching value constructs, the
eighteen themes were used as labels to categorize the drawings. To ensure that the
categorization would be done “on the basis of coherent meaning (Spiggle, 1994), the
written descriptions as well as drawn descriptions of the touch point improvements were
Microsoft Excel was used to systematically code each of the 104 drawings. The
suggestions were categorized on the basis of the nature of the problem (utilitarian or
hedonic), the nature of the solution (utilitarian or hedonic), the themes and the age and
gender. On the basis of these categorizations, comparison and dimensionalization was
applied (Spiggle, 1994). Differences and similarities were explored and anecdotal
evidence from both the service journey maps as well as the suggested improvements was
integrated to create a deeper insight.
TABLE 11 – Overview of Overarching Value Constructs and Themes
Overarching
Value
Construct
Physical
Dimension
Social Dimension Utilitarian
Dimension
Hedonic
Dimension
Themes Souvenir Community Speed Entertainment
Branding Interaction Convenience Fun
Appearance Human
Replaces
Technology
Food as Need Distraction
Customization Comfort
Sustainability Food
Technology
Replaces
Human
Food as Social
Activity
4. Results
In a first phase, the frequencies of the nature of the problems and solutions were
compared and contrasted. In a second phase, the frequencies of the overarching value
constructs and themes were compared and contrasted.
4.1 Problems and solutions
35 pupils were asked to draw and explain solutions to the problems at each of the three
touch points they highlighted. In total they created 104 drawings (One pupil produced only
two drawings). A small number of pupils included multiple problems and solutions within
their suggestions. This explains why there are 108 problems and 108 solutions. There are
substantially more problems with a utilitarian nature (61%) than with a hedonic nature
(39%). The distribution of utilitarian and hedonic solutions is roughly equal (45% and 55%
respectively) (Table 13). Overarching
Value Construct
Description
Physical Dimension
The service or solution has a prominent physical aspect, which
plays a key role in the signaling or delivery of value.
Social Dimension The service or solution is delivered or consumed has a social features or consequences. This may of example be consumed
within a social context, or have an influence of the social
interaction between human and human or human and machine
Utilitarian Dimension
The service or solution has a practical dimension that serves a
need that is functional in nature.
Hedonic Dimension
The service or solution has an enjoyable element that serves a
need that is not necessarily functional in nature, but rather
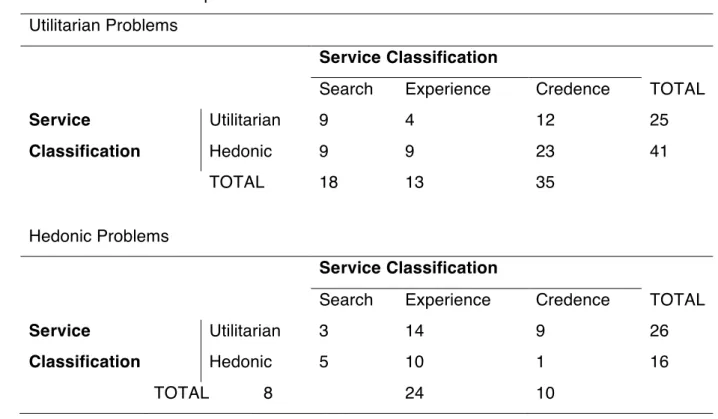
Using the service classifications as discussed above (Bloch, 2011; Darby & Karni, 1973;
Nelson, 1970) the frequencies of utilitarian and hedonic problems are disentangled (Table
14). Utilitarian problems were substantially more common among hedonic services and
under credence services. Hedonic problems were mentioned substantially more often in
utilitarian services as well as in experience services.
TABLE 13 – Frequencies of Problems and Solutions
Problems Solution
Utilitarian 66 Utilitarian 49
Hedonic 42 Hedonic 53
TOTAL 108 108
TABLE 14 – Problems per Service Classification Utilitarian Problems
Service Classification
Search Experience Credence TOTAL
Service
Classification
Utilitarian 9 4 12 25
Hedonic 9 9 23 41
TOTAL 18 13 35
Hedonic Problems
Service Classification
Search Experience Credence TOTAL
Service
Classification
Utilitarian 3 14 9 26
Hedonic 5 10 1 16
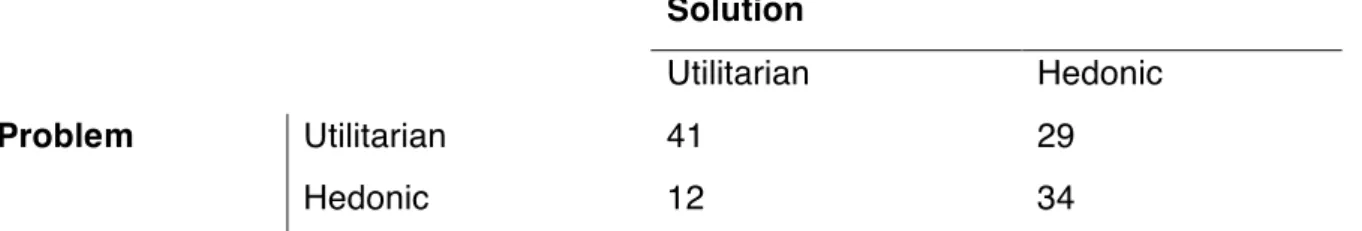
It was observed that the nature of the problem does not determine in advance the nature
of the offered solution (not all utilitarian problems had a utilitarian solution and not all
hedonic problems had a hedonic solution). In a next step the problem and solutions were
cross-referenced. Table 15 shows how frequently each utilitarian problems and hedonic
problems were met with either utilitarian or hedonic solutions.
Utilitarian problems were most frequently met with utilitarian solutions. Likewise, hedonic
problems were most frequently met with hedonic solution. What is also apparent in this
table is that utilitarian problems were considerably more frequently met with hedonic
solution, than hedonic problems were met with utilitarian solutions.
4.2 Overarching Value Constructs and Themes
Out of the initial data categorization emerged eighteen (18) themes and four (4)
overarching value constructs. The frequencies with which these themes appeared are
summarized in Table 16. The overarching value constructs are approached as different
dimensions of the value needs. The Hedonic Dimension and Social Dimension were
represented more frequently than Physical Dimension and Utilitarian Dimension (32%,
28%, 24% and 16% respectively). Appearance, Interaction, Speed, Convenience,
Entertainment and Fun appeared substantially more often than other themes.
Solution
Utilitarian Hedonic
29
Problem Utilitarian 41
Hedonic 12 34
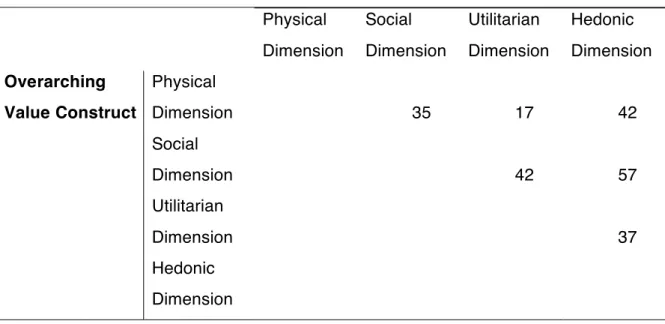
It was observed that the overarching value constructs and themes did not occur in
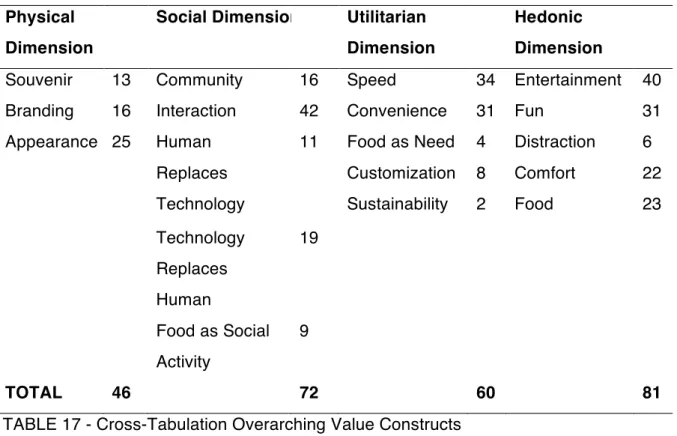
isolation of each other. Many of the problems and suggestions had elements of multiple of
overarching constructs and themes. Table 17 shows the frequencies that two of the
overarching value constructs were found in same specific solution. The SocialDimension
was uncovered frequently in suggestions there had either a Utilitarian Dimension or a
Hedonic Dimension. The Social Dimension was also found to be mentioned when
Physical Dimension were mentioned, but with a lower frequency. The PhysicalDimension
was uncovered most frequently in situations where the suggestion had a clear Hedonic
Dimension, and substantially less so when the suggestions had a more prominent
UtilitarianDimension. Physical
Dimension
Social Dimension Utilitarian
Dimension
Hedonic
Dimension
Souvenir 13 Community 16 Speed 34 Entertainment 40
Branding 16 Interaction 42 Convenience 31 Fun 31
Appearance 25 Human
Replaces
Technology
11 Food as Need 4 Distraction 6
Customization 8 Comfort 22
Sustainability 2 Food 23
Technology
Replaces
Human
19
Food as Social
Activity
9
TOTAL 46 72 60 81
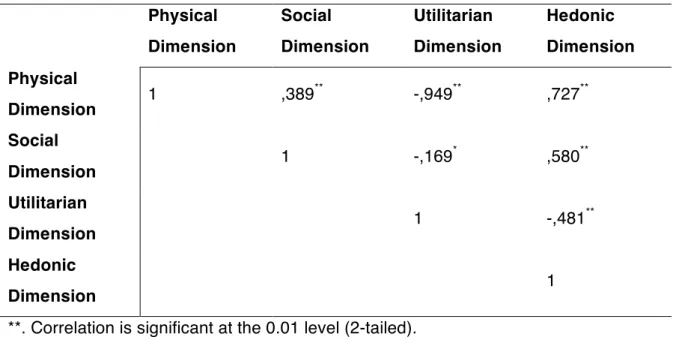
A Pearson’s Chi-Squared Test was used to analyze the significance of the frequencies of
correlations that emerged from the data. Table 18 shows that three dimensions had a
positive correlation, and three dimensions were negatively correlated. All correlations
were significant at the 0.01 significance level, except for the negative correlation between
the Social and Utilitarian Dimension, which was only significant at the 0.05 level. This
means that Physical Dimension is significantly positively correlated to both the Social and
Hedonic Dimension, but significantly negatively correlated to the Utilitarian Dimension. It
also means that Hedonic and Utilitarian Dimension were significantly negatively
correlated. The Social Dimension is significantly positively correlated to the other
dimensions, except to the Utilitarian Dimension.
Overarching Value Construct
Physical
Dimension
Social
Dimension
Utilitarian
Dimension
Hedonic
Dimension
Overarching
Value Construct
Physical
Dimension 35 17 42
Social
Dimension 42 57
Utilitarian
Dimension 37
Hedonic
Dimension
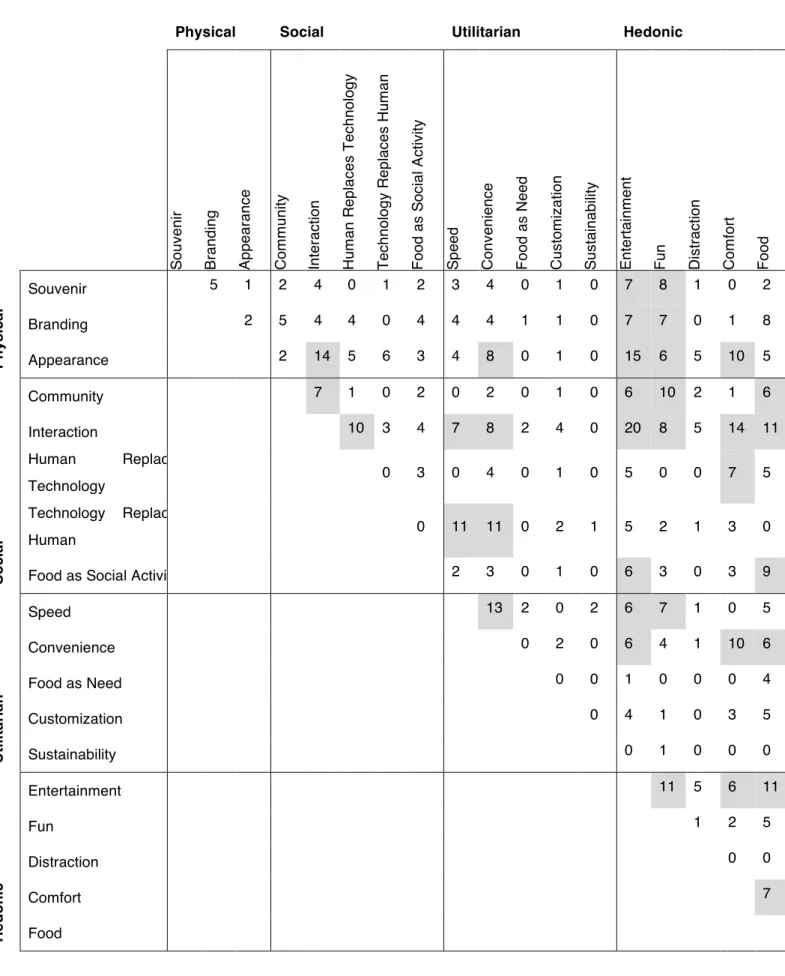
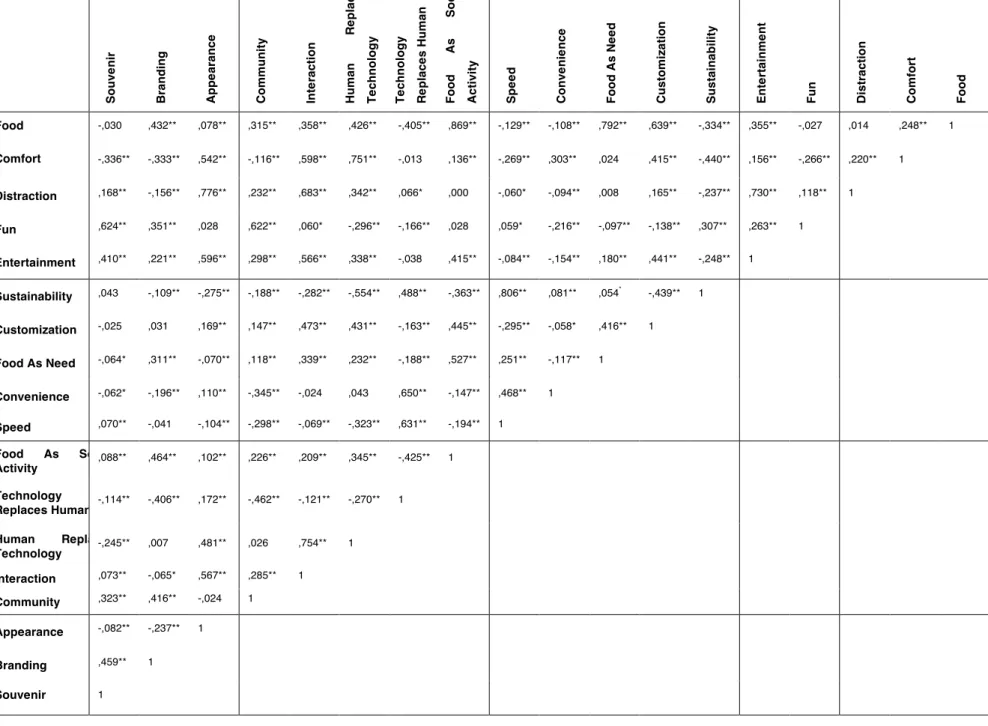
Table 19 shows these patterns and links broke down to the theme level. It shows the
frequencies that two of the themes were found in same specific solution. The shaded
measurements represent the correlations that occurred more than five (5) times. Table 20
shows the significance of the correlations between themes, which was calculated using a
Pearson’s Chi-Squared Test.
A number of clusters appear that show the linkages between numerous of themes.
Interaction was frequently found alongside Appearance, Community, and Human
Replaces Technology. Table 20 reveals that these themes are significantly correlated at
the 0.01 significance level. This provides evidence for their negative correlation. Speed
and Convenience was also frequently found in suggestions that had an element where
Technology Replaces Humans. These themes are significantly correlated at the 0.01
significance level, as can be seen in Table 20. This significance provides support for the
positive correlation of these themes. The themes Interaction and Community are
negatively correlated with Speed and Convenience. The chi-squared analysis provides
support for this positive correlation at the 0.01 significance level.
Physical
Dimension
Social
Dimension
Utilitarian
Dimension
Hedonic
Dimension
Physical
Dimension 1 ,389
**
-,949** ,727**
Social
Dimension 1 -,169
*
,580**
Utilitarian
Dimension 1 -,481
**
Hedonic
Dimension 1
**. Correlation is significant at the 0.01 level (2-tailed).
A large cluster can be found between the themes Souvenir, Branding, Appearance,
Community and Interaction, and Entertainment and Fun. Most of these positive
correlations are significantly correlated at the 0.01 significance level. The cluster Comfort
and Food played a particularly large role in suggestions where Community, Interaction
and Human Replaces Technology were important themes. These positive correlations are
also significant at the 0.01 significance level. Both of these clusters are therefore
composed of significantly correlated themes. This provides the clusters with more support,
TABLE 19 – Cross-Tabulation of Themes
Physical Social Utilitarian Hedonic
So u v e n ir Br a n d in g Ap p e a ra n c e Co m m u n it y In te ra c ti o n Hu m a n R e p la c e s T e c h n o lo gy Te c hno lo g y R e p lac e s H u m an Fo o d a s S o c ia l A c ti v it y Sp e e d Co n v e n ie n c e Fo o d a s N e e d Cu s to m iz a tio n Su s ta in a b ili ty En te rt a in m e n t Fu n Dis tr a c tio n Co m fo rt Fo o d Ph y s ic a l
Souvenir 5 1 2 4 0 1 2 3 4 0 1 0 7 8 1 0 2
Branding 2 5 4 4 0 4 4 4 1 1 0 7 7 0 1 8
Appearance 2 14 5 6 3 4 8 0 1 0 15 6 5 10 5
So
c
ia
l
Community 7 1 0 2 0 2 0 1 0 6 10 2 1 6
Interaction 10 3 4 7 8 2 4 0 20 8 5 14 11
Human Replaces
Technology 0 3 0 4 0 1 0 5 0 0 7 5
Technology Replaces
Human 0 11 11 0 2 1 5 2 1 3 0
Food as Social Activity 2 3 0 1 0 6 3 0 3 9
Ut il it a ri a n
Speed 13 2 0 2 6 7 1 0 5
Convenience 0 2 0 6 4 1 10 6
Food as Need 0 0 1 0 0 0 4
Customization 0 4 1 0 3 5
Sustainability 0 1 0 0 0
He
d
o
n
ic
Entertainment 11 5 6 11
Fun 1 2 5
Distraction 0 0
Comfort 7
43 Souvenir Branding Appearance Community Interaction Human Replace Technology Technology Replaces Human Food As Soc Activity
Speed Convenience Food As Need Customization Sustainability Entertainment Fun Distraction Comfort Food
TABLE 20 – Pearson Chi-Squared Correlations of Themes