Genetic differentiation in geographically close populations
of the water rat
Nectomys squamipes
(Rodentia, Sigmodontinae)
from the Brazilian Atlantic Forest
L.S. Maroja
1, F.C. Almeida
2and H.N. Seuánez
31
Universidade Federal do Rio de Janeiro, Departamento de Genética, Rio de Janeiro, RJ, Brazil.
2Instituto Nacional de Câncer, Diretoria de Pesquisa, Divisão de Genética, Rio de Janeiro, RJ, Brazil.
3Instituto Nacional de Câncer, Diretoria de Pesquisa, Divisão de Genética e
Universidade Federal do Rio de Janeiro, Departamento de Genética, Rio de Janeiro, RJ, Brazil.
Abstract
We examined the genetic structure and the effects of a bottleneck in populations of the water rat Nectomys squamipes, a primary host of Schistosoma mansoni. Eight microsatellite loci were studied in 7 populations from the Sumidouro region of the Brazilian state of Rio de Janeiro. Our data, covering a four-year period during which a bottleneck occurred, revealed substantial variation (6-31 alleles per locus) and high levels of both observed (0.718-0.789) and expected (0.748-0.832) heterozygosity. Most populations were in Hardy-Weinberg equilibrium without linkage disequilibrium between loci. Overall average genetic differentiation between populations (estimated with the FST(θ) and RST(ρ) analogues was 0.037 forθand 0.060 forρ. There was significant allelic and genotypic
differentiation between populations, especially in pairwise comparisons that included the most geographically isolated population. Direct migration estimates showed a low rate of migration, indicating that infectedN. squamipes populations had a limited ability to spread S. mansoni. When the pre- and post-bottleneck populations were compared there was no detectable reduction in heterozygosity or allele number, although a significant excess of heterozygosity was detected in the post-bottleneck population.
Key words:microsatellites, migration, population genetics,Schistosoma mansonihost, Sigmodontinae. Received: January 8, 2003; Accepted: May 29, 2003.
Introduction
Water rats (Nectomys squamipes) are semi-aquatic rodents widely distributed along rivers and streams, includ-ing those located near the large urban areas of eastern Brazil. These water rats are primary hosts forSchistosoma mansoni(Rey, 1993) and although their fitness is not re-duced by infection they are unable to eliminate the parasite (D’Andreaet al., 2000). Dispersion ofN. squamipes popu-lations might spreadS. mansoniwherever the intermediate host (Biomphalariasp.) is present, a possibility aggravated by the fact thatN. squamipeshas a wide geographic distri-bution which encompasses most areas of Brazil where schistosomiasis is endemic.
The study presented in this paper used eight highly polymorphic microsatellite markers to assess gene flow be-tween sevenN. squamipespopulations (separated by
dis-tances of between 500 m and 6,000 m) inhabiting the Sumidouro region of the Brazilian state of Rio de Janeiro where schistosomiasis is prevalent. Because it has been shown (Gentileet al.,2000) thatN. squamipespopulations in the study area fluctuate and there are periods when spe-cific populations reach almost local extinction, we investi-gated the populations both before and after bottlenecking to assess its effects on the genetic diversity ofN. squamipes.
Materials and Methods
Study area
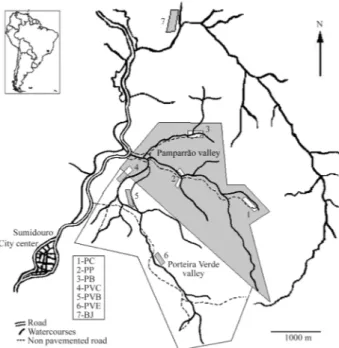
Animals were collected in two adjacent valleys (Pam-parrão and Porteira Verde) and in Bela Joana in the Sumi-douro region (22°02’ S, 40°41’ W) of the Brazilian state of Rio de Janeiro (Figure 1). Both Pamparrão and Porteira Verde valleys form part of a common hydrographic system with several small, permanent streams, irrigation channels and flooded areas, the landscape being composed of small rural establishments with plantations, pasture lands and
www.sbg.org.br
Send correspondence to Héctor N. Seuánez. Instituto Nacional de Câncer, Diretoria de Pesquisa, Divisão de Genética, Rua André Cavalcanti, 37- 4o
andar, 20231-050 Rio de Janeiro, RJ, Brazil. E-mail: genetics@inca.gov.br.
fragments of Atlantic Forest. Distances between capture sites along rivers ranged from 500 to 6,000 m (Table 1). The capture sites in the Pamparrão valley were Sr. Célio (PC), Ponte (PP) and Braço (PB) while the site in the Porteira Verde valley was called Escola (PVE). Two other collecting sites named Banqueta (PVB) and Charco (PVC) were located along an irrigation channel connecting the two valleys. The most isolated site was Bela Joana (BJ), which is located outside these valleys.
Field methods
Capture lines (localities) were established along wa-tercourses and flooded areas with between five and ten wire live traps being set every 13 m. Trapping sessions were conducted for five nights every other month during the mark and recapture phase (September 1995 to November 1996) and the removal phase of the study (April 1997 to
April 2000), a total of 425 traps being laid per night for each trapping session. Detailed descriptions of this field study have been reported elsewhere (D’Andreaet al., 2000; Gen-tileet al., 2000). About 1 mL of blood was taken from the hind foot of 23N. squamipesspecimens captured during the mark and recapture phase of the study. Additionally, liver samples were obtained from 139 specimens captured dur-ing the removal phase of the study.
DNA isolation and microsatellite analysis
Genomic DNA was extracted from blood samples or liver tissue by the standard proteinase-K/phenol-chloroform procedure (Sambrook et al.,1989). Samples were preserved in TE buffer (10 mM Tris, 1 mM EDTA, pH = 7.2) at an approximate concentration of 15µg/mL.
We tested five microsatellite loci described by Al-meidaet al. (2000):Nec28(GenBank AF283428),Nec15
(AF283422 and AF283421), Nec18 (AF283426 and AF283424),Nec14(AF283420 and AF283419) andNec12
(AF283417) and three other characterized by Marojaet al. (2003): Nec23 (AF353186 and AF353187), Nec08
(AF353184 and AF353185) and Nec19 (AF353188 and AF353189). PCR amplifications were performed in a 15 µL final reaction volume containing about 15 ng of genomic DNA template, 10 mM Tris-HCl (pH = 9.0), 50 mM KCl, 2.5 mM MgCl2, 7 pmol fluorescence-labeled
forward primer, 10 pmol reverse primer, 300 (M of each dNTP and 1 UTaqDNA Polymerase (Pharmacia). Cycling conditions were the same as in Almeidaet al. (2000) and Marojaet al. (2003).
Fragment analyses were conducted with an automatic DNA sequencer ABI PRISM 377, with standard loading and electrophoresis conditions following a 3 h run. Alleles were sized relative to an internal size standard (ROX GS 500; Applied Biosystems) and analyzed with GENESCAN 2.1 (Applied Biosystems). Size estimates, in base pairs (bp), were rounded to integers differing by 2 bp.
Statistical analyses
Spatial analysis was performed by pooling data from individuals from the same locality. Inter-population differ-entiation between all population pairs was tested using Fisher’s RxC test (Sokal and Rohlf, 1994), a procedure which analyses each locus to determine differences in allele frequencies providing that the populations under investiga-tion are in Hardy-Weinberg (HW) equilibrium and that all alleles are assumed to be independent. Fisher’s combined probability test was used as a global test for all loci to deter-mine overall significance. These tests were performed with version 1.3 of the Tools for Population Genetic Analysis (TFPGA) program (Miller, 1997).
Genotypic differentiation between different popula-tions and over all the populapopula-tions as a whole was tested with the log-likelihood G statistic using genotype permutations rather than allele permutations, a test that does not require Figure 1- Map of the study area (Sumidouro, RJ, Brazil; 22°02’ S; 42°41’
W) showingNectomys squamipescapture sites. 1 = Sr. Célio (PC); 2 = Ponte (PP); 3 = Banqueta (PVB); 4 = Charco (PVC); 5 = Braço Esquerdo (PB); 6 = Escola (PVE); 7 = Bela Joana (BJ).
Table 1- Approximate distances (in meters) along watercourses between capture sites.
PVB PVE PVC PB PP PC
PVE 1,000 - - - -
-PVC 500 1,600 - - -
-PB 2,500 3,250 2,000 - -
-PP 3,500 3,000 2,250 2,000 -
-PC 3,500 4,250 2,800 3,500 1,500
-BJ 4,500 6,000 4,100 4,750 4,250 5,750
populations to be in HW equilibrium (Goudetet al., 1996). This test was performed with version 3.2a of the GE-NEPOP program (Raymond and Rousset, 1995).
Wright’s FSTanalogue (θ; see Weir and Cockerham,
1984) was used to assess population differentiation, calcu-lations being made using GENEPOP 3.2a. Multilocus val-ues ofθacross all populations were calculated with TFPGA 1.3. This estimate relies on the infinite allele model (IAM) which may not be the most appropriate model for analyzing microsatellite data. For this reason, we also calculated pop-ulation differentiation using the RST estimator (ρ; see
Slatkin, 1995) which is a more accurate estimate when mu-tations follow the stepwise mutation model (SMM), as may be the case with microsatellites (Valdeset al., 1993). The short time scale of this study may prevent significant depar-tures from the SMM (Goldsteinet al., 1995), such devia-tions normally being caused through factors such as lack of constraints on allele size (Bowcocket al., 1994) and the oc-currence of mutations which are independent of allele size (Amoset al., 1996; Levinson and Gut, 1987). Estimates of
ρ were calculated with the RstCalc program (Goodman 1997) after standardizing allele length to eliminate bias and with 5,000 bootstrap replicates for calculating 95% confi-dence intervals, standardization for each locus being per-formed by dividing allele length by the overall standard deviation of the repeat length (Goodman, 1997).
Isolation by distance was tested with the isolde option of GENEPOP 3.2a, differentiation statistics being linearized based on the stepping stone model (Rousset, 1997) usingdiff/ (1-diff), wherediffstands for eitherθorρ
values. Geographic distances were not transformed to a logarithmic scale because dispersion patterns of N. squamipeswere uni-dimensional (along rivers). The Man-tel test (ManMan-tel, 1967) was used to test for a significant rela-tionship between geographic distance and pairwise genetic differentiation.
In spatial analyses, genetic diversity in each popula-tion was estimated from the number of alleles per locus (A), heterozygote direct count per locus (HDC) and mean
ex-pected heterozygosity per locus (HE) under HW
equilib-rium (Hartl and Clark, 1989). Estimates of expected and observed heterozygosity were calculated with non-parametric statistics using TFPGA 1.3 because most vari-ables did not follow a normal distribution. Significant HE
differences between more than two populations were calcu-lated using the Friedman ANOVA program (Zar, 1996).
Linkage disequilibrium between loci was tested with Fisher’s exact test using the Markov chain analysis (3,000 de-memorizations; 450,000 iterations) under a null hypoth-esis postulating lack of genotype association between dif-ferent loci, the calculations being performed with GENEPOP 3.2a. Each population was tested separately to avoid distortions resulting from the Wahlund effect.
Deviations from HW equilibrium for genotype pro-portions at each locus were tested by a Markov Chain
ap-proximation (3,000 de-memorizations; 450,000 iterations) of unbiased exact P-values (Guo and Thompson, 1992). A global test across loci was performed using Fisher’s method, significance levels being calculated per locus, per population for all combined loci and populations (global test) using GENEPOP 3.2a. Wright’s FISanalogue (f; see
Weir and Cockerham, 1984) was estimated with TFPGA, 95% confidence intervals being estimated by bootstrapping with 5,000 replications.
Temporal analysis was carried out by pooling animals from different populations with no significant allelic and genotypic differences captured during the same period. For this analysis we used data from a capture period (April to July 1997) before a bottleneck (November 1997 to August 1998, when there were only 2 or 3 captures per collection session) and after this bottleneck (November 1998 to Au-gust 1999).
To test for effects on microsatellite diversity (Spencer
et al., 2000), we determined A and HDCin pre- and
post-bottleneck populations and used the Wilcoxon signed-rank test to compare A and HDCvalues between capture periods;
A was compared using the same sample size for both popu-lations (18 animals in each). To detect bottlenecks we used the method described by Cornuet and Luikart (1996) which is based on differences between observed and expected heterozygosity according to allele number in a given popu-lation (Nei, 1978), this method relying on the fact that after a bottleneck the number of alleles decreases faster than the expected heterozygosity (Cornuet and Luikart ,1996; Neiet al.,1975). As a negative control, we also tested for hetero-zygote excess in the pre-bottleneck sample by using a two-phase-model (TPM; 5,000 iterations) with 90% of mu-tations following the SMM using the BOTTLENECK pro-gram (Piry et al., 1999), TPM being an intermediate mutation model between IAM and SMM which is espe-cially recommended for the study of microsatellite loci evolution (Rienzoet al., 1994). A test of significance was performed using the Wilcoxon test option, which provides relatively high power and may be applied with few poly-morphic loci and any number of individuals.
To test for multiple sires and as accuracy controls for the microsatellite scores, the microsatellite genotypes of 14 captive-born animals (from 6 captured pregnant females) were compared to the microsatellite genotypes of their mothers. These offspring were excluded from the general population analyses to avoid over-consideration of related alleles.
Results
Differentiation of populations
signifi-cantly different (p < 0.001). When we applied the Bonferroni correction, however, differentiation was not significant for 6 population pairs: PVB/PVE (p = 0.025), PVB/PP (p = 0.027), PVE/PP (p = 0.291), PVE/PC (p = 0.009), PVC/PP (p = 0.089) and PVC/PC (p = 0.013). Analysis of each microsatellite locus showed thatNec15, followed byNec18andNec19, contributed to most of the
differentiation between populations while the smallest con-tribution was due toNec08andNec28.
Significant (p < 0.001) genotypic differentiation was observed for all loci and populations. Each locus showed genotypic differentiation for all populations with the G-likelihood test, with p values ranging from 0.0002 for
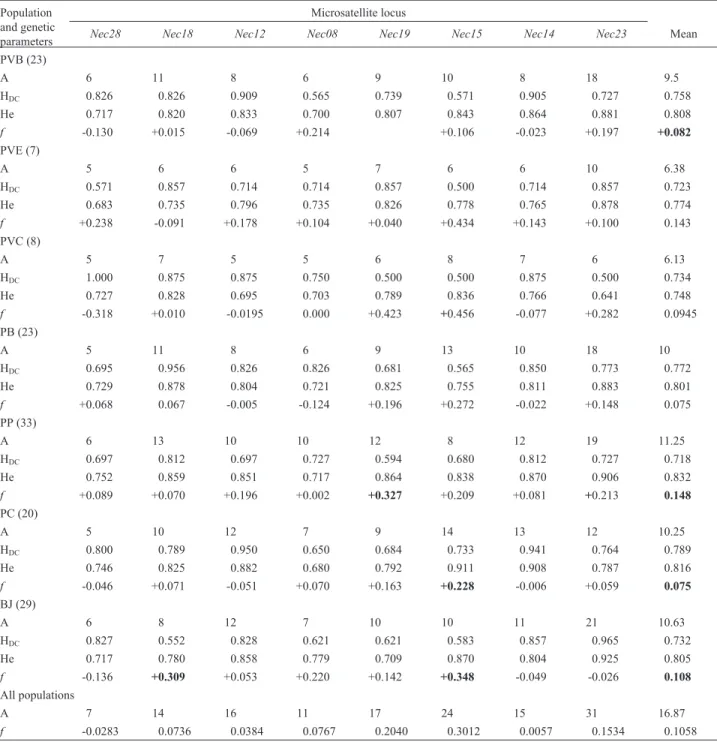
Nec15and 0.0000 for all other loci. Genotypic differentia-Table 2- Genetic diversity inNectomys squamipespopulations.
Population and genetic parameters
Microsatellite locus
Nec28 Nec18 Nec12 Nec08 Nec19 Nec15 Nec14 Nec23 Mean
PVB (23)
A 6 11 8 6 9 10 8 18 9.5
HDC 0.826 0.826 0.909 0.565 0.739 0.571 0.905 0.727 0.758
He 0.717 0.820 0.833 0.700 0.807 0.843 0.864 0.881 0.808
f -0.130 +0.015 -0.069 +0.214 +0.106 -0.023 +0.197 +0.082
PVE (7)
A 5 6 6 5 7 6 6 10 6.38
HDC 0.571 0.857 0.714 0.714 0.857 0.500 0.714 0.857 0.723
He 0.683 0.735 0.796 0.735 0.826 0.778 0.765 0.878 0.774
f +0.238 -0.091 +0.178 +0.104 +0.040 +0.434 +0.143 +0.100 0.143
PVC (8)
A 5 7 5 5 6 8 7 6 6.13
HDC 1.000 0.875 0.875 0.750 0.500 0.500 0.875 0.500 0.734
He 0.727 0.828 0.695 0.703 0.789 0.836 0.766 0.641 0.748
f -0.318 +0.010 -0.0195 0.000 +0.423 +0.456 -0.077 +0.282 0.0945
PB (23)
A 5 11 8 6 9 13 10 18 10
HDC 0.695 0.956 0.826 0.826 0.681 0.565 0.850 0.773 0.772
He 0.729 0.878 0.804 0.721 0.825 0.755 0.811 0.883 0.801
f +0.068 0.067 -0.005 -0.124 +0.196 +0.272 -0.022 +0.148 0.075
PP (33)
A 6 13 10 10 12 8 12 19 11.25
HDC 0.697 0.812 0.697 0.727 0.594 0.680 0.812 0.727 0.718
He 0.752 0.859 0.851 0.717 0.864 0.838 0.870 0.906 0.832
f +0.089 +0.070 +0.196 +0.002 +0.327 +0.209 +0.081 +0.213 0.148
PC (20)
A 5 10 12 7 9 14 13 12 10.25
HDC 0.800 0.789 0.950 0.650 0.684 0.733 0.941 0.764 0.789
He 0.746 0.825 0.882 0.680 0.792 0.911 0.908 0.787 0.816
f -0.046 +0.071 -0.051 +0.070 +0.163 +0.228 -0.006 +0.059 0.075
BJ (29)
A 6 8 12 7 10 10 11 21 10.63
HDC 0.827 0.552 0.828 0.621 0.621 0.583 0.857 0.965 0.732
He 0.717 0.780 0.858 0.779 0.709 0.870 0.804 0.925 0.805
f -0.136 +0.309 +0.053 +0.220 +0.142 +0.348 -0.049 -0.026 0.108
All populations
A 7 14 16 11 17 24 15 31 16.87
f -0.0283 0.0736 0.0384 0.0767 0.2040 0.3012 0.0057 0.1534 0.1058
Key: Population = capture site (PVB = Banqueta; PVE = Escola; PVC = Charco; PB = Braço; PP = Ponte; PC = Sr. Célio; BJ = Bela Joana). The number of animals captured is shown in parentheses. Genetic parameters: A = number of alleles; HDC= direct count HW-equilibrium heterozygosity; He = expected
tion was not observed with the Bonferroni correction for the same 6 population pairs lacking significant allelic dif-ferentiation discussed in the previous paragraph: PVB/PVE (p = 0.0699), PVB/PP (p = 0.1467), PVE/PP (p = 0.509), PVE/PC (p = 0.264), PVC/PP (p = 0.045) and PVC/PC (p = 0.023).
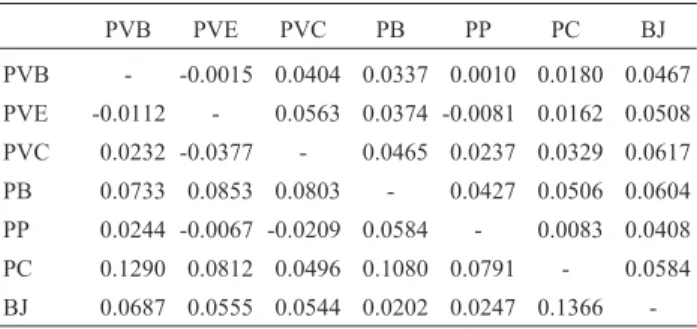
Multilocus values of bothθandρacross all popula-tions indicated significant genetic differentiation (θ= 0.037, 95% confidence interval-CI = 0.049-0.026;ρ= 0.060, 95% CI = 0.0596-0.1232; p < 0.001). Mean values ofθandρ be-tween population pairs were θ = 0.034 ± 0.021 and
ρ= 0.059±0.053 (Table 3). The Mantel test showed no iso-lation by distance (p = 0.117).
Linkage disequilibrium, HW-equilibrium and genetic diversity
All loci were highly polymorphic in all populations, with the mean allele number varying between 11.25±3.88 in the population with the largest sample size (PP; n = 33) to 6.13 ± 1.13 for the population with the second smallest sample size (PVC; n = 8; Table 2). The overall mean allele number was 16.87±7.51, whileNec23showed the highest allele number (31) followed byNec15(24). Mean HDC
val-ues varied between 0.789±0.11 for the PC population and 0.718±0.07 for the PP population. Mean HEvalues varied
between 0.832 ± 0.06 for the PP population and 0.748 ± 0.07 for the PVC population. The mean frequency of private alleles over all loci and populations was 0.038, with population BJ having the highest number of private al-leles (nine, three of which were inNec15), and population PVE (which had the lowest sample size) being the only population having no private alleles. Nec15 and Nec23
showed the highest number of private alleles (nine and four, respectively).
When we analyzed the populations separately we found no statistically significant (p > 0.03 with the Bonfer-roni correction) genotypic linkage disequilibrium but the global test across all populations was significant (p = 0.001) forNec12andNec14, probably because of the
pooling of individuals from different populations . When the global test was performed there was a significant (p < 0.001) deviation from HW-equilibrium, although the lower FISmargin was not very high (FIS= 0.1023; 95%
CI = 0.0379 - 0.1783), probably due to the Wahlund effect. With the Bonferroni correction, HW-equilibrium across loci was significantly (p < 0.001) different from zero for
Nec15,Nec19andNec23.Nec15was in disequilibrium in the PVB, PC and BJ populations (p < 0.001),Nec19was in disequilibrium only in the PP population (p < 0.001) and
Nec23was in HW-equilibrium for each individual popula-tion (p > 0.02). When we excluded these three loci from the global test, deviation from HW equilibrium was consider-ably lower (p < 0.04, FIS= 0.034; 95% CI = 0.067-0.0001).
Effects of the Pamparrão valley population bottleneck
Analysis of the pooled data from the PP, PVB, PVE and PC capture sites did not show any significant difference in the number of alleles per locus or in observed hetero-zygosity between pre- and post-bottleneck populations. However, heterozygosity excess was significantly higher than zero (p = 0.01) in the post-bottleneck population but was not significant in the pre-bottleneck population (p = 0.84).
Analysis of offspring and mothers
Analysis of 6 litters consisting of 14 captive born off-spring showed no inconsistencies in microsatellite al-lele-scoring. There was no evidence of multiple paternity because we did not find more than 4 alleles per locus among the offspring of each litter. Although the number of families was too small to guarantee that offspring of the same litter were always single-sired, it is likely that copulation plugs observed in recently mated females (L.S. Maroja, field ob-servation) probably hindered insemination by more than one male.
Discussion
The eight microsatellite loci investigated were all highly polymorphic, with a mean observed heterozygosity of 0.747 and mean allele number of 16.9 within popula-tions. These results agree with a study of more geographi-cally separateN. squamipespopulations in which the same microsatellite loci showed a mean heterozygosity of 0.83 (Almeida, 2000). This estimate was, however, higher than that reported for small mammals such as the semi-aquatic rodent Arvicola terrestris, described by Steward et al.
(1999) as having a mean microsatellite heterozygosity of 0.63, and Mus musculus populations where the mean microsatellite heterozygosity has been calculated to be
≈0.61 (Dallaset al., 1995).
Geographically close populations of N. squamipes
showed significant differentiation despite the short dis-Table 3 - Estimates of differentiation between Nectomys squamipes
populations. Values above the dashed diagonal are for the FSTestimator
(θ) and those below the diagonal the RSTestimator (ρ).
PVB PVE PVC PB PP PC BJ
PVB - -0.0015 0.0404 0.0337 0.0010 0.0180 0.0467
PVE -0.0112 - 0.0563 0.0374 -0.0081 0.0162 0.0508
PVC 0.0232 -0.0377 - 0.0465 0.0237 0.0329 0.0617
PB 0.0733 0.0853 0.0803 - 0.0427 0.0506 0.0604
PP 0.0244 -0.0067 -0.0209 0.0584 - 0.0083 0.0408
PC 0.1290 0.0812 0.0496 0.1080 0.0791 - 0.0584
BJ 0.0687 0.0555 0.0544 0.0202 0.0247 0.1366
tances separating them, in agreement with previous studies of small rodents which have shown a significant population structure over small spatial scales (Selander, 1970; Dallas
et al., 1995). This significant population differentiation in-dicates that migration is probably restricted (resulting in limited gene flow), this view being supported by ecological studies showing thatN. squamipesdispersion is restricted and that most movement is confined to riverbanks. This finding is relevant in view of the fact thatN. squamipesis a reservoir ofS. mansoni(Ernest and Mares, 1986) and that its extensive distribution covers most areas where schisto-somiasis is endemic (Ribeiroet al., 1998) and where some rodent populations show infection rates higher than 90% (Veiga-Borgeaudet al., 1986, 1987). One of the authors (L.S. Maroja) has noted that direct capture-recapture mi-gration estimates covering the same study area show a low migration rate for N. squamipes, with only 10 (mostly males) out of 162 recaptured animals had moved from their original population (mainly from PVB to PVC) during a six-year period and it is probable that not all of them at-tained reproductive success. This migration pattern sug-gests/indicates thatN. squamipes may not pose a serious threat of spreadingS. mansonion a large scale.
To assess population differentiation we used bothθas an estimate of FSTunder the infinite allele model (IAM) and ρas an estimate of RSTunder the stepwise mutation model
(SMM), two estimates being used because both of these mutation models are controversial when applied to micro-satellite loci. Estoupet al. (1995) found IAM to be more suitable (although this probably applied to a type of micro-satellite repeat motif) whereas other studies have indicated that the SMM is the most adequate model (Valdeset al.,
1993), especially when considering large genetic distances (although this was not the case in our study). Although our estimates ofρwere usually higher thanθ(meanρ/θratio = 3.40±5.52), both estimators generally agreed and popula-tions with significant genotypic differentiation also showed significantρvalues. Although RSTand FSTvalues may be
expected to vary widely between loci for genealogical rea-sons (Slatkin and Barton, 1989), a downward bias in mean FSTvalues (θ) is to be expected in populations that evolved
independently by both drift and mutation. This is because FSTdoes not consider forward and backward mutation in
al-lele size and thus underestimates differentiation between populations (Slatkin, 1995) but also because microsatellites evolve at a much higher mutation rate (Dallas, 1992) which results in a higher number of convergent mutations (homoplasies). Many other studies of natural populations have also reported a downward FSTbias in relation to RST
(Ciofi and Bruford, 1999; Reushet al., 2000; Shawet al., 1999).
A significant bottleneck was found using the methods of Luikart and Cornuet (1998), despite the fact that allelic number and heterozygosity estimates did not differ
be-tween pre- and post-bottleneck populations as was the case for similar studies reported in the literature (Daley, 1992; Ardernet al., 1997). Since the amount of loss of hetero-zygosity depends on the time a population spends in the bottleneck (Neiet al., 1975), our findings might reflect the fact that the bottleneck encompassed only a few genera-tions and, consequently, did not result in any considerable loss of alleles or of heterozygosity. Three alternative hy-potheses might explain these results: firstly, it may have been that alleles were not actually lost and/or any allele loss could not be detected in our small samples; secondly, allele number and heterozygosity could have been re-established by immigration, although this is unlikely to have happened because the populations were analyzed immediately after the bottleneck; thirdly, the bottleneck may not have been as drastic as was indicated by our trap records. The Luikard and Cornuet analysis is preferable to other methods be-cause it does not require genetic data from pre-bottleneck populations (Luikard and Cornuet, 1998), although it is re-stricted to analyzing relatively recent bottlenecks as was the case for our study. Because of the small number of ani-mals captured we pooled more than one generation, but it appears that this did not affect the results because no excess heterozygosity was detected in the pre-bottleneck popula-tion. We may therefore conclude that the genetic diversity ofNectomys squamipespopulations remains high despite undergoing regular bottlenecks. Understanding of this pro-cess might be valuable for conservation genetics of endan-gered species that are loosing genetic variability due to a reduction in effective population size.
Effective population size has been found to increase as a result of multiple rather than single paternity (Sugg and Chesser, 1994), multiple paternity having already been re-ported in several taxa (Avise, 1994) including rodents (Bakeret al., 1999). We found no evidence of multiple pa-ternity in the litters studied by us and since only one or two paternal alleles were detected in these litters they were probably sired by a single male. The fact that insemination by other males may have been hindered has been supported by our field observations which have detected copulatory plugs in recently inseminatedN. squamipesfemales.
Acknowledgments
This work was funded by the Brazilian agencies CNPq-PRONEX 100/98, PROBIO/MMA, FIOCRUZ, FUJB, INCa/FAF and graduate grants from CAPES to LSM and FCA. We are grateful to Paulo S. D’Andrea for providing samples and to the staff of the Laboratório de Biologia e Controle da Esquistossomose (FIOCRUZ), es-pecially JWF Costa, for help with the field work.
References
Almeida FC (2000) Microssatélites em Nectomys squamipes
em um estudo populacional. MSc Dissertation, Universi-dade Federal do Rio de Janeiro Rio de Janeiro.
Almeida FC, Maroja LS, Seuánez HN, Cerqueira R and Moreira MAM (2000) Identification of microsatellite loci in the wa-ter-ratNectomys squamipes(Rodentia Sigmodontinae). Mo-lecular Ecology 9:2172-2173.
Amos W, Sawcer SJ, Feakes RW and Rubinsztein DC (1996) Microsatellites show mutational bias and heterozygote in-stability. Nature Genetics 13:390-391.
Ardern SL, Lambert DM, Rodrigo AG and Mclean IG (1997) The effects of population bottlenecks on multilocus DNA varia-tion in robins. Journal of Heredity 88:179-186.
Avise JC (1994) Molecular Markers Natural History and Evolu-tion. Chapman & Hall Inc, London, 511 pp.
Baker RJ, Makova KD and Chesser RK (1999) Microsatellites in-dicate a high frequency of multiple paternity inApodemus
Rodentia). Molecular Ecology 8:107-111.
Bossart JL and Prowell DP (1998) Genetic estimates of popula-tion structure and gene flow: limitapopula-tions lesson and new di-rections. Trends in Ecology and Evolution 13:202-206. Bowcock A, Ruiz-Linares A, Tomfohrde J, Minch E, Kidd JR and
Cavalli-Sforza LL (1994) High resolution of human micro-satellites. Nature 368:455-457.
Caugley G (1994) Direction in conservation biology. Journal of Animal Ecology 63:215-244.
Ciofi C and Bruford MW (1999) Genetic structure and gene flow among Komodo dragon populations inferred by micro-satellite loci analysis. Molecular Ecology 8:S17-S30. Cornuet J-M and Luikart G (1996) Description and power
analy-sis of two tests for detecting recent population bottlenecks from allele frequency data. Genetics 144:2001-2014. Crow JF and Aoki K (1984) Group selection for a polygenic
be-havioral trait: estimating the degree of population subdivi-sion. Proceedings of the National Academy of Sciences USA 81:6073-6077.
D’Andrea PS, Maroja LS, Gentile R, Cerqueira R, Maldonado Jr A and Rey L (2000) The influence ofSchistosoma mansoni
on a naturally infected population of water-rats in Brazil. Parasitology 120:573-582.
Daley JG (1992) Population reductions and genetic variability in a black-tailed prairie dogs. Journal of Wildlife Management 56:212-220.
Dallas JF (1992) Estimation of microsatellite mutation rates in re-combination inbred strains of mouse. Mammalian Genome 3:452-456.
Dallas JF, Dod B, Boursot P, Prager EM and Bonhomme F (1995) Population subdivision and gene flow in Danish house mice. Molecular Ecology 4:311-320.
Dinerstein E and McCraken GF (1990) Endangered grater one-horned rhinoceros carry high levels of genetic variation. Conservation Biology 4:417-422.
Ernest KA and Mares MA (1986) Ecology of Nectomys squamipesthe neotropical water rat in central Brazil: home-range habitat selection reproduction and behavior. Journal of Zoology 210:599-612.
Estoup A, Garnery L, Solignac M and Cornuet J-M (1995) Microsatellite variation in honey bee (Apis meliferaL) pop-ulations: hierarquical genetic structure and test of the infi-nite allele and stepwise mutation model. Genetics 140:679-695.
Gentile R, D’Andrea PS, Cerqueira R and Maroja LS (2000) Pop-ulation dynamics and reproduction of marsupials and ro-dents in a Brazilian rural area: a five years study. Studies in Neotropical Fauna & Environment 35:1-9.
Goldstein DB, Linares AR, Feldman MW and Cavalli-Sforza LL (1995) An evaluation of genetic data with the use of micro-satellite loci. Genetics 139:463-471.
Goodman S (1997) rst calc: a collection of computer program for calculating unbiased estimates of genetic differentiation and determining their significance for microsatellite data. Mo-lecular Ecology 6:881-885.
Goudet JM, Raymond M, Meeüs T and Rousset F (1996) Testing differentiation in diploid populations. Genetics 144:1933-1940.
Guo SW and Thompson EA (1992) Performing the exact test for Hardy-Weinberg proportion for multiple alleles. Biometrics 48:361-372.
Hartl DL and Clark AG (1989) Principles of Population Genetics 2ndedition Sinauer Associates Inc, Sunderland MA, 481 pp.
Le Page SL, Livermore RA, Cooper DW and Taylor AC (2000) Genetic analysis of a documented population bottleneck: in-troduced Benett’s wallabies (Macropus rufogriseus rufogriseus) in New Zealand. Molecular Ecology 9:753-763.
Levinson G and Gutman G (1987) Slipped-strand mispairing: a major mechanism for DNA sequence evolution. Molecular Biology and Evolution 4:203-221.
Luikart G and Cornuet J-M (1998) Empirical evaluation of a test for identifying recently bottlenecked populations from allele frequency data. Conservation Biology 12:228-237. Mantel N (1967) The detection of disease clustering and a
gener-alized regression approach. Cancer Research 27:209-220. Maroja LS, Almeida FC, Cerqueira R, Seuanez HN and Moreira
MAM (2003) Nectomys squamipesmicrosatellites and ho-mologous loci in sigmodontine rodents. Journal of Heredity 94:171-174.
Miller MP (1997) Tools for population genetic analysis (tfpga) 13: A windows program for the analysis of allozyme and molecular population genetic data Computer software dis-tributed by author.
Nei M (1978) Molecular Evolutionary Genetics. Columbia Uni-versity Press, New York, 512 pp.
Nei M, Maruyama T and Chakraborty R (1975) The bottleneck ef-fect and genetic variability in populations. Evolution 29:1-10.
Piry S, Luikart G and Cornuet J-M (1999) bottleneck 1202: a com-puter program for detecting recent reductions in the effec-tive population size using allele frequency data. Journal of Heredity 90:502-503. Available at http://wwwensaminrafr/ URLB.
Raymond M and Rousset F (1995) Genepop (Version 12): Popu-lation genetics software for exact tests and ecumenism. Jour-nal of Heredity 86:248-249.
Reusch TBH, Stam WT and Olsen JL (2000) A microsatellite-based estimation of clonal diversity and population subdivi-sion inZostera marinaa marine flowering plant. Molecular Ecology 9:127-140.
Ribeiro AC, Maldonado A, D’Andrea PS, Vieira OG and Rey L (1998) Susceptibility ofNectomys rattus(Pelzen 1883) to experimental infection withSchistosoma mansoni(Sabom 1907): a potential reservoir in Brazil. Memórias do Instituto Oswaldo Cruz 93(Suppl 1):295-299.
Rienzo AD, Peterson AC, Gerza JC, Valves AM, Slatkin M and Freimer NB (1994) Mutational process of simple-sequence repeat loci in human populations. Proceedings of the Na-tional Academy of Sciences USA 91:3166-3170.
Rousset F (1997) Genetic differentiation and the detection of gene flow from F-statistics under isolation by distance. Genetics 145:1219-1228.
Sambrook J, Fritcsh E and Maniatis T (1989) Molecular Cloning A Laboratory Manual. 2nd edition. Cold Spring Harbour Laboratory Press, New York.
Selander RK (1970) Behavior and genetic variation in natural populations. American Zoologist 10:53-66.
Shaw PW, Pierce GJ and Boyle PR (1999) Subtle population structuring within a highly vagile marine invertebrate the veined squid Loligo forbesi demonstrated with micro-satellite DNA markers. Molecular Ecology 8:407-417. Slatkin M (1995) A measure of population subdivision based on
microsatellite allele frequencies. Genetics 139:457-462. Slatkin M and Barton NH (1989) A comparison of three indirect
methods for estimating average levels of gene flow. Evolu-tion 43:1349-1368.
Sokal RR and Rohlf FJ (1994) Biometry: the Principles and prac-tice of Statistics in Biological Research. 3rd edition. WH Freeman & Company, New York, 859 pp.
Spencer CC, Neigel JE and Leberg PL (2000) Experimental eval-uation of the usefulness of microsatellite DNA for detecting demographic bottlenecks. Molecular Ecology 9:1517-1528. Steward WA, Pirtney SB and Dallas JF (1998) Isolation and
char-acterization of highly polymorphic microsatellite in the wa-ter vole Arvicola terrestris. Molecular Ecology 7:1247-1263.
Sugg DW and Chesser RK (1994) Effective population sizes with multiple paternity. Genetics 137:1147-1155.
Valdes AM, Slatkin M and Freimer NB (1993) Allele frequencies at microsatellite loci: the stepwise mutation model revisited. Genetics 133:737-749.
Veiga Borgeaud T, Neto RCL, Peter F and Bastos OC (1986) Constatações sobre a importância dos roedores silvestres (Holochilus brasiliensisnanus Thomas 1897) na epidemio-logia da esquistossomose mansônica própria da Pré-Ama-zônia Maranhão-Brasil. Cadernos de Pesquisa de São Luis 2:86-99.
Weir BS and Cockerham CC (1984) Estimating F-statistic for the analysis of population structure. Evolution 38:1358-1370.
Zar JH (1996) Biostatistical Analysis. 3rdedition. Prentice Hall, New Jersey, 929 pp.