Population structure and genetic variability of mainland and insular
populations of the Neotropical water rat,
Nectomys squamipes
(Rodentia,
Sigmodontinae)
Francisca C. Almeida1,2, Luana S. Maroja1, Miguel A.M. Moreira2, Héctor N. Seuánez1,2and Rui Cerqueira3
1
Universidade Federal do Rio de Janeiro, Departamento de Genética, Rio de Janeiro, RJ, Brazil. 2
Instituto Nacional de Câncer, Divisáo de Genética, Rio de Janeiro, RJ, Brazil. 3
Universidade Federal do Rio de Janeiro, Departamento de Ecologia, Rio de Janeiro, RJ, Brazil.
Abstract
Seven microsatellite loci were used to investigate the genetic variability and structure of six mainland and two island populations of the Neotropical water ratNectomys squamipes, a South American semi-aquatic rodent species with a wide distribution. High levels of variability were found within mainland populations while island populations were less variable but the more differentiated in respect to allele number and frequency. The time of biological divergence between mainland and island populations coincided with geological data. A significant geographic structure was found in mainland populations (q= 0.099;r= 0.086) although the degree of differentiation was relatively low in respect to the distance between surveyed localities (24 to 740 km). Genetic and geographic distances were not positively correlated as previously found with random amplified polymorphic DNA (RAPD) markers. Significant but low genetic differentiation in the mainland and lack of isolation by distance can be explained by large population size and/or recent population expansion. Additionally, the agreement between the age of geologic events (sea level fluctuations) and divergence times for insular populations points to a good reference for molecular clock calibration to associate recent environmental changes and the distribution pattern of small mammals in the Brazilian Atlantic Forest.
Key words:microsatellites, population genetics, islands, population expansion, population size, divergence time. Received: September 27, 2004; Accepted: March 22, 2005.
Introduction
The Neotropical water rat, Nectomys squamipes (Brants, 1827), is a semi-aquatic rodent species widely dis-tributed along rivers and streams of the Atlantic Forest and Cerrado biomes in Eastern Brazil. Ecological studies showed that these rodents rarely move farther than 20 m from streams, their home range being restricted to a range of from 200 to 14,808 m2and 90% of displacements occur-ring only in the water or along riverbanks (Bergallo, 1995, MV Vieira, personal communication). These rodents rely on a generalist diet and the availability of riverbank habitats seems to be the only factor affecting their distribution that might also occur in the proximity of urban areas (Gentile,et al., 2000), although their semi-aquatic habits may hinder migration between river basins and across mountain ranges.
Small non-flying mammals have been generally thought to show limited dispersal ability resulting in a pat-tern of structured genetic variability (Koeniget al., 1996; Pattonet al., 1996). A six-year capture-recapture study of N. squamipesin a small area (3 km2) detected only 10 mi-grants (mostly males) out of 162 recaptured individuals with all the displacements occurring between adjacent sites (LS Maroja, personal observation). Microsatellite data, when analyzed in this population, showed significant, al-though minor, differentiation between collection sites (Marojaet al., 2003a). Based on these results and theoreti-cal models, wider areas would be expected to exhibit a higher degree of differentiation among sites. Contrary to these expectations, however, the morphology of N. squamipeswas found to be fairly homogeneous across its wide geographic range (Bonvicino, 1994) and this low de-gree of differentiation between populations was confirmed by random amplified polymorphic DNA (RAPD) studies (Almeidaet al., 2000a). Since morphology may be subject to balancing selection and RAPD markers have well known
www.sbg.org.br
Send correspondence to Héctor N. Seuánez. Instituto Nacional de Câncer, Seção de Genética, Rua André Cavalcante 37, 4° andar, 20231-050 Rio de Janeiro, RJ, Brazil. E-mail: genetics@inca. gov.br.
limitations and are less efficient in detecting differentiation than microsatellite markers (Lynch and Milligan, 1994; Rosset al., 1999; Lougheedet al., 2000), we decided to use microsatellite markers to re-analyze the population samples previously studied using RAPD.
Although sigmodontine rodents are ecologically important and represent a significant portion of all South American mammalian species, only a few molecular studies have been conducted on the geographic variation of these rodents (e.g.Pattonet al., 1996; Loxtermanet al., 1998). To date, the only published report of a popula-tion study using microsatellites is that of Marojaet al. (2003a) who studiedN. squamipes in a restricted area. The lack of taxonomic problems with this rodent along with its researched ecology and wide and well-defined geographic range make N. squamipes a good candidate for studies of population dynamics. Another important reason for studying the population genetics of N. squamipes is that it is a natural primary host for Schistosoma mansoni. Although it is apparently unaf-fected by this parasite, inunaf-fectedN. squamipescan poten-tially spreadS. mansonito uninfected areas (D’Andreaet al., 2000; Marojaet al.2003a).
In this paper we report an analysis of microsatellite data from fiveN. squamipespopulations previously studied with RAPD along with data for one additional mainland and two insularN. squamipespopulations. These islands were expected to have isolated populations which might be useful as comparisons for evaluating the role of dispersal in determining the genetic structure of mainland populations. To check whether the island populations were true isolates we calculated genetic distances and compared them with geological data on Holocene sea level fluctuations.
Materials and Methods
Population samples
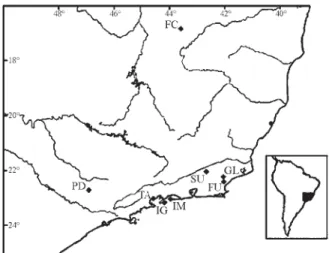
One hundred and tenNectomys squamipeswere cap-tured with Sherman or Tomahawk live traps in eight Brazil-ian localities (Figure 1), six mainland sites at Glicério (GL; n = 26); Fazenda União (FU; n = 8); Sumidouro (SU; n = 18), Tarituba (TA; n = 21) in Rio de Janeiro State; Pedreiras (PD; n = 10) in São Paulo State and Fazenda Canoas (FC; n = 6) in Minas Gerais State and two insular sites Ilha da Marambaia (IM; n = 8) and Ilha Grande (IG; n = 13) in Rio de Janeiro State. The number of specimens is shown in the parentheses. Voucher specimens were depos-ited in the Museu Nacional, Rio de Janeiro, Brazil. Samples from GL, FU, SU, PD and FC had previously been analysed using RAPD (Almeidaet al., 2000a). Geographic distances between mainland localities ranged from 23.7 to 741.5 km. Ilha Grande (IG) is 3.3 km from the mainland and has an area of 193 km2while Ilha de Marambaia (IM) is about four times smaller but is presently connected to the mainland by a small sand strip that probably appeared after the
separa-tion of the island from the mainland some 7,000 years ago (Martins and Villwock, 1987; Cerqueira, 2000).
Most animals were sacrificed and their liver tissue aliquots were preserved in absolute ethanol. Blood was col-lected from the hind foot of several live Ilha Grande ani-mals and kept frozen with EDTA until extraction. Total DNA was extracted from the liver samples following Smith et al.(1987) and from blood samples following Sambrook et al. (1989).
Microsatellite polymorphism analysis
Seven microsatellite markers (Nec08,Nec12,Nec14, Nec15,Nec18,Nec23andNec28) were PCR amplified as previously described (Almeidaet al., 2000b; Marojaet al., 2003b). The forward primer of each locus was labeled with a fluorescent dye (NED, HEX or 6-FAM) and the PCR products run in an automated ABI 377 sequencer with GeneScan 500-ROX (Applied Biosystems) as internal size standard and analyzed with the GeneScan program version 1.2.2 (Applied Biosystems).
Linkage disequilibrium between loci was tested with Fisher’s exact test and the Markov chain procedure with 500,000 iterations and 1,000 de-memorization steps using the Genepop program version 3.4 (Raymond and Rousset, 1995a).
Microsatellite variation
For each population, the number of alleles (A), allelic richness (AR; El Mousadik and Petit, 1996), observed
di-rect-count heterozygosity (HDC) and unbiased expected
heterozygosity (HE; Nei, 1978) were computed for each
lo-cus using the Fstat program version 2.9.3 (Goudet, 2001). Hardy-Weinberg equilibrium (HWE) was tested with Fisher’s exact test and the Markov chain procedure (Guo and Thompson, 1992) with 1,000 de-memorization steps and 100,000 iterations using the Arlequin program version
2.0 (Scheneideret al., 2000). This test was performed sepa-rately for each population and each locus.
Population differentiation and isolation by distance
Genic (allelic frequency) differentiation between mainland populations was assessed with Fisher’s exact test (Raymond and Rousset, 1995b) and genotypic differentia-tion between these populadifferentia-tions using the log-likelihood G test (Goudetet al., 1996), both statistics being calculated using the Genepop program version 3.4 (Raymond and Rousset, 1995a) and 1,000 iterations. Quantitative assess-ments of differentiation between the same populations were calculated with the FSTand RSTestimators. The RST
statistic takes into account the stepwise mutation model (SMM) and for this reason should be more sensitive in de-tecting differentiation with microsatellite data (Slatkin, 1995). The FSTestimator (q) was obtained following Weir
and Cockerham (1984) using Fstat 2.9.3, with mean, stan-dard error and 95% confidence intervals (CI) calculated with permutations over loci. The RST(Slatkin, 1995)
esti-mator (r) was calculated using significance values estab-lished with the RstCalc program version 2.2 (Goodman, 1997) using 1,000 permutations. Pairwise population esti-mates were calculated for bothqandr.
To estimate the contribution of the island populations to the global diversity of N. squamipeswe carried out a three-level AMOVA (Analysis of Molecular Variance) using the Arlequin program version 2.0. Partitions of microsatellite data variance within populations, between populations and between the mainland group and the island group were calculated according to Excoffieret al. (1992). Differences in genetic diversity between mainland popula-tions on one side, and insular populapopula-tions on the other were verified by comparing allelic richness and observed heterozygosity with a permutation test using Fstat 2.9.3.
Following Rousset (1997), isolation by distance (IBD) between mainland populations was tested by com-paring q/1 - q with linear geographic distances between populations with the Mantel test using Genepop 3.4 (2,000 permutations).
Divergence time of insular populations
The divergence time of the IG and IM populations was estimated as T = (dm)2/2v (Goldstein et al., 1995) where T is the divergence time in number of generations,v is the mutation rate and (dm)2is the a genetic distance esti-mate for microsatellite data that takes into account the SMM (calculated with RstCalc 2.2). We calculated (dm)2as
the average of pairwise estimates between mainland and is-land populations and considered the mutation rate to be the same as for the Mus musculus microsatellite loci, i.e. 4.5 x 10⁻⁵per generation (Dietrichet al.,1992). A genera-tion time of 110 days was assumed based on data from cap-tive populations (D’Andreaet al., 1996).
Sequential Bonferroni correction (Rice, 1989) was used for assessing statistical significance in all multiple tests.
Results
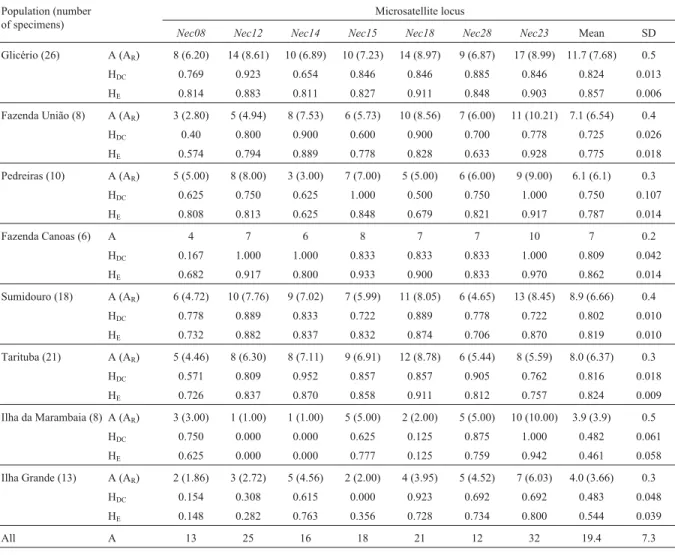
All loci analyzed in this study were highly polymor-phic, with the total allele number ranging from 12 to 32 (Table1). TheNec23locus had the largest number of alleles in the total count and within every population except one (TA). No significant linkage disequilibrium was found be-tween any pair of loci either when pooling all populations or when considering each population separately. Genetic diversity within each population was found to be high, with allele number per locus varying from 1 to 17, and roughly related to sample size (Table 1). Private alleles were ob-served in all populations: seven in GL (inNec12,Nec14, Nec15, Nec18, Nec23), five in PD (in Nec12, Nec15, Nec18), four in FU (inNec14,Nec15,Nec23), six in FC (in Nec08,Nec14,Nec15,Nec23), six in SU (inNec08,Nec15, Nec18,Nec23), four in TA (inNec12,Nec14,Nec15), two in IM (inNec23), and two in IG (inNec08). The highest number of private alleles (10) was found atNec23while Nec28did not show any private allele.
MeanHEwas very high in all mainland populations,
averaging 0.82 with a range of 0.625 to 0.970 (Table 1). The highestHEvalue was found in the FC population
de-spite it having the smallest sample size. The FC popula-tion was excluded from estimates of allelic richness so that this parameter could be calculated using a minimum of eight individuals instead of six, increasing its confi-dence (Table 1).
Departures from HWE were detected in three cases (GL,Nec14; FC,Nec08; IG,Nec15) but these results were not statistically significant following the Bonferroni cor-rection; for the remaining analyses we assumed HWE within populations. These slight departures in specific loci can be accounted for by the presence of population specific null alleles. Since PCR amplifications were generally suc-cessful, null alleles were probably rare. An exception to this occurred in theNec15locus in the IG population for which three individual DNA samples could not be amplified and two different homozygous genotypes were found but het-erozygotes were completely absent.
Both genic and genotypic differentiation between mainland populations were highly significant in each lo-cus and across loci (p < 0.0005). TheNec23locus has a gap of approximately 40 bp between two consecutive al-leles and therefore is not suitable for analysis assuming SMM so we excluded this locus from the RSTand FST
esti-mates in order to make them comparable. Theqestimator of FSTwas 0.100 ± 0.012 (SE) with a 95% CI = 0.082
-0.123, while therestimator of RSTwas 0.086 ± 0.003 (SE)
correlation between genetic and geographic distance was apparent (p = 0.54).
The island populations showed significantly lower genetic diversity when compared to the mainland popula-tions, both in terms ofARandHDC(p = 0.032 and p = 0.027,
one-sided probability). Although we grouped both islands when comparing them with the mainland group, these re-sults are valid for both insular populations because they showed very similar estimates of allelic richness and pro-portion of heterozygotes. The lower variability of island populations reached an extreme value in the IM population, which was monomorphic at two loci (Nec12andNec14) and was the only case of monomorphism. Nevertheless, the genetic diversity found in the two island populations ac-counted for 6.4% of the total diversity. Variation between populations within each group, mainland and islands, accounted for 14.03% of the total variation. Pairwise esti-mates of FSTalso confirmed the high degree of
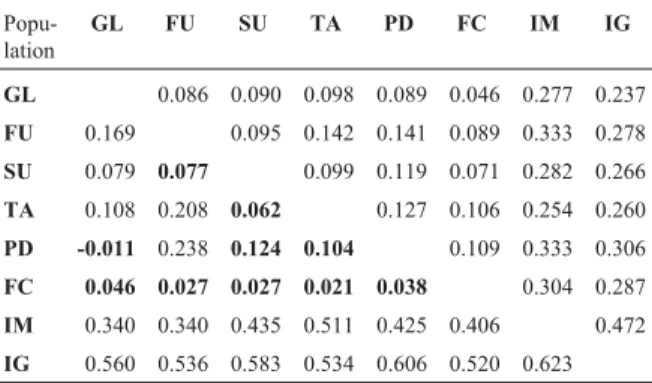
differentia-tion of the island populadifferentia-tions (Table 2). While pairwiseq
values between mainland populations ranged from 0.045 to 0.145, pairwise values involving the island populations ranged from 0.224 to 0.469. The r estimator, although lower than q in mainland comparisons, indicated even higher differentiation in the islands, with values ranging from 0.340 to 0.623 in pairwise comparisons including in-sular populations. This result is in accordance with the proposition that RSTindexes are more sensitive in
compari-sons between populations that have been isolated from each other for a longer time (Slatkin, 1995).
Mean genetic distance (dm)2 between IG and the mainland populations was 1.907 ± 0.175 (±standard devia-tion) corresponding to 21,196 ± 1,941 generations and to a divergence time of 7,065 ± 647 years. Similar estimates be-tween IM and mainland populations showed a mean (dm)2= 0.896 ± 0.192 corresponding to 9,955 ± 2,134 gen-erations and to 3,319 ± 711 years.
Table 1- Genetic diversity ofNectomys squamipespopulations.
Population (number of specimens)
Microsatellite locus
Nec08 Nec12 Nec14 Nec15 Nec18 Nec28 Nec23 Mean SD
Glicério (26) A (AR) 8 (6.20) 14 (8.61) 10 (6.89) 10 (7.23) 14 (8.97) 9 (6.87) 17 (8.99) 11.7 (7.68) 0.5
HDC 0.769 0.923 0.654 0.846 0.846 0.885 0.846 0.824 0.013
HE 0.814 0.883 0.811 0.827 0.911 0.848 0.903 0.857 0.006
Fazenda União (8) A (AR) 3 (2.80) 5 (4.94) 8 (7.53) 6 (5.73) 10 (8.56) 7 (6.00) 11 (10.21) 7.1 (6.54) 0.4
HDC 0.40 0.800 0.900 0.600 0.900 0.700 0.778 0.725 0.026
HE 0.574 0.794 0.889 0.778 0.828 0.633 0.928 0.775 0.018
Pedreiras (10) A (AR) 5 (5.00) 8 (8.00) 3 (3.00) 7 (7.00) 5 (5.00) 6 (6.00) 9 (9.00) 6.1 (6.1) 0.3
HDC 0.625 0.750 0.625 1.000 0.500 0.750 1.000 0.750 0.107
HE 0.808 0.813 0.625 0.848 0.679 0.821 0.917 0.787 0.014
Fazenda Canoas (6) A 4 7 6 8 7 7 10 7 0.2
HDC 0.167 1.000 1.000 0.833 0.833 0.833 1.000 0.809 0.042
HE 0.682 0.917 0.800 0.933 0.900 0.833 0.970 0.862 0.014
Sumidouro (18) A (AR) 6 (4.72) 10 (7.76) 9 (7.02) 7 (5.99) 11 (8.05) 6 (4.65) 13 (8.45) 8.9 (6.66) 0.4
HDC 0.778 0.889 0.833 0.722 0.889 0.778 0.722 0.802 0.010
HE 0.732 0.882 0.837 0.832 0.874 0.706 0.870 0.819 0.010
Tarituba (21) A (AR) 5 (4.46) 8 (6.30) 8 (7.11) 9 (6.91) 12 (8.78) 6 (5.44) 8 (5.59) 8.0 (6.37) 0.3
HDC 0.571 0.809 0.952 0.857 0.857 0.905 0.762 0.816 0.018
HE 0.726 0.837 0.870 0.858 0.911 0.812 0.757 0.824 0.009
Ilha da Marambaia (8) A (AR) 3 (3.00) 1 (1.00) 1 (1.00) 5 (5.00) 2 (2.00) 5 (5.00) 10 (10.00) 3.9 (3.9) 0.5
HDC 0.750 0.000 0.000 0.625 0.125 0.875 1.000 0.482 0.061
HE 0.625 0.000 0.000 0.777 0.125 0.759 0.942 0.461 0.058
Ilha Grande (13) A (AR) 2 (1.86) 3 (2.72) 5 (4.56) 2 (2.00) 4 (3.95) 5 (4.52) 7 (6.03) 4.0 (3.66) 0.3
HDC 0.154 0.308 0.615 0.000 0.923 0.692 0.692 0.483 0.048
HE 0.148 0.282 0.763 0.356 0.728 0.734 0.800 0.544 0.039
All A 13 25 16 18 21 12 32 19.4 7.3
Discussion
Microsatellite data indicate little differentiation be-tween mainland populations of Nectomys squamipes lo-cated between 23 to 740 km apart. Differentiation estimates were very low even when compared to data of other rodent species (Stewart et al., 1999; Loxterman et al., 1998; Wlasiuket al., 2003). A likely explanation for our results is that gene flow might be higher than suggested by field stud-ies. The greater differentiation of island populations, in view that they are isolated from any other, may support this hypothesis. However, an alternative explanation that does not conflict with predictions and field estimates of N. squamipesdispersal ability is also possible, and low esti-mates of differentiation might be a consequence of a recent rapid range expansion and/or very large local populations resulting in the absence of migration-drift equilibrium (Kimura and Weiss, 1964; Slatkin, 1989; Slatkin, 1993; Neigel, 1997; Whilock and McCauley, 1999). Lack of iso-lation by distance, as found in our data, is typical of popula-tions that have not yet attained equilibrium (Hutchinson and Templeton, 1999).
It has been theoretically demonstrated that popula-tions with a large size will attain equilibrium (basically de-termined by drift) in a very long time, proportional to the size of the population (Slatkin, 1993; Neigel, 1997; Whilock and McCauley, 1999). The high degree of vari-ability observed by us indicates fairly large population sizes on the mainland (Estoupet al., 1995). Another reason for populations not being in equilibrium could be a recent population expansion. The isolation by distance trend (al-though not significant) found in a considerably smaller area (Marojaet al., 2003a) is in accordance with this hypothesis because equilibrium is first reached between nearby popu-lations (Crow and Aoki, 1984). Although it has been sug-gested that population expansions result in low genetic
variability (Slatkin, 1993), there is empirical evidence that fast expansions may occur without significant loss of vari-ability (Zengeret al., 2003). Tests for population expansion are available for analyzing microsatellite data, but due to the limitations that will be discussed in the next paragraphs, we chose to not use them in the present study. The results presented here, however, provide a preliminary indication of population expansion of a widespread rodent species in eastern South America and should encourage further inves-tigations on the subject.
The microsatellite loci used in this study showed dif-ferentiation indexes (q= 0.100 andr= 0.086) smaller than the index (FST= 0.17) obtained in the previous RAPD
anal-ysis that included most of the mainland populations studied here (Almeidaet al., 2000a). Differentiation estimates re-lated to theF-statistics are negatively correlated with the product of the effective population size (Ne), and the muta-tion rate (m) plus the migration rate (m) (Wright, 1943). This implies that, ifmis low and Ne and m are high, differ-entiation will be underestimated even in the extreme case of complete isolation (Jin and Chakraborty, 1995; Hedrick, 1999; Ballouxet al., 2000). This is especially critical in the case of microsatellites that are susceptible to a high degree of homoplasy due to constraints in allele size (Slatkin, 1995). Microsatellite markers can also be problematic when the number of alleles per locus is relatively high as is the case for some of the loci with more than 20 alleles which were used in this study (Table 1). When a loci has a large number of alleles, very large samples are required for accurately estimating allelic frequency within populations (Leberg, 2002). Simulations by Leberg (2002), suggest that our samples may not be large enough to provide reliable es-timates of population differentiation in view of the large number of alleles in most loci. The high variability of each mainland population is, however, a valid finding, indicat-ing large population sizes and relative stability on a recent time scale.
This is the first report of higher differentiation de-tected with RAPD markers as opposed to microsatellites. Although the FSTestimate based on RAPD markers is only
slightly higher, it is probably more reliable in view of the limitations of some microsatellite loci as discussed above. Nevertheless, we can reasonably propose that the degree of differentiation between mainland populations is low de-spite predictions based on the ecology ofN. squamipes. Sampling a larger number of individuals per population can make differentiation estimates more accurate, although other less variable molecular markers like mtDNA might be more suitable for the study of rodent populations (Matocqet al., 2000).
Despite the small sample sizes we were able to detect a higher differentiation in insular than mainland popula-tions, agreeing with the geographic isolation of the island populations. The divergence time of the IG population esti-mated from genetic distance (7,065 ± 647 years) was
coin-Table 2- Pairwise estimates ofq(above diagonal) andr(below diagonal) betweenN. squamipespopulations. Values in bold are not significant (Bonferroni correction).
Popu-lation
GL FU SU TA PD FC IM IG
GL 0.086 0.090 0.098 0.089 0.046 0.277 0.237
FU 0.169 0.095 0.142 0.141 0.089 0.333 0.278
SU 0.079 0.077 0.099 0.119 0.071 0.282 0.266
TA 0.108 0.208 0.062 0.127 0.106 0.254 0.260
PD -0.011 0.238 0.124 0.104 0.109 0.333 0.306
FC 0.046 0.027 0.027 0.021 0.038 0.304 0.287
IM 0.340 0.340 0.435 0.511 0.425 0.406 0.472
IG 0.560 0.536 0.583 0.534 0.606 0.520 0.623
cident with the minimum time of geographic separation predicted by geological data (7,000 years before the present (YBP); Martins and Villwock, 1987), while estimates of di-vergence time of the IM population were considerably lower (3,319 ± 711 years). One explanation for this discrep-ancy is a greater migration rate of the IM population be-cause the Ilha da Marambaia is presently connected and closer to the mainland. This connection, however, consists of a very narrow sand-bridge (at some points only 2-meters wide) making water-rat migration rather unlikely. Disper-sion by rafting (Loxtermanet al., 1998; Pattonet al., 1996) and sea level fluctuations might provide a better explana-tion because two low-sea-level events at ca. 3,900 and 2,700 YBP coincide temporally with the above cited diver-gence time for the IM population and would have reduced the distance between Marambaia Island and the mainland (Martins and Villwock, 1986).
It is important to remember that most of the diver-gence of the insular populations is due to their low genetic variability. The existence of fewer alleles than in the main-land populations leads to differences in allelic frequency, which greatly affects differentiation estimates. Reduced di-versity is expected to be found in island populations be-cause these populations are more subject to the effects of geographic isolation, smaller population size and founder effect (Grant, 1998). Even in the case of an extreme founder effect, however, the high mutation rates of microsatellites should be enough to restore the genetic variability in these islands given the large number of generations after isola-tion. Nevertheless, this would not be true if the islands had very small populations and/or went through a recent popu-lation bottleneck. At least Ilha Grande seems to be large enough to support a large population. Currently, both is-lands are relatively well preserved. Ilha Grande has most of its inland area protected and the occupation of the remain-ing areas is under government control. Ilha da Marambaia is a military area of restricted access and is also largely for-ested. Both islands, however, were subjected to sugar cane and coffee monoculture from the middle of the XVIII cen-tury to the end of the XIX cencen-tury. Although the human population of these islands has never been large, andN. squamipesis capable of living in populated areas, it is diffi-cult to assess whether past activities in these two islands have affected the population of this rodent on these islands. A larger survey of these islands, sampling more sites and using different markers, would be necessary to test for pop-ulation bottlenecks in the recent history of these popula-tions.
Acknowledgments
This project was supported by PROBIO/MMA, PRONEX, INCa/FAF and FUJB (Brazil). We are also grateful to Drs. PS D’Andrea, L Geise and CR Bonvicino for providing some of the animals herein analyzed and to our colleagues from the Laboratório de Vertebrados
(UFRJ) and from the team of mammalogists of the Labo-ratório de Zoologia de Vertebrados (UERJ) for helping us in field work. FC Almeida and LS Maroja were recipients of CAPES graduate grants (Brazil).
References
Almeida FC, Moreira MAM, Bonvicino CR and Cerqueira R (2000a) RAPD analysis ofNectomys squamipes(Rodentia, Sigmodontinae) populations. Genet Mol Biol 23:793-797. Almeida FC, Maroja LS, Seuánez HN, Cerqueira R and Moreira
MAM (2000b) Identification of five microsatellites in the water ratNectomys squamipes(Rodentia, Sigmodontinae). Mol Ecol 9:2172-2173.
Balloux F, Brünner H, Lugon-Moulin N, Hausser J and Goudet J (2000) Microsatellites can be misleading: An empirical and simulation study. Evolution 54:1414-1422.
Bergallo HG (1995) Os efeitos da disponibilidade de alimentos e dos fatores climáticos na reprodução, condição, crescimento e uso do espaço por quatro espécies de roedores no sudeste do Brasil.PhD Thesis, Universidade Estadual de Campinas, Campinas.
Bonvicino CR (1994) Especiação do rato d’água Nectomys
(Rodentia, Cricetidae). Abordagem cariológica, morfoló-gica e geográfica.PhD Thesis, Universidade Federal do Rio de Janeiro, Rio de Janeiro.
Cerqueira R (2000) Biogeografia das restingas. In: Lacerda LD and Esteves FA (eds), A Ecologia das Restingas e Lagoas. NUPEM/UFRJ, Macaé, pp 65-75.
Crow JF and Aoki K (1984) Group selection for a polygenic be-havioral trait: Estimating the degree of population subdivi-sion. Proc Natl Acad Sci USA 81:6073-6077.
D’Andrea PS, Horta C, Cerqueira R and Rey L (1996) Breeding of the water rat (Nectomys squamipes) in the laboratory. Lab Anim 30:369-376.
D’Andrea PS, Maroja LS, Gentile R, Cerqueira R and Rey L (2000) The parasitism ofSchistosoma mansoni (Digenia-Trematoda) in a naturally infected water rates, Nectomys squamipes (Rodentia-Sigmondontinae). Parasitology 120:573-582.
Dietrich W, Katz H, Lincoln SE, Shin H, Friedman J, Dracopoli NC and Lander ES (1992) A genetic map of the mouse suit-able for typing intraspecific crosses. Genetics 131:423-447. El Mousadik A and Petit RJ (1996) High level of genetic
differen-tiation for allelic richness among populations of the argan tree [Argania spinosa(L.) Skeels] endemic of Morocco. Theor Appl Genet 92:832-839.
Estoup A, Tailliez C, Cornuet J-M and Solignac M (1995) Size homoplasy and mutational processes of interrupted micro-satellite in two bee species, Apis mellifera and Bombus terrestris(Apidae). Mol Biol Evol 12:1074-1084. Excoffier L, Smouse P and Quattro J (1992) Analysis of
molecu-lar variance inferred from metric distances among DNA haplotypes: Application to human mitochondrial DNA re-striction data. Genetics 131:479-491.
Gentile R, D’Andrea PS, Cerqueira R and Maroja LS (2000) Pop-ulation dynamics and reproduction of marsupials in a Brazil-ian rural area: A five-years study. Stud Neotrop Environ 35:1-9.
and the origin of modern humans. Proc Natl Acad Sci USA 92:6723-6727.
Goodman SJ (1997) Rst Calc: A collection of computer programs for calculating estimates of genetic differentiation from microsatellite data and determining their significance. Mol Ecol 6:881-885.
Goudet J (2001) FSTAT, a program to estimate and test gene di-versities and fixation indexes (version 2.3.9). Available from http://www.unil.ch/izea/softwares/fstat.html. Updated from Goudet (1995).
Goudet J, Raymond M, Meeüs T and Rousset F (1996) Testing differentiation in diploid populations. Genetics 144:1933-1940.
Grant P (1998) Evolution on Island. Oxford University Press, Nova York, 334 pp.
Guo SW and Thompson EA (1992) Performing the exact test for Hardy-Weinberg proportion for multiple allele. Biometrics 48:361-372.
Hedrick PW (1999) Perspective: Highly variable loci and their in-terpretation in evolution and conservation. Evolution 53:313-318.
Huchinson DW and Templeton AR (1999) Correlation of pair-wise genetic and geographic distance measures: Inferring the relative influences of gene flow and drift on the distribu-tion of genetic variability. Evoludistribu-tion 53:1898-1914. Jin L and Chakraborty R (1995) Population structure, stepwise
mutation, heterozygote deficiency and their implication in DNA forensics. Heredity 74:274-285.
Kimura M and Weiss GH (1964) The stepping stone model of population structure and the decrease of genetic correlation with distance. Genetics 49:561-576.
Koenig WD, Vuren DV and Hooge PN (1996) Detectability, phylopatry, and the distribution of dispersal distances in ver-tebrates. Trends Ecol Evol 11:514-517.
Leberg PL (2002) Estimating allelic richness: Effects of sample size and bottlenecks. Mol Ecol 11:2445-2449.
Lougheed SC, Gibbs HL, Prior KA and Weatherhead PJ (2000) A comparison of RAPD versus microsatellite DNA markers in population studies of the Massasauga rattlesnake. J Hered 91:458-463.
Loxterman JL, Moncrief ND, Dueser RD, Carson CR and Pagels JF (1998) Dispersal abilities and genetic population struc-ture of insular and mainland Oryzomys palustris and
Peromyscus leucopus. J Mammal 79:66-77.
Lynch M and Milligan BG (1994) Analysis of populational ge-netic structure with RAPD markers. Mol Ecol 3:91-99. Maroja LS, Almeida F and Seuanez H (2003a) Genetic
differenti-ation in geographically close populdifferenti-ations of the water rat
Nectomys squamipes(Rodentia, Sigmodontinae) from the Brazilian Atlantic Forest, Brazil. Genet Mol Biol 26:403-410.
Maroja LS, Almeida F, Seuánez HN, Cerqueira R and Moreira MM (2003b)Nectomys squamipesmicrosatellites and ho-mologous loci in sigmodontine rodents. J Hered 94:171-174. Martins LR and Villwock JA (1987) Eastern South America qua-ternary coastal and marine geology: A synthesis. UNESCO Reports in Marine Science 43: Quaternary Coastal of West Africa and South America. UNESCO, Dakar, pp 28-96. Matocq MD, Patton JL and da Silva MNF (2000) Population
ge-netics structure of two ecologically distinct Amazonian
spiny rats: Separating history and current ecology. Evolu-tion 54:1423-1432.
Nei M (1978) Estimation of average heterozygosity and genetic distance from a small number of individuals. Genetics 89:583-590.
Neigel JE (1997) A comparison of alternative strategies for esti-mating gene flow from genetic markers. Annu Rev Ecol Syst 28:105-128.
Patton JL, da Silva MNF and Malcolm JR (1996) Hierarchical ge-netic structure and gene flow in three sympatric species of Amazonian rodents. Mol Ecol 5:229-238.
Raymond M and Rousset F (1995a) GENEPOP (version 1.2): Population genetics software for exact tests and ecumenicism. J Hered 86:248-249.
Raymond M and Rousset F (1995b) An exact test for population differentiation. Evolution 49:1280-1283.
Rice WR (1989) Analyzing tables of statistical tests. Evolution 43:223-225.
Ross KG, Shoemaker DD, Krieger MJB, DeHeer CJ and Keller L (1999) Assessing genetic structure with multiple classes of molecular markers: A case study involving the introduced fire antSolenopsis invicta. Mol Biol Evol 16:525-543. Rousset F (1997) Genetic differentiation and estimation of gene
flow fromF-statistic under isolation by distance. Genetics 145:1219-1228.
Sambrook J, Fritsch EF and Maniatis T (1989) Molecular cloning: A laboratory manual. Cold Spring Harbor Laboratory Press, Nova York, 999 pp.
Scheneider S, Roessli D and Excoffier L (2000) ARLEQUIN ver-sion 2.0. A software for population genetics data analysis. Genetics and Biometry Laboratory, Dept. of Anthropology and Ecology, University of Geneva, Switzerland.
Slatkin M (1989) Population structure and evolutionary progress. Genome 31:196-202.
Slatkin M (1993) Isolation by distance in equilibrium and non-equilibrium populations. Evolution 47:264-279.
Slatkin M (1995) A measure of population subdivision based on microsatellite allele frequencies. Genetics 139:457-462. Smith LJ, Braylan RC, Nutkis JE, Edmundson KB, Downing JR
and Wakeland EK (1987) Extraction of cellular DNA from human cells and tissues fixed with ethanol. Analytical Bio-chemistry 160:135-138.
Stewart WA, Dallas JF, Piertney SB, Marshall F, Lambin X and Telfer S (1999) Metapopulation genetic structure in water vole,Arvicola terrestris, in NE Scotland. Biol J Linn Soc Lond 68:159-171.
Weir BS and Cockerham CC (1984) EstimatingF-statistic for the analysis of population structure. Evolution 38:1358-1370. Wlasiuk G, Graza JC and Lessa EP (2003) Genetic and
geo-graphic differentiation in the Rio Negro tuco-tuco (Ctenomys rionegrensis): Inferring the roles of migration and drift from multiple genetic markers. Evolution 57:913-926.
Whitlock MC and McCauley DE (1999) Indirect measures of gene flow and migration: Fst = 1/(4Nm + 1). Heredity 82:117-125.
Wright S (1943) Isolation by distance. Genetics 28:114-138. Zenger KR, Richardson BJ and Vachot-Griffin A-M (2003) A
rapid population expansion retains diversity within Euro-pean rabbits in Australia. Mol Ecol 12:789-794.