Intraspecific differentiation of Chilean isolates of the entomopathogenic
fungi
Metarhizium anisopliae
var.
anisopliae
as revealed by RAPD,
SSR and ITS markers
Viviana Becerra Velásquez
1, Mario Paredes Cárcamo
1, Carmen Rojo Meriño
1, Andrés France Iglesias
2and Jorge Franco Durán
31
Genetic and Plant Breeding Department, Instituto de Investigaciones Agropecuarias, INIA Quilamapu,
Chillán, Chile.
2
Agronomy Department, Instituto de Investigaciones Agropecuarias, INIA Quilamapu, Chillán, Chile.
3
Department of Biometrics, Statistics and Computer Sciences, Facultad de Agronomía,
Universidad de la República, Montevideo, Uruguay.
Abstract
The genusMetarhizium consists of a diverse group of asexual entomopathogenic fungi, which have a wide geo-graphical distribution. The Chilean National Agricultural Research Institute (Instituto de Investigaciones Agro-pecuarias - INIA, Quilamapu Chile) has collected about 350 isolates ofMetarhizium anisopliae var. anisopliae from central and southern Chile. These isolates have been partially characterized using morphological traits such as conidia size and shape, colony color, growth pattern and the efficiency of the isolates in controlling specific pests. However, further characterization with molecular markers could detect differences in DNA which could help to better understand the genetic diversity and structure of Chilean populations of this fungus. We analyzed approximately 10% of the INIA collection (39 isolates selected at random) collected from different geographical origins using the polymerase chain reaction (PCR)-random amplified polymorphic DNA (RAPD) method, simple sequences repeat (SSR or microsatellites) analysis and the PCR-restriction fragment length polymorphism (RFLP) assay of internal transcribed spacer (ITS)-rDNA sequences. The RAPD data revealed high genetic diversity in this fungus and an av-erage of 41% of similarity while SSR analysis detected 45.2% similarity and the ITS markers 70.2% similarity. For the three molecular markers, this diversity was not associated with the geographical origin of these isolates.
Key words: Metarhizium, genetic diversity, RAPD, SSR, ITS markers.
Received: January 19, 2006; Accepted: June 27, 2006.
Introduction
Entomopathogenic fungi are an attractive alternative for the biological control of insect pests, mainly because they are safer for plants, animals and the environment rela-tive to conventional pesticides (Khetan, 2001). Further-more, such fungi have also been evaluated as biological control agents for more than 200 economically important insects species (Tanada and Kaya, 1993; Maurer et al., 1997; Zurek and Keddie, 2000). Since 1996, the Insect-Pathology Program at the Chilean National Agricultural Research Institute (Instituto de Investigaciones Agrope-cuarias - INIA, Quilamapu, Chile) has collected over 1000 isolates of entomopathogenic fungi from throughout the
Chile, with about 350 isolates having been classified as
Metarhizium anisopliae var. anisopliae (Guerrero et al., 1999; France et al., 2000) according the parameters de-scribed by Humber (1997) and Alves (1998). This germplasm is important, since Chile’s ecological condi-tions show contrasting climates varying from hot and dry areas in the North to the very wet and cold areas near the Antarctic in the South. Preliminary research has indicated that many of these isolates show promising pathogenicity against important Coleoptera insect pests (France et al., 2000).
Several kinds of molecular techniques have been used to study genetic diversity, for example, labeled probes to detect restriction fragment length polymorphism (RFLP) (Hegedeus and Khachatourians, 1993; Maureret al., 1997) and methods based on the polymerase chain reaction (PCR) such as the use of random amplified polymorphic DNA
www.sbg.org.br
Send correspondence to Viviana Becerra Velásquez. Genetic and Plant Breeding Department, Instituto de Investigaciones Agrope-cuarias, NIA Quilamapu, Casilla 426, Chillán, Chile. E-mail: vbecerra@ inia.cl.
(RAPD) (Feganet al., 1993; Bidochkaet al., 1994; Piattiet al., 1998; Freire, 2001; Jensenet al., 2001; Gaitanet al., 2002), simple sequences repeat (SSR or microsatellites) analysis (Kretzneret al., 2000; Enkerliet al., 2001, 2005) and internal transcribed spacer (ITS)-rDNA sequence RFLP analysis (Rakotonirainyet al., 1994; Buscotet al., 1996; Coateset al., 2002a). Even though they have differ-ent and complemdiffer-entary discriminatory power RAPD, SSR and RFLP analysis have been very effective in detecting genetic diversity in several species (Couteaudier et al., 1998; Glare and Inwood, 1998; Coates et al., 2002b; Enkerliet al., 2005). In Chile, however, there has been no previous molecular characterization of entomopathogenic fungi populations.
The PCR technique combined with RAPD analysis (Welsh and McClelland, 1990; Williamset al., 1990) has been extensively used to determine the genetic diversity of various entomopathogenic fungi (Cobb and Clarkson, 1993; Bidochka et al., 1994; Neuvéglise et al., 1994; Neuvéglise and Brygoo, 1994; Bidochka et al., 1995; Hodgeet al., 1995; Fungaro et al., 1996; Maurer et al., 1997) includingMetarhizium(Feganet al., 1993; Leal et al., 1994) and to relate genetic diversity to pathogenicity in-dex (Bridgeet al., 1997) and to identify strains (Milneret al., 2002).
More recently, SSR markers have been used as pow-erful molecular markers for the study of the population ge-netics of fungi (Coateset al., 2002a; Enkerliet al., 2001; 2005), SSR markers being particularly useful because they are highly polymorphic (multi-allelic) between strains due to the variation of the number of repeats, co-dominant and highly reproducible compared with other markers. The main disadvantage of SSR markers is that the development of primers is time-consuming and expensive, but this can be offset by the fact that transferability of primer sequences within genera is high and allows primers to be shared be-tween laboratories.
Nuclear ribosomal RNA sequences, especially the two internal transcribed spacers (ITS1 and ITS2), have demonstrated differential rates of nucleotide changes that allow intra-specific comparison of fungi (Neuvegliseet al., 1994; Buscotet al., 1996). The treatment of PCR-amplified DNA fragments with restriction endonucleases forms the basis of the RFLP technique which has been used to investi-gate the inter and intraspecific diversity of the ITS se-quences of entomopathogenic fungi (Coateset al., 2002 b). Shihet al.(1995) reported a moderate level of mutation in the ITS1 region ofBeauveria bassiana, although ITS2 was invariant for in this specie. However, Beauveria brongniartii isolated from a single host showed higher ITS2 sequence variation (Neuveglise and Brygoo, 1994) and at least 5 RFLPs have been detected amongBeauveria
species (Neuvegliseet al., 1994; Glare and Inwood, 1998) for the ITS regions, considered to be a well-conserved se-quence.
The objectives of this study were to determine the level of genetic diversity in a core sample of Chilean iso-lates ofMetarhizium anisopliae var anisopliaeusing sev-eral molecular markers and to evaluate different molecular markers which are suitable for the genetic fingerprinting of this enthomopathogen.
Material and Methods
Fungal strains and DNA extraction.
We investigated 39 of the approximately 350
Metarhizium anisopliaevar. anisopliae(Franceet al., 2000) isolates collected from different geographic hosts and re-gions of Chile and maintained in the Chilean National Agri-cultural Research Institute (Instituto de Investigaciones Agropecuarias - INIA, Quilamapu, Chile) collection, details of the strains investigated being shown in Table 1.
Monosporic cultures of the fungi were obtained by plating multisporic isolates onto Petri plates containing po-tato dextrose agar (PDA: containing (gL-1) Dextrose, 20; Potato extract, 20; agar, 20) and incubating the plates at 27 °C for 3 days and then cultivating single spore colonies in Sabouraud media: containing (gL-1) Peptone, 10; Dex-trose, 40; agar, 20; supplemented with 1% (w/v) of yeast extract (Difco, France) to produce mycelium for DNA ex-traction.
For each fungal isolate, about 50 mg of mycelium was homogenized in DNA extraction buffer (100 mM Trizma; 1.4 M NaCl; 20 mM EDTA; 1% polyvinylpyrrolidone; 2% cetyltrimethylammonium bromide (CTAB); 1% mercapto-ethanol; 10 mg/mL proteinase K; pH 8.0) and incubated for 45 min at 65 °C. After incubation the mixture was extracted twice with 24:1 chloroform:isoamyl alcohol, centrifuged at 3500 revs min-1for 15 min and the DNA precipitated with isopropanol and stored at -20 °C overnight, after which the DNA was washed with 70% and 95% alcohol, dried at room temperature and re-suspended in 150mL of TE buffer pH 8.0. The DNA concentration was measured with a fluorometer and the DNA stock solutions kept at -80 °C un-til needed. All percentages w/v.
RAPD analysis
For each isolate, PCR-RAPD of the extracted DNA was performed in a PTC-220 thermocycler (Dyad MJ Re-search) for 40 cycles of 35 s at 94 °C, 35 s at 40 °C and 1 min at 72 °C, and a final additional 10 min cycle at 72 °C. Reactions were carried out in a total volume of 25mL con-taining 0.2mM of dNTPs, 0.2mM of the primer, 1x PCR amplification buffer, 0.3 mM of MgCl2, 1 U Taq DNA Polymerase (Invitrogen) and 25 g of DNA template and ultrapure water. Reactions were done twice to evaluate the consistency of the banding patterns for all isolates studied.
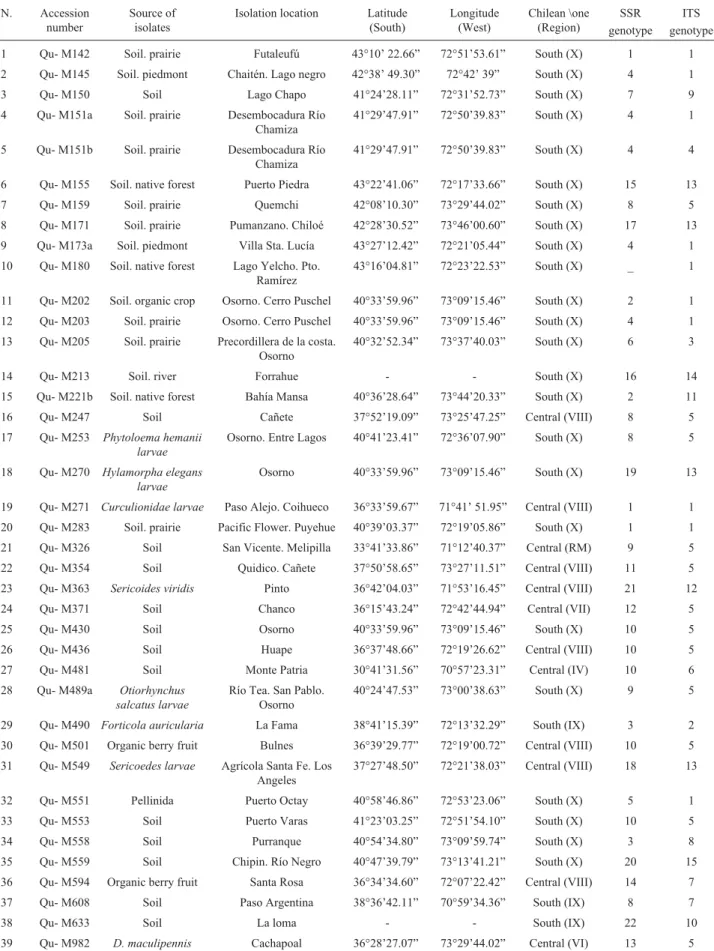
Table 1- The source of the 39 ChileanMetarhizium anisopliaevar.anisopliaeisolates investigated and their random amplified polymorphic DNA (RAPD), simple sequence repeat (SSR) and internal transcribed spacer (ITS) genotypes.
N. Accession
number
Source of isolates
Isolation location Latitude (South)
Longitude (West)
Chilean \one (Region)
SSR genotype
ITS genotype
1 Qu- M142 Soil. prairie Futaleufú 43°10’ 22.66” 72°51’53.61” South (X) 1 1
2 Qu- M145 Soil. piedmont Chaitén. Lago negro 42°38’ 49.30” 72°42’ 39” South (X) 4 1
3 Qu- M150 Soil Lago Chapo 41°24’28.11” 72°31’52.73” South (X) 7 9
4 Qu- M151a Soil. prairie Desembocadura Río
Chamiza
41°29’47.91” 72°50’39.83” South (X) 4 1
5 Qu- M151b Soil. prairie Desembocadura Río
Chamiza
41°29’47.91” 72°50’39.83” South (X) 4 4
6 Qu- M155 Soil. native forest Puerto Piedra 43°22’41.06” 72°17’33.66” South (X) 15 13
7 Qu- M159 Soil. prairie Quemchi 42°08’10.30” 73°29’44.02” South (X) 8 5
8 Qu- M171 Soil. prairie Pumanzano. Chiloé 42°28’30.52” 73°46’00.60” South (X) 17 13
9 Qu- M173a Soil. piedmont Villa Sta. Lucía 43°27’12.42” 72°21’05.44” South (X) 4 1
10 Qu- M180 Soil. native forest Lago Yelcho. Pto. Ramírez
43°16’04.81” 72°23’22.53” South (X) _ 1
11 Qu- M202 Soil. organic crop Osorno. Cerro Puschel 40°33’59.96” 73°09’15.46” South (X) 2 1
12 Qu- M203 Soil. prairie Osorno. Cerro Puschel 40°33’59.96” 73°09’15.46” South (X) 4 1
13 Qu- M205 Soil. prairie Precordillera de la costa. Osorno
40°32’52.34” 73°37’40.03” South (X) 6 3
14 Qu- M213 Soil. river Forrahue - - South (X) 16 14
15 Qu- M221b Soil. native forest Bahía Mansa 40°36’28.64” 73°44’20.33” South (X) 2 11
16 Qu- M247 Soil Cañete 37°52’19.09” 73°25’47.25” Central (VIII) 8 5
17 Qu- M253 Phytoloema hemanii larvae
Osorno. Entre Lagos 40°41’23.41” 72°36’07.90” South (X) 8 5
18 Qu- M270 Hylamorpha elegans larvae
Osorno 40°33’59.96” 73°09’15.46” South (X) 19 13
19 Qu- M271 Curculionidae larvae Paso Alejo. Coihueco 36°33’59.67” 71°41’ 51.95” Central (VIII) 1 1
20 Qu- M283 Soil. prairie Pacific Flower. Puyehue 40°39’03.37” 72°19’05.86” South (X) 1 1
21 Qu- M326 Soil San Vicente. Melipilla 33°41’33.86” 71°12’40.37” Central (RM) 9 5
22 Qu- M354 Soil Quidico. Cañete 37°50’58.65” 73°27’11.51” Central (VIII) 11 5
23 Qu- M363 Sericoides viridis Pinto 36°42’04.03” 71°53’16.45” Central (VIII) 21 12
24 Qu- M371 Soil Chanco 36°15’43.24” 72°42’44.94” Central (VII) 12 5
25 Qu- M430 Soil Osorno 40°33’59.96” 73°09’15.46” South (X) 10 5
26 Qu- M436 Soil Huape 36°37’48.66” 72°19’26.62” Central (VIII) 10 5
27 Qu- M481 Soil Monte Patria 30°41’31.56” 70°57’23.31” Central (IV) 10 6
28 Qu- M489a Otiorhynchus
salcatus larvae
Río Tea. San Pablo. Osorno
40°24’47.53” 73°00’38.63” South (X) 9 5
29 Qu- M490 Forticola auricularia La Fama 38°41’15.39” 72°13’32.29” South (IX) 3 2
30 Qu- M501 Organic berry fruit Bulnes 36°39’29.77” 72°19’00.72” Central (VIII) 10 5
31 Qu- M549 Sericoedes larvae Agrícola Santa Fe. Los Angeles
37°27’48.50” 72°21’38.03” Central (VIII) 18 13
32 Qu- M551 Pellinida Puerto Octay 40°58’46.86” 72°53’23.06” South (X) 5 1
33 Qu- M553 Soil Puerto Varas 41°23’03.25” 72°51’54.10” South (X) 10 5
34 Qu- M558 Soil Purranque 40°54’34.80” 73°09’59.74” South (X) 3 8
35 Qu- M559 Soil Chipin. Río Negro 40°47’39.79” 73°13’41.21” South (X) 20 15
36 Qu- M594 Organic berry fruit Santa Rosa 36°34’34.60” 72°07’22.42” Central (VIII) 14 7
37 Qu- M608 Soil Paso Argentina 38°36’42.11” 70°59’34.36” South (IX) 8 7
38 Qu- M633 Soil La loma - - South (IX) 22 10
bromide and visualized with UV light using a Cole Palmer FLUO-LINK FLX apparatus and photographed for later evaluation.
A pre-screening of eightM. anisopliaeisolates with 64 primers from the OPA-A, OPA-B, OPA-M, OPA-C, OPA-AD and OPA-AB series (Operon Technologies, Cali-fornia, USA) was performed to select the most informative primers. For the final evaluation of the 39 isolates we se-lected 20 primers (OPA-03, 04, 08, 09, 10, 11, 12, to 13; OPC-01; OPD-02, 03, 07, 08, 13, 17 and18; and OPAB-03, 04, 09 and 11).
SSR analysis
The same 39 isolates were analyzed with 12 SSR primers (Ma097,099,142,145,164,165,195,210,307,
325,327and375) (Enkerliet al., 2005). The PCR reactions were performed in a PTC-220 thermocycler using 10 g of genomic DNA from each isolate, 1x PCR buffer, 0.2mM of dNTPs, 2.5 mM MgCl2, 200mM of forward and reverse primers, and 0.5 UTaqDNA polymerase (Invitrogen). Am-plification started with an initial step of 4 min at 95 °C, fol-lowed by 38 cycles of 1 min at 95 °C, 1 min at 50 °C (44 ° or 56 °C depending on the primer set) and 1 min at 72 °C, with a final 4 min extension at 72 °C. Products were separated on 6% denaturing polyacrylamide gel in 1 x TBE buffer at 1800 V for about 2 h. The DNA fragments were stained with silver nitrate and the fragment sizes determined based on internal and external size standards. The Ma307 and
Ma325primers did not amplify.
ITS analysis
Oligonucleotide primers ITS1, ITS2, ITS3, ITS4 and ITS5 were used for ITS PCR-amplification (Whiteet al., 1990). The PCR reactions were carried out in a PTC-220 thermocycler using a total volume of 25 mL containing 0.2mM of dNTPs, 0.2mM of the ITS forward and reverse primers, 1xPCR amplification buffer, 0.25 mM of MgCl2, 1 UTaqDNA Polymerase (Invitrogen) and 25 g of DNA template and an initial amplification step of 3 min at 94 °C, followed by 35 cycles of 30 s at 94 °C, 40 s at 57 °C, and 20 min at 72 °C. Restriction of the PCR products was car-ried out according to the manufacturer’s instructions using the following endonucleases:AccI,AluI,DdeI,EcoRI,
EcoRV,HaeIII,HhaI,HinfIII,HpaII,MboI,MseI,Msp
I,NdeII,Rsa I,SinI,Tru9I andXhoI. Restriction frag-ments were separated on 6% polyacrylamide gel (20x20) in 1x TBE buffer at 100 V for 2 h. Ethidium bromide gel stain-ing was performed and the DNA fragments visualized un-der UV light, the molecular weights of the fragments being determined by comparison with a 100 bp DNA ladder using the 1D Image Analysis program (Kodak digital system).
Data analysis
For each marker, polymorphic bands were considered as binary characters and scored as present (1) or absent (0).
Genetic similarity between pairs was estimated using Jaccard’s coefficient with the SIMQUAL option. The simi-larity matrix was run on sequential, agglomerative, hierar-chical and nested clustering (SAHN) (Sneath and Sokal, 1973) using the unweighted pair-group method with arith-metic average (UPGMA) clustering algorithm to generate a dendrogram. The COPH option was used to generate a ma-trix of cophenetic values which was used in the MXCMOP option to calculate the correlation between the cophenetic matrix and the original SIMQUAL matrix. This analysis measured goodness-of-fit under 1000 permutations and provided a cophenetic correlation value (r). A cophenetic correlation value of r 0.9 is considered a very good fit ac-cording to Mantel (1967). All computations were under-taken using the NTSYSpc 2.1 program (Rohlf, 2000).
For SSR analysis, based on the allelic profile, the PowerMarker program (Liu and Muse, 2005) was used to calculate the number of alleles per locus, gene diversity (He) and the polymorphic information content (PIC). For ITS analysis, genotypes were determined by using gel frag-ment patterns of different primer-restriction enzyme com-binations. Finally, the specific genotypes for strain identifi-cation were analyzed.
Analysis of molecular variance (AMOVA) and fixa-tion index(Fst,q)(Weir and Cockerham 1984; Weir 1996; Excoffieret al., 2005) was calculated to clarify molecular patterns of within-population variation for the 39 isolates, collected in two main geographical areas (central and southern Chile, Table 1). All calculations were performed using Arlequin 3.01 software (Excoffieret al., 2005). The total variance was partitioned into genetic variance be-tween/among geographical areas and among isolates within geographical areas.
Results and Discussion
RAPD analysis
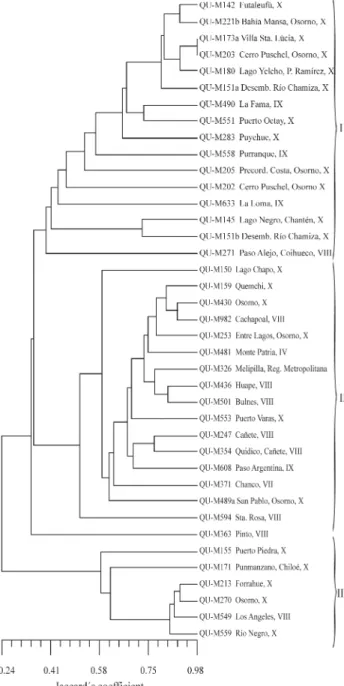
The similarity data dendrogram clustered the 39 iso-lates into three main clades with a general average similar-ity coefficient of 41.3%. Clades I and III clustered the isolates mostly collected in the southern X region, while clade II clustered isolates collected in a wider area. The dendrogram was statistically supported by a high cophe-netic correlation value (r = 0.96).
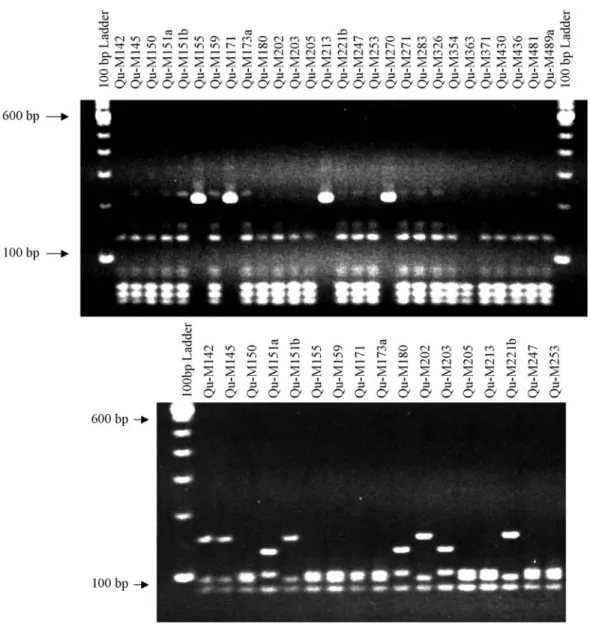
Our results showed that the PCR-RAPD analysis was useful in detecting genetic variability within and between groups of isolates collected from different geographical ar-eas. No identical genotypes were detected by these analysis (Figure 1).
The AMOVA results (Table 2) indicated that the within population variance accounted for 89.8% of the total genetic variation while the between population variance ac-counted for the remaining 10.2% of the variation. However, RAPD analysis did not detect any association between the genetic diversity of the isolates and the location from which the isolates were collected. The fixation index of 0.1025 suggested that little genetic differentiation had occurred be-tween central and southern populations based on geograph-ical distribution (Table 1 and 2).
SSR analysis
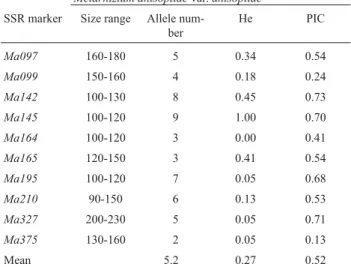
Analysis of the same 39 ChileanM. anisopliae iso-lates using microsatellites markers also indicated a high level of diversity in this entomopathogenic fungi. Only a couple of primers amplified the QuM-180 isolate so this isolate was not included in the analysis of the SSR data, which means that the number of isolated analyzed was 38. Of the 12 SSR primers used only ten amplified with our iso-lates and since 52 alleles were detected the mean number of alleles per locus was 5.2, with a range of from 2 to 9 (Table 3). These values are higher than those obtained by Enkerli
et al.(2005) in populations of M. anisopliaecollected in Switzerland. In our study, theMa375locus was the most frequent allele found in every isolate (Table 3).
The gene diversity (He) value estimates the probabil-ity that two alleles at any randomly chosen locus are differ-ent from each other, in our case the 39 isolates showed a mean He value of 0.27. The polymorphic information con-tent (PIC) is a measure of the probability that two randomly sampled genotypes have different allelic profiles, the mean PIC value for our isolates being 0.52 (Table 3). This infor-mation indicates that our ChileanM. anisopliaeisolates had a high degree of biodiversity. We detected 10 distinctM. anisopliaegenotypes in populations from the Chilean cen-tral zone, of which only isolates Qu-M501, QuM-481 and QuM-436 were identical (Table 1). In populations from the Chilean southern zone we detected 16 distinct genotypes, six of which we detected in several isolates. However, in both geographical areas the number of identical genotypes were low but more diversity might have been detected if more isolates had been investigated, remembering that 38 isolates represented only about 10% of theM. anisopliae
isolates in the INIA collection.
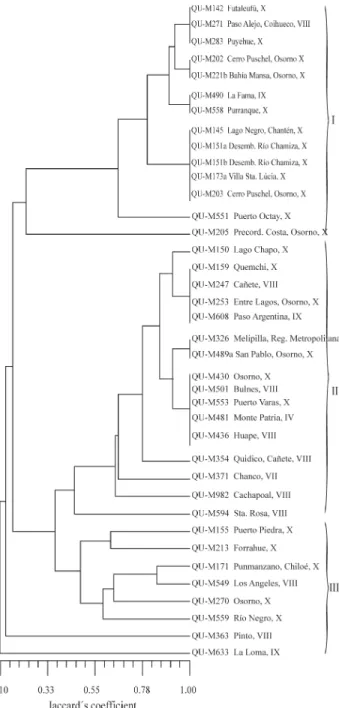
Jacard’s genetic similarity coefficient gave an aver-age similarity value of 45.2%, and separated the Chilean isolates into three major clades (Figure 2). Clades I and III clustered the isolates mostly collected in region X of the southern zone, while Clade II included isolates collected from different regions. It is important to note that both the RAPD and SSR data generated dendrograms with three well-defined clades that clustered almost the same isolates in each clade, although they had different pair-wise similar-ity coefficients. The dendrogram generated with the SSR
data was supported statistically by a high cophenetic corre-lation value (r = 0.97).
The AMOVA results for the SSR data (Table 2) indi-cated that the within population variance accounted for 81.5% of the total genetic variation while the between
pop-ulation variance accounted for the remaining 18.5% of the variation. This was also reflected by the wide distribution of the isolates in the dendrogram. This low differentiation could be due to the presence of a large number of common alleles, either because the alleles co-evolved independently by mutation or they were identical by descent and distrib-uted through gene flow as has been reported for B. brogniartti (Enkerli et al., 2001). However, this mecha-nism is still unclear inM. anisopliae(Enkerliet al., 2005).
The RAPD and SSR analysis indicated that isolates Qu-M173a and Qu-M203 (both collected in the region X of the southern zone) were almost identical genetically. How-ever, compared to RAPD analysis, SSR analysis showed a higher number of isolates to be genetically identical, proba-bly due to the low average number of different alleles in the population studied. The SSR analysis did not detect any as-sociation between the genetic diversity of the isolates and the location from which the isolates were collected. The fixation index (Fst = 0.1847) showed that little genetic dif-ferentiation had occurred between the Central and Southern populations (Table 2).
Approximately 80% of the isolates were collected from soil samples and about 20% from larval and adult in-sects. Clade I contained isolate Qu-M490 collected from an adultForticola auricularia(L.) and isolate Qu-M271 from a curculionid larva. Clade II clustered three insect-derived
Table 2- Analysis of molecular variance (AMOVA) results and fixation index (FSTq) of the random amplified polymorphic DNA (RAPD), simple
se-quence repeat (SSR), internal transcribed spacer (ITS) and combined (RAPD-SSR-ITS) data for Chilean isolates (n = 39. degrees of freedom (df) = n-1) ofM. anisopliaevar.anisopliae.
Source of variation df Sum of squares Variance components Percentage variation
RAPD
Among populations 1 66.758 2.6313 Va 10.25
Within populations 37 852.370 23.0370 Vb 89.75
Total 38 919.128 25.6684
Fixation index FST 0.1025
SSR
Among populations 1 27.560 1.3105 Va 18.47
Within populations 37 214.056 5.7853 Vb 81.53
Total 38 241.615 7.0958
Fixation index FST 0.1847
ITS
Among populations 1 16.643 0.6590 Va 10.38
Within populations 37 210.639 5.6929 Vb 89.62
Total 38 227.282 6.3519
Fixation index FST 0.1038
Combined data
Among populations 1 110.961 4.6009 Va 11.76
Within populations 37 1277.065 34.5153 Vb 88.29
Total 38 1388.026 39.1162
Fixation index FST 0.1176
Table 3- Allele size range. allele number. genetic diversity (He) and polymorphic information content (PIC) of some simple sequence repeat (SSR) microsatellite markers detected in Chilean isolates ofMetarhizium anisopliaevar.anisopliae.
Metarhizium anisopliaevar.anisopliae
SSR marker Size range Allele num-ber
He PIC
Ma097 160-180 5 0.34 0.54
Ma099 150-160 4 0.18 0.24
Ma142 100-130 8 0.45 0.73
Ma145 100-120 9 1.00 0.70
Ma164 100-120 3 0.00 0.41
Ma165 120-150 3 0.41 0.54
Ma195 100-120 7 0.05 0.68
Ma210 90-150 6 0.13 0.53
Ma327 200-230 5 0.05 0.71
Ma375 130-160 2 0.05 0.13
isolates, Qu-M982 from an adultDichroplus maculipennis
(Bl.), Qu-M253 from aPhytoloemahermanni (Herm) larva and Qu-M489a from aOtiorhynchus sulcatus (Boh.) larva. Clade III contained three insect-derived isolates, Qu-M270 from aHylamorpha elegans(Burm.) larva, Qu-M363 from an adultSericoides viridisand Qu-M549 from aSericoides
sp. This agrees with a previous PCR-RFLP study ofB. bassianathat concluded that there is a weak association be-tween isolate genotype and insect preference (Coateset al., 2002a), while studies onMetarhizumhave shown a weak associationbetween insect host range and isolate genotype (Cobb and Clarkson, 1993; Bidochkaet al., 1994).
ITS analysis
Both ITS regions resulted in a single PCR-ampli-fication product for all isolates, while digestion of the ITS1 and ITS2 PCR-amplification products with several restric-tion enzymes detected several molecular differences be-tween ourM. anisopliaeisolates (Figure 3). The restriction enzymesAccI,DdeI,EcoRI,EcoRV,NdeII,SinI, andXho
I used in this study were not able to detect restriction sites. Digestion of ITS1 yielded the following fragments (in bp):HhaI, 170 to 90;HinfIII, 260 to 50;MspI, 180 to 100;
AluI, 300 to 230;HaeIII, 300 to 180;RsaI, 290 to 220; and
Tru9I = 220 to 30 (Figure 3a). Digestion of ITS2 yielded the following fragments (in bp):HinfIII, 270 to 40;MspI, 290 to 100;Tru9I, 390 to 150;AluI, 410 to 400;HaeIII, 230 to 150; andHhaI, 180 to 70 (Figure 3b).
A total of 12 genotypes were identified by digesting the ITS1 PCR products withHhaI,HinfIII,MspI,Tru9I,
AluI,HaeIII andRsaI while nine genotypes were identi-fied by digesting the ITS2 PCR products withHhaI,Hinf
III,MspI,Tru9I,AluI andHaeIII. The higher number of restriction sites within ITS1 has been reported in other spe-cies (Kuninagaet al., 1997; Zareet al., 1999). Considering both regions together a total of 15 genotypes were identi-fied in the 39 isolates, which were thus reduced to 15 differ-ent groups (Figure 4, Table 1). This indicates that genetic discrimination between isolates using ITS was more diffi-cult than with RAPD or SSR. This is corroborated by a lower pair-wise similarity coefficient, which averaged 70.9% compared to those obtained by RAPD and SSR, but even so the dendrogram in Figure 4 shows four clades, with a high percentage of identical isolates within clades I, II and IV. For example, clade I contained ten isolates ( 25% of the total isolates) with the same genotype, mostly collected from region X of the southern zone, while clade II con-tained 12 isolates with identical genotypes (Figure 4). For the ITS data, the cophenetic correlation coefficient between the cophenetic matrix and the ITS1-ITS2 data matrix was 0.98, higher than for the RAPD and SSR data.
When the data was analyzed by geographical origin the central zone isolates showed six distinct genotypes while the southern zone isolates contained 13 distinct geno-types, only three of which represented multiple isolates (Table 1).With the ITS markers, as with the RAPD and SSR markers, we were, in general, unable to find any association between isolate diversity and collected location, the excep-tions being the ITS Clade I isolates M202 and QU-M203 collected in the X region of the southern zone (Table 1). The differences in the ITS regions detected by PCR-RFLP resulted in a fixation index (Fst = 0.1038) which indicated a low level of genetic differentiation in our
M. anisopliae sample. Moreover, AMOVA showed that 89.6% of the within isolate molecular variance was and 10.4% of the total variation occurred between central and southern populations, suggesting a weak geographic origin influence on the genotype of the isolates studied.
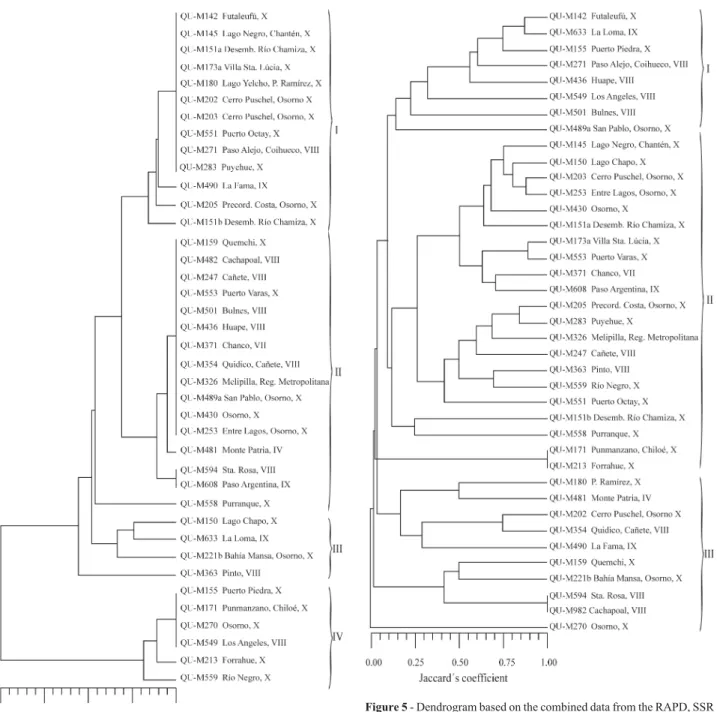
The dendrogram generated with the combined RAPD, SSR and ITS similarity data clustered the 39 iso-lates into three main clades with a general average similar-ity coefficient of 25.1% (Figure 5). Clades I, II and III clustered the isolates from all regions. The dendrogram was supported statistically by a high cophenetic correlation va-lue (r = 0.91). Results from AMOVA (Table 2) indicated that the within population variation accounted for the 88.2% of the total genetic variation and between population accounted for the remaining 11.8%. As was the case when the RAPD, SSR and ITS data was analyzed separately, the fixation index (Fst = 0.1176) suggested that there was little genetic differentiation between geographic areas (Table 2).
Genotype identification
When implementing biological control using ento-mopathogenic fungi it is very important to have an efficient
system of identifying the fungal isolates used (Coateset al., 2002b) in order to measure their efficiency and detect mul-tiple-isolate infections in the host.
In this study we found that PCR-RAPD detected a higher level of genetic diversity and was able to distinguish different entomopathogenic fungi isolates using at least four primers, but in some cases it was possible to finger-print an isolate with only one primer. For instance, OPA-03 discriminated QU-M633 from other isolates very clearly. These results agree with previously published work in which PCR-RAPD markers were able to find a large amount of genetic variability between isolates of
Entomophaga gryllipathotypes (Bidochkaet al., 1995). Allelic profiling with ten SSR markers detected 22 genotypes among the 38 isolates, isolate QuM-180 was not included in the analysis because only a few primers ampli-fied with this isolate. The following isolates showed
cal genotypes as regards the ten SSRs analyzed: Qu-M142, M271 and M283; M202 and M221b; Qu-M490 and Qu-M558; Qu-M145, Qu-M151a, Qu-M151b, Qu-M173a and Qu-M203; Qu-M159, Qu-M247, Qu-M253 and Qu-M608; Qu-M326 and Qu-M489a; and Qu-M430, Qu-M501, Qu-M553, Qu-M481 and Qu-M436. Since these loci displayed less polymorphism more SSR primers may be required to discriminate between all the genotypes. One of the reasons for this could be that the number of alleles per locus detected in the ChileanM. anisopliaeisolates were not enough to have a good discrimination among isolates.
In this case, a good PCR-RAPD protocol could allow us to discriminate among individuals.
The conservative nature of our ITS fingerprinting analysis meant that it was very difficult to discriminate be-tween isolates because many of the isolates analyzed shared the same genotype. However, it is interesting to note that isolate QU-M633 was discriminated with RAPD, SSR and ITS markers.
Our results indicate that RAPD, SSR and ITS markers could be used in a complementary manner to identify spe-cific isolates, although SSR markers have the advantage of being more reliable and easier to score than RAPD markers and therefore easier to use. However, because the
cross-Figure 5- Dendrogram based on the combined data from the RAPD, SSR and ITS-RFLP analysis of 39 Chilean isolates ofMetarhizium anisopliae var.anisopliae.
species transferability of SSR markers is limited (Enkerliet al., 2001) methods such as RAPD, PCR-RFLP or group I intron analysis of 28S rDNA may be advantageous over SSR markers for studies of distantly related isolates at the genus level.
Acknowledgments
The authors thank the Chilean Science and Technol-ogy Fund (FONDECYT) for supporting this research (pro-ject N° 1030037) and Macarena Gerding and Cecilia Santelices for their assistance with the entomopathogenic fungi cultures.
References
Alves SB (1998) Fungus entomopatogênicos. In: Batista S (ed) Controle Microbiano de Insectos. 2a edição revisada e atua-lizada, v. 4. Biblioteca de Ciências Agrárias Luis de Quei-roz, Piracicaba, pp 305-312.
Bidochka MJ, Walsh SRA, Ramos ME, St Leger RJ, Silver JC and Roberts DW (1995) Pathotypes in theEntomophaga grylli
species complex of grasshopper pathogens differentiated with random amplification of polymorphic DNA and cloned DNA probes. Appl Environ Microbiol 61:556-560. Bidochka MJ, McDonald MA, St Leger RJ and Roberts DW
(1994) Differentiation of species and strains of entomo-pathogenic fungi by random amplification of polymorphic DNA (RAPD). Curr Genet 25:107-113.
Bridge PD, Prior C, Sagbohan J, Lomer CJ, Carey M and Buddie A (1997) Molecular characterization of isolates of
Metharizium from locusts and grasshoppers. Biodiv Con-serv 6:177-189.
Buscot F, Wipf D, Di Battista C, Munch JC, Botton B and Martin F (1996) DNA polymorphism in morels: PCR/RFLP analy-sis of the ribosomal DNA spacers and microsattelite-primed-PCR. Mycol Res 100:63-71.
Coates B, Hellmich R and Lewis L (2002a)Beauveria bassiana
haplotype determination based on nuclear rDNA internal transcribed spacer PCR-RFLP. Mycol Res 106:40-50. Coates B, Hellmich R and Lewis L (2002b) Allelic variation of a
Beauveria bassiana (Ascomycota, Hypocreales) mini-satellite is independent of host range and geographic origin. Genome 45:125-132.
Cobb BD and Clarkson JM (1993) Detection of molecular varia-tion in the insect pathogenic fungus Metarhizium using RAPD-PCR. FEMS Microbiol Lett 112:319-324.
Couteaudier Y, Viaud M, Neuveglise C, Bridge P and Clarkson J (1998) Combination of different independent molecular markers to understand the genetic structure of Beauveria
populations. In: Bridge P and Couteaudier Y (eds) Molecu-lar Variability of Fungal Pathogens. CAB International, Wallinford, pp 95-104.
Enkerli J, Kolliker R, Keller S and Widmer F (2005) Isolation and characterization of microsatellite markers from the entomo-pathogenic fungusMetarhizium anisopliae. Mol Ecol Notes 5:384-386.
Enkerli J, Widmer F, Gessler C and Keller S (2001) Strain-specific microsatellites markers in the entomopathogenic fungusBeauveria brongniartii. Mycol Res 105:1079-1087.
Excoffier L, Laval G and Schneider S (2005) Arlequin v. 3.0: An integrated software package for population genetics data analysis. Evol Bioinformatics Online 1:47-50. http://cmpg. unibe.ch/software/arlequin3.
Fegan M, Manners JM, Maclean DJ, Irwin JAG, Samuels KDZ and Holdon DG (1993) Random amplified polymorphic markers reveal high degree of genetic diversity in the ento-mopathogenic fungus Metarhizium anisopliae var.
anisopliae. J Gen Microbiol 13:2075-2081.
France A, Gerding-González M, Gerding M y Sandoval A (2000) Patogenicidad de una colección de cepas nativas de
Metarhizium spp. y Beauveria spp. en Aegorhinus superciliosus. Asynonychus cervinus. y Otiorhynchus sulcatus. Agric Téc 60:205-215.
Freire L, Costa A, Góes L and Oliveira N (2001) DNA polymor-phism and total protein in mutants of Metarhizium anisopliaevar. anisopliae(Metsch.) Sorokin strain E9. Br J Microbiol 32:93-97.
Fungaro MHP, Vieira MLC, Pizzirani-Kleiner AA and de Azevedo JL (1996) Diversity among soil and insect isolates of Metarhizium anisopliae var anisopliae detected by RAPD. Lett Appl Microbiol 22:389-392.
Gaitan A, Valderrama A, Saldarriaga G, Velez P and Bustillo A (2002) Genetic variability ofBeauveria bassianaassociated with the coffee Berry borer (Hypothenemus hampei) and other insects. Mycol Res 11:1307-1314.
Glare T and Inwood A (1998) Morphological and genetic charac-terization ofBeauveriaspp. from New Zeland. Mycol Res 102:250-256.
Guerrero J, Carrillo R and Aguilera A (1999) Caracterización morfológica y germinación de cepas del hongo entomopa-tógenoMetarhizium anisopliaevar.anisopliae.asociado a larvas de escarabaeidos y curculionidos. AgroSur 27:98-106.
Hegedus D and Khachatourians G (1993) Identification of molec-ular variants in mitochondrial DNAs of members of the gen-era Beauveria. Verticillium, Paelomyces, Tolypocladium, andMetarhizium. Appl Environ Microbiol 59:4283-4288. Hodge KT, Sawyer AJ and Humber RA (1995) RAPD-PCR for
identification ofZoophtora radicansisolates in biological control of the potato leafhopper. J Invertebr Pathol 65:1-9. Humber R (1997) Fungi: Identification. In Lecey LA (ed) Manual
of Techniques in Insect Pathology. Academic Press Inc., San Diego, pp 156-167.
Jensen A, Thomsen L and Eilenberg J (2001) Intraspecific varia-tion and host specificity of Entomophtora muscae sensu strictoisolates revealed by random amplified polymorphic DNA. universal primed PCR. PCR-restriction fragment length polymorphism and conidial morphology. J Invertebr Pathol 78:251-259.
Khetan S (2001) Microbial Pest Control. Marcel Dekker Inc., New York, 300 pp.
Kretzner AM, Molina R and Spatafora JW (2000) Microsatellite markers for the ectomycorrhizal basidiomyceteRhizopogon vinicolor. Mol Ecol 9:1190-1191.
Kuninaga S, Natsuaki T, Takeuchi T and Yokosawa R (1997) Se-quence variation of the rDNA ITS regions within and be-tween anastomosis groups inRhizoctonia solani. Curr Genet 32:237-243.
infect-ingPhaedon cochleariaeis revealed by molecular markers. Mycol Res 104:409-414.
Leal SCM, Bertioli DJ, Butt TM and Peberdy JF (1994) Charac-terization of isolates of the entomopathogenic fungus
Metarhizium anisopliae by RAPD-PCR. Mycol Res 98:1077-1081.
Liu K and Muse SV (2005) PowerMarker: An integrated analysis environment for genetic marker analysis. Bioinformatics 21:2128-2129.
Mantel NA (1967) The detection of disease clustering and a gen-eralized regression approach. Cancer Res 27:209-220. Maurer P, Coutaeudier Y, Girard PA, Bridge PD and Riba G
(1997) Genetic diversity ofBeauveria bassianaand related-ness to host insect range. Mycol Res 101:159-164. Milner RJ, Samson PR and Bullard GK (2002) FI-1045: A profile
of a commercially useful isolate ofMetarhizium anisopliae
var.anisopliae. Biocontrol Sci Technol 12:43-58.
Neuvéglise C, Brygoo Y, Vercambre B and Riba G (1994) Com-parative analysis of molecular and biological characteristics of strains ofBeauveria brongniartiiisolated from insects. Mycol Res 98:322-328.
Neuvéglise C and Brygoo Y (1994) Identification of group-I introns in the 28s rDNA of the entomopathogenic fungus
Beauveria brogniartii. Curr Genet 27:38-45.
Piatti P, Cravanzola F, Bridge P and Ozino O (1998) Molecular characterization ofBeauveria brongniartiiisolates obtained from Melolontha melolonthain Valle d’ Aosta (Italy) by RAPD-PCR. Lett Appl Microbiol 26:317-324.
Rakotonirainy MS, Cariou ML, Brygoo Y and Riba G (1994) Phylogenetic relationships within the genus Metarhizium
based on 28S rDNA sequences and isoenzyme comparison. Mycol Res 98:225-230.
Rohlf FJ (2000) NTSYS-PC Numerical Taxonomy and Multiva-riate Analysis System, v. 2.1, Manual. Applied Biostatistics Inc, N.Y.
Shih HL, Lin CP, Liou RF and Tzean SS (1995) Complete nucleo-tide sequence ofBeauveria bassiana5.8S rRna coding gene and flanking internal transcribed spacers. DNA sequence 5:381-383.
Sneath PA and Sokal RR (1973) Numerical Taxonomy. Freeman, San Francisco, 573 pp.
Tanada Y and Kaya HK (1993) Insect Pathology. Academic Press, California, 666 pp.
Weir BS (1996) Genetic Data Analysis II: Methods for Discrete Population Genetic Data. Sinauer Associates, Sunderland, 445 pp.
Weir BS and Cockerham CC (1984) Estimating F-statistics for the analysis of population structure. Evolution 38:1358-1370. Welsh J and McClelland M (1990) Fingerprinting genomes using
PCR with arbitrary primers. Nucleic Acid Res 18:7213-7218.
White TJ, Bruns T, Lee S and Taylor J (1990) Amplification and direct sequencing of fungal ribosomal RNA genes for phylo-genetics. In: PCR Protocols: A Guide to Methods and Appli-cations. Academic Press Inc, California, pp 315-322. Williams JGK, Kubelik AR, Livak KJ, Rafalki JA and Tingy SV
(1990) DNA polymorphisms amplified by arbitrary primers are useful as genetic markers. Nucleic Acid Res 18:6531-6535.
Zare R, Kouvelis V, Typas M and Bridge P (1999) Presence of a 20 bp insertion/deletion in the ITS 1 region ofVerticillium lecanii. Lett Appl Microbiol 28:259-262.
Zurek L and Keddie BA (2000)Beauveria bassiana(Balsamo) Vuillemin-a promising microbial control agent of the satin moth (Lepidoptera,Lymantriidae). Biocontrol Sci Technol 10:641-644.