79 7979 7979 Mem Inst Oswaldo Cruz, Rio de Janeiro, Vol. 101(Suppl. I): 79-85, 2006
An analysis of the impact of the Schistosomiasis Control
Programme in Brazil
Ronaldo Santos do Amaral/
+, Pedro Luiz Tauil*, David Duart Lima*, Dirk Engels**
Ministério da Saúde, Coordenação de Doenças Transmitidas por Vetores/Esquistossomose, Esplanada dos Ministérios, Bloco G, 70058-900 Brasília, DF, Brasil *Universidade de Brasília, Brasília, DF, Brasil **World Health Organization, Geneva, Switzerland
The impact of the Schistosomiasis Control Programme (PCE) in Brazil was analyzed, covering the period 1976 to 2003, using the following indicators: percentage of Schistosoma mansoni carriers detected among the popula-tion examined in the coproscopic surveys (PPS): mortality rate for schistosomiasis, per 100,000 inhabitants (TME): hospitalization rate for schistosomiasis, per 100,000 inhabitants (TIE): average age of deaths caused by schistoso-miasis (IMOE). There was a 38.5% reduction in the PPS after the introduction of the PCE, attributed to the treatment of carriers. Even in hyper-endemic municipalities, such as Conde and Cuitegí, in the state of Paraíba, the PPS fell more than 50% after the first year of treatment. The parasitic burden of the carriers also decreased in the two municipalities. The TME was reduced by 63.4% and the TIE by 77.3%. The mortality rate was highest among the 50-and-above age group. The country´s IMOE rose 32.3%. The IMOE was seen to be much lower in the state of Minas Gerais, where the PCE was only initiated in 1983, with very limited coverage.
Key words: schistosomiasis - morbidity - mortality - epidemiology - control
Schistosomiasis was first described in Egypt in 1851 by Theodor Bilharz and since then, it has remained one of the most widely studied and most fought parasitic dis-eases in the world, among others (Sandbach 1975, Liese 1986).
Currently, six species of the Schistosoma kind are known to cause schistosomiasis in man. Out of these, only the S. mansoni exists on the American continent.
In spite of the wide knowledge about the disease and all the experience accumulated about its control, only a few endemic countries, with focal distribution, have been able to eliminate schistosomiasis transmission (OMS 2005). In fact, the task of controlling this parasite is one of the biggest public health challenges facing the world.
In Brazil, the disease was first detected by Pirajá da Silva in 1907 in the state of Bahia, and today it is still considered a huge public health problem due to the great extent of the transmission area, the huge number of carri-ers and for the significant number of severe cases and deaths it causes every year.
Soon after the results of the first nationwide copros-copic survey were released (1947-1952), much research was carried out and several attempts were made to control the disease (DNERu 1960). However, it was only with the advent of safer, more easily administered and more effec-tive schistosomicides that it was possible to implement
the nationwide programme to fight the disease and its transmission. In 1975, the Schistosomiasis Control Pro-gramme - PECE was set up by the Ministry of Health (Machado 1982).
Although there has not been any new control mea-sure for the disease, epidemiological changes, and, espe-cially, reforms in the organization of health services have caused several methodological and management modifi-cations in efforts to control the disease. In 1980, the PECE was no longer considered to be the Ministry of Health’s greatest priority and became known as the Schistosomia-sis Control Programme (PCE) with continued support from the federal government, exclusively. From 1993 on, the PCE was decentralized. Currently, it is the task of munici-palities to execute the field activities, and that of the states to co-ordinate municipal activities while the federal gov-ernment establishes the norms and provides material, tech-nical and financial support.
The aim of this study is to analyze the impact of the PCE’s activities in Brazil, from 1976 to 2003, as well as to describe the control activities undertaken and to com-ment on the difficulties encountered in trying to wipe out the disease in Brazil.
MATERIALS AND METHODS
The study is an assessment of the impact of the PCE’s control activities, using the following indicators:
a) the proportion of S. mansoni carriers detected in coproscopic surveys conducted by the programme (PPS) in endemic states and in two hyper-endemic municipali-ties, by studying the parasitic burden (Conde and Cuitegí, both in the state of Paraíba):
number of carriers PPS = ———————— × 100
number of tests
b) the mortality rate for schistosomiasis, per 100,000 inhabitants (TME):
Financial support: UNDP/World Bank/WHO Special Pro-gramme for Research and Training in Tropical Diseases +
Corresponding author: [email protected] Received 25 May 2006
8 0 8 0 8 0 8 0
8 0 Impact of Schistosomiasis Control Programme • Ronaldo Santos do Amaral et al.
number of schistosomiasis deaths
TME = ––––––––––––––––––––––––––––– × 100,000 population of area
c) the hospitalization rate for schistosomiasis, per 100,000 inhabitants (TIE):
number of hospitalizations for schistosomiasis
TIE = ––––––––––––––––––––––––– × 100,000 population of area
d) the average age of deaths caused by schistosomia-sis (IMOE), for the country as a whole and that of two states (Pernambuco and Minas Gerais), with different de-grees of exposure to control activities:
age of death IMOE = Σ ––––––––––––––
number of deaths
The PCE’s control activities included: a) copro-parasitological diagnosis of S. mansoni carriers using the Kato Katz method; b) treatment of carriers with schis-tosomicides; c) carrying out sanitary improvements; d) inspecting water bodies and treating them with molluscocides; e) health education, whose activities have never been adequately quantified.
Information on schistosomiasis control activities, as well as the percentage of carriers and the parasitic burden of S. mansoni were obtained from the PCE’s central ar-chives.
The data on mortality for schistosomiasis were ob-tained from the Mortality Information System (SIM) and that of hospital admissions from the Hospital Information System (SIH), of the Public Health System (SUS), Minis-try of Health.
The population figures used for calculating the mor-tality and morbidity indicators were obtained from the Brazilian Institute of Geography and Statistics.
RESULTS
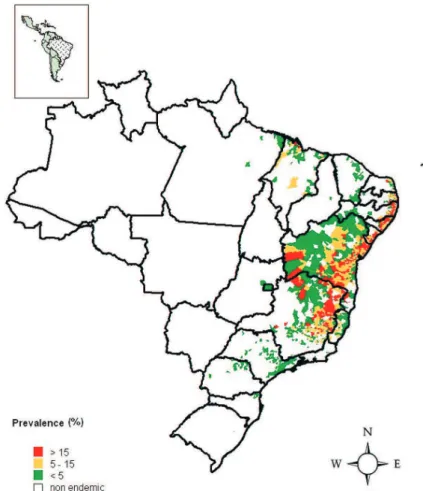
Fig. 1 shows the schistosomiasis endemic areas in Brazil, stratified according to prevalence zones by mu-nicipality, and delimited according to the coproscopic sur-veys carried out during the period under study. Currently, transmission occurs in 19 states and the Federal District. It can be noted that the disease is heterogeneous. Minas Gerais and Bahia states have the largest endemic areas. The municipalities which have the highest prevalence lev-els are spread out along the Northeastern coastal region and protrude into the hinterland of Bahia until they reach Minas Gerais in the Southeast.
As can be seen in the Table, from 1976 to 2003, in order to detect S. mansoni carriers, more than 49 million parasitological tests were carried out using the Kato-Katz method. The quadrennial grouping of these tests shows that the intensity of the search for carriers varied along the years. Within the first four years, during the time that the PECE was in effect, due to limited resources, priority was given the Northeast region, arguably the most af-fected region. Between 1976 and 1979, 2,752,173 tests were carried out. Over the next eight years, one notices a gradual rise in the number of tests, due to the increased coverage of the programme. Between 1984 and 1987, the number of coproscopic tests exceeded 8,300,000. Over the next
four-year period, 1988 to 1991, the number of tests carried out dropped to less than 6,500,000, due to the reduction and even suspension of PCE activities in some states, as re-sources were diverted to fight outbreaks of dengue fever which was spreading throughout the country. Over the next eight years, the number of tests reached their high-est levels, almost 10,000,000 every four years. This hap-pened especially because the World Bank allocated re-sources through the Northeast Disease Control Pro-gramme (PCDEN), which made it possible to expand the programme to Minas Gerais and Bahia, to areas which had previously not been dealt with. This expansion pe-riod coincides with the start of the process to municipal-ize control activities, which hindered the efficient man-agement of the PCE, even causing difficulties in the pro-cessing and flow of information. As a result of these diffi-culties, one notices a reduction in the number of parasito-logical tests carried out within the last four years.
From 1976 to 2003, 4,432,695 carriers were detected, as can be seen in the Table. Massive treatment was intensely carried out from 1976 to 1987, followed by a predominantly selective treatment of carriers. In all, between 1976 and 2003, more than 12 million cases were treated.
Table also shows the number of water bodies in-spected and treated with molluscocides, every four years, from 1976 to 2003. One can also notice that the number of inspections rose within the first four years, and had gradu-ally fallen by 2003. On the other hand, the number of wa-ter bodies treated more than doubled from the first four years (52,664) to the second four years (126,711), and, following this, one notices an irregular downward trend which drastically sharpened within the last four years of the period analyzed.
Still in Table, one can see the number of households which benefited from improved sanitation, every four years, within the period 1976 to 2003. The four-year pe-riod with the lowest number of households which ben-efited was 1980-1983, with 86,480 households. Within the 1996-1999 period, the highest number of households was reached (161,406). Within the 1976-2003 period, 906,711 households underwent sanitation improvements.
The proportion of S. mansoni carriers detected in the country, every four years, during coproscopic tests, in the 1976 to 2003 period, can be seen in the Table. One can see that the clear downward trend in percentage is halted by a high number between 1992 to 1995. Within the next four years, the downward trend is re-established. Com-paring the periods 1976 to 1979 and 2000 to 2003, one can notice a 38.5% drop in the number of carriers detected. However, the oscillation in trend for this indicator, nation-wide, can be better seen over the period 1976 to 2003, in Fig. 2.
This indicator was also investigated, using a smaller unit of analysis (municipalities), in Fig. 3, which also showed a downward trend in the number of carriers diag-nosed over the period under study. Furthermore, Figs 4 and 5 (Cuitegí and Conde municipalities in Paraíba) show that the proportion of S. mansoni carriers with high para-sitic burdens in these two municipalities also dropped.
8 1 8 18 1 8 1 8 1 Mem Inst Oswaldo Cruz, Rio de Janeiro, Vol. 101(Suppl. I), 2006
TABLE
Evolutionary summary of quadriennal schistosomiasis control measures. Brazil, 1976-2003
Quadrenniums
Measures 1976-1979 1980-1983 1984-1987 1988-1991 1992-1995 1996-1999 2000-2003
a) Diagnosis of S. mansoni carriers
Parasitological tests 2.752.173 7.351.660 8.311.192 6.462.244 9.982.670 9.805.008 6.510.477
Positive testes 301.143 657.983 650.112 444.411 1.061.144 895.952 433.950
% of carriers detected 10.9 9.0 7.8 6.9 10.6 9.1 6.7
b) Chemotherapy
Treatments 3.030.620 3.863.790 2.151.239 656.427 1.213.612 914.640 303.248
Treatment/Carrier 10,1 5,9 3,3 1,5 1,1 1,0 0,7
c) Sanitary improvements (SI)
Homes which received SI 146.486 86.480 109.733 129.531 126.724 161.351 146.406
c) Control of intermediate hosts
Water bodies inspected for snails 218.915 566.775 621.032 268.419 162.032 111.069 7.696 Water bodies treated with molluscocide 52.664 126.711 81.422 21.149 24.034 43.034 311
Source: PCE/SVS/MS; DENSP/Funasa/MS.
Fig. 1: schistosomiasis distribution, according to level of prevalence, by municipality. Brazil.
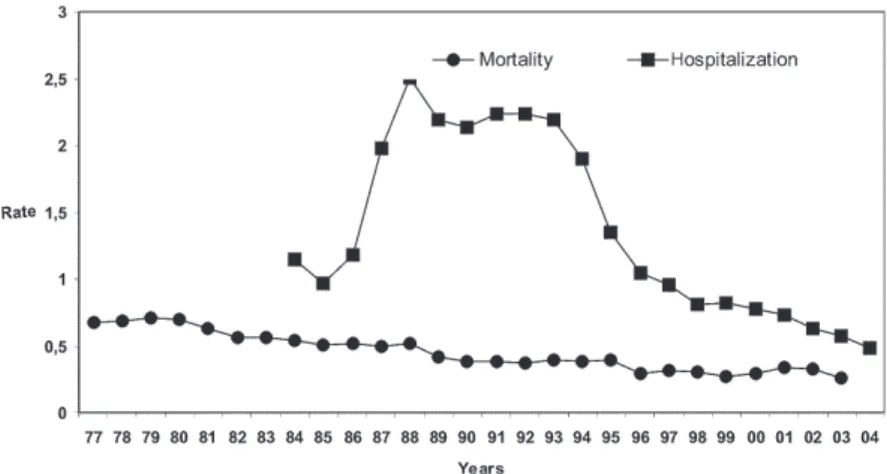
the country as a whole, available from 1977 to 2003, and of hospitalizations, from 1984 to 2003, for schistosomiasis, yearly per 100,000 inhabitants. It can be seen that, within the first few years of the setting up of the Information System (SIH and SIM), there were increases in the two indicators and then, with little oscillation, they decreased until the last year of available data. In the case of
hospi-talization rates, the increase was greater and reached 77.3% from 1988 to 2004. During this period, there was a single period of growth from 1990 to 1993. With regard to the mortality rate, the drop, which was also consistent, reached 63.4% between 1979 and 2003, with growth no-ticeable from 1999 to 2001.
8 2 8 2 8 2 8 2
8 2 Impact of Schistosomiasis Control Programme • Ronaldo Santos do Amaral et al.
Fig. 2: percentage of Schistosoma mansoni carriers detected, per year, in coproscopic surveys. Brazil, 1976-2003.
Fig. 3: percentage of Schistosoma mansoni carriers detected in coproscopic surveys. Cuitegí and Conde municipalities, state of Paraíba, 1977-2003.
Fig. 4. proportion of Schistosoma mansoni carriers with a parasitic burden of less than 100 eggs per gram of stool. Cuitegí and Conde municipalities, state of Paraíba, 1988-2003.
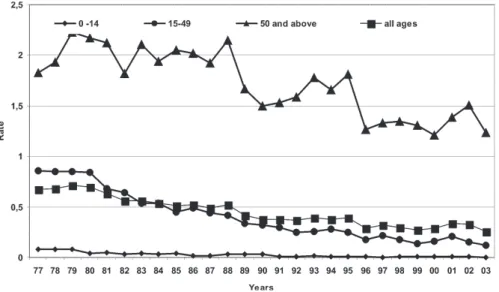
the group which presented the highest mortality rate dur-ing the whole of the 1977 to 1998 period.
Fig. 8 shows the evolution of the average age of death caused by schistosomiasis in Brazil and in the states of Minas Gerais and Pernambuco. It was noticed that the country’s IMOE increased 32.3% from 1977 to 1998.
8 3 8 38 3 8 3 8 3 Mem Inst Oswaldo Cruz, Rio de Janeiro, Vol. 101(Suppl. I), 2006
DISCUSSION
The percentage of S. mansoni carriers detected in coproscospic surveys, based upon the country’s general data, reduced sharply following the introduction of con-trol measures. This sharp reduction indicates that there was a quick and specific measure in place. Chemotherapy clearly seems to be the control measure characterized by greater speed and specificity against S. mansoni. In this case, the quick drop in the number of carriers was seen after the first cycle of massive treatment (of people who tested positive or not for S. mansoni). However, this re-sponse does not seem to be exclusive to this mode of treatment, having been observed also in other studies after selective treatment of carriers (Lima e Costa et al. 1996).
After the sharp drop in the percentage of carriers (from 1977 to 1979) the trend continued to be less intense over the next 10 years, and was interrupted by a rise (from 1990 to 1993), coinciding with the expansion of the programme´s coverage to endemic areas, previously not tackled, in Minas Gerais and Bahia. From 1994 onwards, the down-ward trend was re-established.
In the Conde and Cuitegí municipalities, where initial prevalence was very high, the drop in PPS was immediate, followed by stabilization at distinct levels, with little os-cillations in different years. At the same time, a drop in the parasitic burden was noticed, measured by counting the number of eggs per gram of stool. The distinct stabilised prevalence levels are related to the different degrees of endemicity and exposure of the population, given that the control measures used in the two municipalities were similar.
One has to emphasize that this indicator has impor-tant limitations because of the artificial variations it can present upon analyzing the programme’s data, whether nationwide or, to a lesser degree, at municipal level. The PPS is calculated from the coproscopic surveys carried out with the aim of diagnosing and treating carriers. In-vestigating the prevalence of the disease is not the aim. Due to the frequent problems encountered in public ad-ministration, the programme has undergone several changes, firstly with regard to the scale of priorities which turned it into a mere routine programme in 1980. The in-consistency in the flow of resources either
geographi-Fig. 5. proportion of Schistosoma mansoni carriers with a parasitic burden of more than 100 eggs per gram of stool. Cuitegí and Conde municipalities, state of Paraíba, 1998-2003.
8 4 8 4 8 4 8 4
8 4 Impact of Schistosomiasis Control Programme • Ronaldo Santos do Amaral et al.
Fig. 7: mortality rate for schistosomiasis, per 100,000 inhabitants, by age groups. Brazil, 1977-2003.
Fig. 8. schistosomiasis average deaths age in Brazil-BR and the states of Minas Gerais-MG and Pernambuco-PE, 1977-1998.
cally restricted or expanded coverage of the population investigated, among other changes. All this has produced artificial oscillations in the indicator.
On the other hand, the reduction in the PPS, as much as was achieved, was due to the successive cycles of chemotherapy. These results clearly point to the need to increase coverage and intensify all measures to combat the disease, aimed at achieving lasting and sustainable control. This objective, however, requires more specific action, because, without improving the quality of life of the populations at risk, re-infection and spread of the dis-ease are inevitable. On the other hand, today, as the ex-ecution of the programme is the responsibility of the mu-nicipal administration, whose task it is to also improve the quality of life of its population, in theory, one can discern
that controlling schistosomiasis is foreseeable in the short term. In practice, however, what one has observed is a rising number of administrative problems resulting from a proliferation of managers, based upon the reality of each municipality.
It is obvious that the importance attached to schisto-somiasis is due to the gravity of some cases and the deaths it causes. For this reason, reducing the gravity and mor-tality has become the number one objective to be achieved by the control programmes (Silveira et al. 1990).
8 5 8 58 5 8 5 8 5 Mem Inst Oswaldo Cruz, Rio de Janeiro, Vol. 101(Suppl. I), 2006
Among these, overestimation is an important possibility, since an individual, in view of the chronic evolution of schistosomiasis, can be hospitalized more than once a year. On the other hand, underestimating the TIE is also possible, since serious schistosomiasis cases can lead to hospital admission with other diagnoses, due to the vari-ety of clinical manifestations of the disease. In any case, in the long term, the noted reduction in the TIE reflects the frequency of hospital admissions for schistosomia-sis. The downward trend of this indicator for the country as a whole coincides with the observations of other stud-ies, concerning the northeastern states (Carmo 1999, Rezende et al. 2005).
With regard to the analysis of deaths from schistoso-miasis, it has to be said that calculating the mortality rate also has limitations. In this case, because of the possibil-ity of underestimating the indicator, due, especially, to factors related to death notification services. It also has to be mentioned that, the growth curve in the mortality and hospitalization rates seen in the first few years of introduction of the SIM and SIH has been attributed to the gradual inclusion of new notification units, and not to the disease’s trend (Silveira et al. 1990, Carmo 1999). In this paper, it was noticed that there was a continuity in the downward trend of mortality for schistosomiasis in the country already indicated in the paper by Silveira et al. (1990). These authors also pointed out, in the analysis of 7385 deaths, the rare nature of the incidence in the under-20 age group and predominance in the over 40 age group. This age group distribution of deaths from schis-tosomiasis is related to the chronic nature of the disease and was confirmed, in the analysis of the mortality rate, all along the period under study in this paper. Furthermore, it was also observed that the reduction in the mortality rate was higher in younger age groups. This explains the rise in the average age of deaths from schistosomiasis.
The reduction in the percentage of carriers, hospital-ization rate, mortality, plus the rise in the average age of death from schistosomiasis indicate that the impact of the control programme’s measures has been significant. Al-though it is difficult to prove, other factors non-inherent to the programme have surely also contributed to improve the current schistosomiasis situation. The country’s ac-celerated urbanization process, improvements in the pro-vision and quality of health services, progress in clinical and surgical treatment, in the face of serious cases, among other aspects, can be cited as examples of external factors which have contributed to improve the schistosomiasis situation in the country.
There is consensus among schistosomiasis scholars that control programmes need to be greatly improved upon. Thirty years after the introduction of the PCE, it has become obvious that, wiping out schistosomiasis from the country is a huge challenge. Several reasons which account for this difficulty have been dealt with in other papers (Coura & Amaral 2004). At this point, it is worth mentioning two as yet insurmountable technical problems. The low sensitivity of parasitological tests, especially in low prevalence areas, (Gryseels et al. 1991, Lambertucci &
Serufo 2001) and the low cure rate of medicines, of ap-proximately 70 to 80% (Lambertucci & Serufo 2001). These two factors represent serious obstacles and explain the continued existence of the schistosomiasis foci, even when subjected to integrated control measures over long periods of time. Furthermore, migratory movements of people, combined with the great spread of intermediary hosts and the poor health conditions of a large segment of the country’s population favour the propagation and continued existence of the disease.
In this context, one can conclude that it has been pos-sible to reduce the number of carriers, the gravity and the mortality rate for schistosomiasis, but prospects for wip-ing out the disease cannot be envisaged in the midterm.
REFERENCES
Carmo EH 1999. Morbidade e Mortalidade por Esquis-tossomose Mansônica na Região Nordeste do Brasil, The-sis, Instituto de Saúde Coletiva, Universidade Federal da Bahia, Salvador, 180 pp.
Coura JR, Amaral RS 2004. Epidemiological and control as-pects of schistosomiasis in Brazilian endemic areas. Mem Inst Oswaldo Cruz 99 (Suppl. I): 13-19.
DNERu - Departamento Nacional de Endemias Rurais 1962. Combate a endemias rurais no Brasil – (Relatório dos Grupos de Trabalho Reunidos em 1960 na cidade do Rio de Janeiro). Ministério da Saúde, 154 pp.
Gryseels B, Nkulikyinka L, Engels D 1991. Repeated commu-nity-based chemotherapy for the control of the Schisto-soma mansoni: effect of screening and selective treatment on prevalences and intensities of infection. Am J Trop Med Hyg 45: 509-517.
Lambertucci JR, Serufo JC 2001. Esquistossomose mansônica. In LCC Gayotto, VAF Alves (eds), Doenças do Fígado e Vias Biliares, Atheneu, São Paulo, p. 815-835.
Liese B 1986. The organization of Schistosomiasis Control Programmes. Parasitol Today 2: 339-345.
Lima e Costa MF, Guerra HL, Junior FGP, Firmo JOA, Uchoa E 1996. Avaliação do Programa de Controle da Esquis-tossomose (PCE/PCDEN) em municípios situados na Bacia do Rio São Francisco, Minas Gerais, Brasil. Rev Soc Bras Med Trop 29: 117-126.
Machado P 1982. The Brazilian Program for Schistosomiasis Control, 1975-1979. Am J Trop Med Hyg 31: 76-86.
OMS-Organización Mundial de la Salud 2005. Prevención y controle de la esquistosomiasis y las geohelmintiasis: Informe de un comité de expertos de la OMS, Serie de informes técnicos 912, Ginebra, Suiza.
Resende APC, Souza-Santos R, Barbosa AS 2005. Internação hospitalar e mortalidade por esquistossomose mansônica no Estado de Pernambuco, Brasil, 1992/2000. Cad Saúde Pública 21: 1392-1401.
Sandbach FR 1975. Preventing schistosomiasis: a critical assesment of present policy. Social Science & Medicine 9: 517-527.