i
IMPROVING THE MATCHING OF REGISTERED
UNEMPLOYED TO JOB OFFERS THROUGH
MACHINE LEARNING ALGORITHMS
Paula Isabel Moura Meireles Cruz
i
MGI
IMPROVING THE MATCHING OF REGISTERED UNEMPLOYED TO JOB
OFFERS THROUGH MACHINE LEARNING ALGORITHMS Paula Isabel Moura Meireles Cruz
MGI
2
0
1
ii
NOVA Information Management School
Instituto Superior de Estatística e Gestão de Informação
Universidade Nova de Lisboa
IMPROVING THE MATCHING OF REGISTERED UNEMPLOYED TO JOB
OFFERS THROUGH MACHINE LEARNING ALGORITHMS
by
Paula Isabel Moura Meireles Cruz
Dissertation presented as a partial requirement for obtaining the Master’s degree in Information Management
Supervisor: Professor Roberto Henriques, PhD
iii
ACKNOWLEDGEMENTS
iv
ABSTRACT
Due to the existence of a double-sided asymmetric information problem on the labour market characterized by a mutual lack of trust by employers and unemployed people, not enough job matches are facilitated by public employment services (PES), which seem to be caught in a low-end equilibrium. In order to act as a reliable third party, PES need to build a good and solid reputation among their main clients by offering better and less time consuming pre-selection services. The use of machine-learning, data-driven relevancy algorithms that calculate the viability of a specific candidate for a particular job opening is becoming increasingly popular in this field. Based on the Portuguese PES databases (CVs, vacancies, pre-selection and matching results), complemented by relevant external data published by Statistics Portugal and the European Classification of Skills/Competences, Qualifications and Occupations (ESCO), the current thesis evaluates the potential application of models such as Random Forests, Gradient Boosting, Support Vector Machines, Neural Networks Ensembles and other tree-based ensembles to the job matching activities that are carried out by the Portuguese PES, in order to understand the extent to which the latter can be improved through the adoption of automated processes. The obtained results seem promising and point to the possible use of robust algorithms such as Random Forests within the pre-selection of suitable candidates, due to their advantages at various levels, namely in terms of accuracy, capacity to handle large datasets with thousands of variables, including badly unbalanced ones, as well as extensive missing values and many-valued categorical variables.
KEYWORDS
v
TABLE OF CONTENTS
1.
INTRODUCTION ... 1
1.1.
Background and Problem Identification ... 1
1.2.
Job Matching Procedures at Job Centres ... 5
1.3.
Study Objectives ... 8
1.4.
Study Relevance and Importance ... 9
1.5.
Outline ... 10
2.
CRITICAL LITERATURE REVIEW ... 11
2.1.
Functional dimension ... 11
2.2.
Method dimension ... 12
2.3.
Other Relevant Dimensions ... 16
3.
METHODOLOGY ... 17
3.1.
Data Sources Description ... 17
3.2.
Pre-Processing, Sampling and Partitioning ... 21
3.3.
Model Building ... 25
3.4.
Brief Overview of the Underlying SAS Nodes ... 26
4.
RESULTS ... 28
4.1.
Datasets and Samples Description ... 28
4.2.
Variable Selection ... 30
4.3.
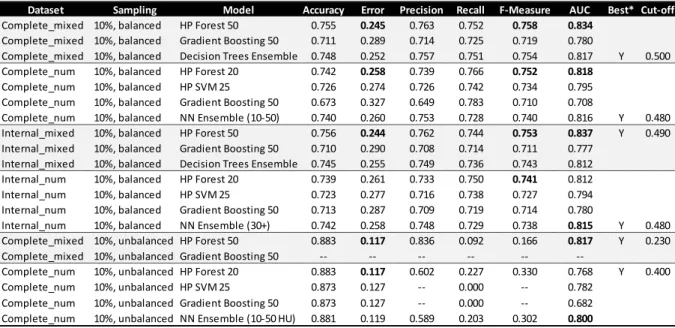
Model Comparison Results ... 36
4.4.
Model Stability Evaluation ... 39
4.5.
Separate Models Performance ... 46
4.6.
Scoring of New Data ... 50
4.7.
Discussion of Results ... 54
5.
CONCLUSIONS ... 57
6.
BIBLIOGRAPHY ... 58
vi
INDEX OF PICTURES
Picture 1.1 - Relative importance of job offers’ refusals by categories ... 7
Picture 2.1 - Example of an artificial neural network model ... 12
Picture 2.2 – Minimization of constrained linear least-squares problem ... 12
Picture 3.1 - SMOTE sampling technique ... 22
Picture 3.2 - DOB–SCV partitioning method ... 24
Picture 4.1 - Sample Node Settings ... 28
Picture 4.2 - Decisions Node Settings ... 29
Picture 4.3 – Cut-off node ... 29
Picture 4.4 - Comparison of variable selection methods ... 33
Picture 4.5 - Friedman test statistic ... 37
Picture 4.6 - ROC Curves (SMOTED dataset) ... 38
Picture 4.7 - Misclassification Rate (SMOTED dataset) ... 38
Picture 4.8 - Use of a transformation node for f-fold cross validation ... 39
Picture 4.9 - Cross validation segment id creation ... 40
Picture 4.10 - Overall and segments' misclassification rate ... 40
Picture 4.11 - Bagging vs. Boosting ... 41
Picture 4.12 - Bagging and boosting flows (unbalanced dataset) ... 41
Picture 4.13 - HP Forest default settings ... 42
Picture 4.14 - Optimal number of variables (balanced dataset at the left; unbalanced dataset at the right) ... 43
Picture 4.15 - Minimum leaf size (balanced dataset at the left; unbalanced dataset at the right) ... 44
Picture 4.16 - Stratified models' flows ... 46
Picture 4.17 - Stratified model assessment chart - Job offers and financial incentives ... 47
Picture 4.18 - Stratified Model Assessment - Risk of long term unemployment profile ... 47
Picture 4.19 - Stratified Model Assessment Chart - Job offer's occupation (level 1) ... 48
Picture 4.20 - Stratified model misclassification rate chart by NUTS 3 ... 49
Picture 4.21 - Performance measurement main metrics ... 50
Picture 4.22 - Adjusted F-Measure (AGF) ... 56
Picture 7.1 - Complete_mixed balanced dataset ROC Curves ... 62
Picture 7.2 - Complete_num balanced dataset ROC Curves ... 62
Picture 7.3 - Internal_mixed balanced dataset ROC Curves ... 62
Picture 7.4 - Internal_num balanced dataset ROC Curves ... 63
Picture 7.5 - Complete_mixed unbalanced dataset ROC Curves ... 63
Picture 7.6 - Complete_num unbalanced dataset ROC Curves ... 63
Picture 7.7 - HP Forest, Gradient Boosting and Decision Trees Ensemble (mixed balanced dataset) .. 64
Picture 7.8 - Numeric dataset supporting nodes ... 64
viii
INDEX OF TABLES
Table 1.1 - Portuguese PES main performance indicators ... 3
Table 3.1 – Raw datasets ... 18
Table 3.2 – Raw datasets (cont.) ... 19
Table 4.1 - Variable selection ... 30
Table 4.2 - Variable selection (cont.) ... 31
Table 4.3 - Variable selection (cont.) ... 32
Table 4.4 - Class variable summary statistics (before transformation and imputation) ... 34
Table 4.5 - Distribution of class target and segment variables (before transformation and imputation)34 Table 4.6 - Interval variable summary statistics (before transformation and imputation) ... 34
Table 4.7 - Distribution of class target and segment variables ... 35
Table 4.8 - Interval variable summary statistics ... 35
Table 4.9 - Main models comparison ... 36
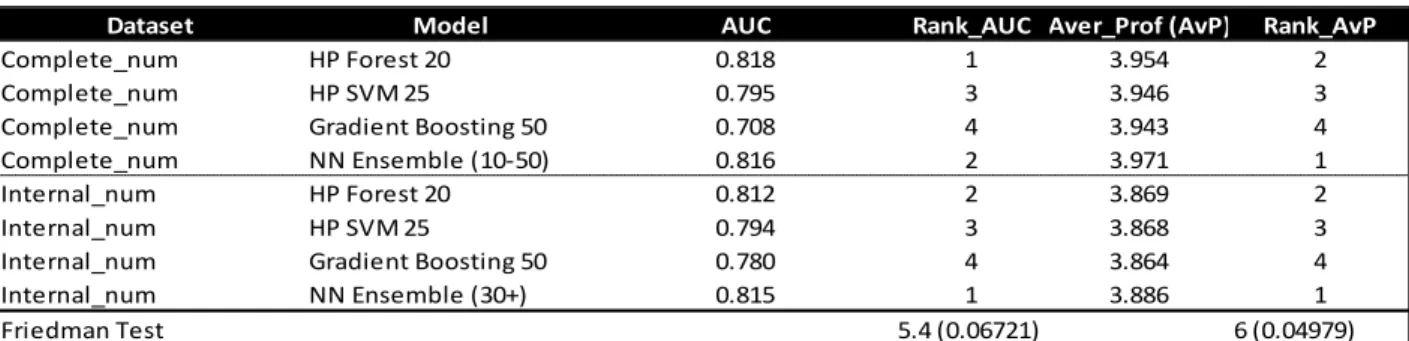
Table 4.10 - Friedman test statistic results for the numerical datasets ... 37
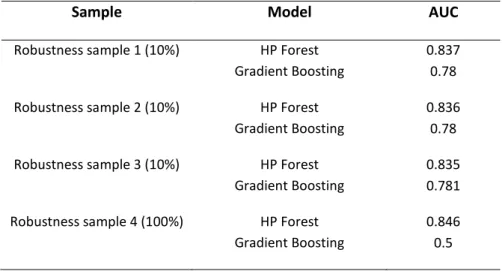
Table 4.11 - Stability of results on various samples ... 39
Table 4.12 - Bagging and boosting models' comparison ... 42
Table 4.13 - SAS macro for generating number of variables evaluation ... 44
Table 4.14 - SAS macro for generating minimum leaf size evaluation ... 45
Table 4.15 - Codification of the binary variable AP_Apoiada ... 47
Table 4.16 - Codification of the binary variable AP_Segmento... 48
Table 4.17 - Code and designation of occupations (level 1) ... 48
Table 4.18 - NUTS 3 codification ... 49
Table 4.19 - Calculation of the KS statistic (example) ... 51
Table 4.20 - Scoring of new data with the HP4Score SAS procedure ... 51
Table 4.21 - Results on validation datasets ... 52
Table 4.22 - Results on new data ... 53
1
1.
INTRODUCTION
1.1.
B
ACKGROUND ANDP
ROBLEMI
DENTIFICATIONThe belief that "finding the right job should be easier than splitting an atom" (as cited in Bort, 2014) has been consistently behind some of the most innovative approaches to the development of increasingly powerful search engines based on artificial intelligence, which ultimate goal is to efficiently match job seekers to vacancies best suited to their qualifications, skills and experience and help employers to identify and hire the most qualified candidates.
The Bright Score - "a machine-learning, data-driven relevancy algorithm that calculates the viability of a specific candidate for a particular job opening" - is one of such examples, having as one of its key components the enhancement of the limited information which is normally available in job offers and CV's descriptions through the use of social media profiles and other publicly available data (Bollinger, Street, & Francisco, 2012).
Other implementations of automated applicant ranking systems based on machine learning algorithms can be found in the research literature, ranging from neural networks (Akinyede & Daramola, 2013) and other neuro-fuzzy techniques (Drigas, Kouremenos, Vrettos, Vrettaros, & Kouremenos, 2004) to regression trees, support vector machines (Faliagka et al., 2013) and analytical hierarchy process (Tzimas, 2012).
It can be stated that all of the above mentioned approaches share the same major concerns, namely: enhancing the productivity of the human resource personnel; reducing time wastages in collecting and sorting of vacancies postings and applications from job seekers; tackling unstructured and missing data. An important difference in the design of such automated systems should be noted, however: the expected degree of human intervention in the final ranking of results and the possibility or not of using recruiting agents' decisions in the training of the system.
The Portuguese Public Employment Services (PES) comprises 5 regional offices, 30 employment and training Centres, 23 job centres and a training and vocational rehabilitation centre, alongside the central services, which provide technical, administrative and financial support to the former. With the economic crisis in 2008, it started facing not only a rise in the unemployment rates, but also a shortage in the number of human resources that would be necessary to respond in an efficient manner to the needs of their most important clients - the registered unemployed.
2 a) Profiling system:
Implementation of a profiling system (based on a logistic regression) to assess the risk of long-term unemployment in order to promote personalized interventions and to stipulate the frequency of contacts between the employment services and each type of unemployed jobseeker. According to this model, unemployed jobseekers are segmented into three categories: (1) high risk group, including intensive assistance clients; (2) moderate risk group, including clients for counselling and qualification; (3) low risk group, including market clients and clients for counselling and activation.
b) Different levels of job vacancies handling:
Level 1 – PES is responsible for advertising the job vacancies, being that PES and the employer are jointly responsible for the recruitment and selection processes (a PES officer will be present at all the job interviews)
Level 2 – PES is responsible for advertising the job vacancies and for the recruitment process, being that the employer is responsible for the selection process;
Level 3 – the employer is responsible for the recruitment and selection processes, being that PES is only responsible for online advertisement of the job opportunity.
c) Matching system:
Gradual improvement of the matching system, through the implementation, in a first phase, of the possibility of using the information recorded in open fields, as well as assigning different weights to the most relevant variables, and, in a second phase, of a fuzzy matching system avoiding the immediate exclusion of vacancies and CVs which do not completely fulfil predefined selection criteria.
d) Career manger:
Creation of the career manager role, who consists of the officer responsible for agreeing the integration pathway with each unemployed jobseeker and the respective follow-up, in order to ensure and monitor their timely integration into sustainable jobs/active employment measures.
e) Job vacancies manager:
Enhancement of the job vacancies manager role, the officer responsible for the mediation between the employers' recruitment needs and the unemployed jobseekers.
3
2009 2010 2011 2012 2013 2014 2015
Total PES expenditure (in million Euros)
810 786 707 642 884 944 931
Total PES staff 3689 3 547 3 254 3 193 3 186 3 282 3 268
Annual
unemployment rate in %
9.4 10.8 12.7 15.5 16.2 13.9 12.4
Total registered
jobseekers 751 223 706 558 739 558 801 088 798 413 755 529 759 331 Total registered
unemployed 717 588 669 449 704 633 764 670 766 966 723 406 713 719 Long term
unemployed 175 417 226 280 228 891 292 755 322 985 294 879 260 039 Number of new
vacancies reported during the year
123 078 129 123 103 109 94 059 140 228 165 762 182 449
Number of placed
job seekers 63 115 69 102 62 346 58 835 84 440 105 504 124 895
Source: IEFP, IP; INE, IP
Table 1.1 - Portuguese PES main performance indicators
However, it should be noted that around 50% of vacancies reported within the last four years are associated with financial incentives and not necessarily to an effective improvement of the matching process. In fact, the new operating model's main goals - such as facilitating and improving the interaction with the unemployed jobseekers, as well as with the employers and maximizing the opportunities for job
matching - are yet to be fully achieved, namely in what concerns the optimal resource allocation based
on the estimated risk of long term unemployment of a certain individual and the utilization of a non-linear matching system, which haven't still been adopted.
4 It should also be noted, as a general finding across Europe, that not enough job matches are facilitated by PES, due to the existence of a double-sided asymmetric information problem on the labour market1 which those services have yet to overcome as a reliable third party, contributing to an
actual reduction of search costs. In face of the lack of trust both by employers and the unemployed, PES seem to be caught in a low-end equilibrium, functioning as a last resort job brokerage service or as a source of subsidized low-wage jobs (Larsen & Vesan, 2012).
Radical solutions have been pointed to this apparently unsolvable problem (ranging from the establishing of a public monopoly on job-brokering to freeing PES from the task of helping the weakest workers), alongside more reasonable ones, from which the following are worth noting (Larsen & Vesan, 2012):
• Continuing on focusing on re-qualifying disadvantaged workers and giving employers wage subsidies for a limited period if they hire a person from a disadvantaged group;
• Providing guidance in using informal channels of recruitment and enhancing the use of online-services on an autonomous way or through a network of intermediaries;
• Building a good and solid reputation among employers and unemployed people by offering better and less time consuming pre-selection services.
The most challenging of these options consists of the last one, requiring novel and small budget approaches, especially if one takes into consideration that some European countries are already using expensive and powerful software platforms for smart searching, matching and analysis.
As highlighted in the case studies “A ‘Virtual Labour Market Platform’ for the Public Employment Service in Germany” (GHK Consulting Ltd, 2011) and “Bundesagentur für Arbeit” (WCC, n.d.), the implementation of a bi-directional and multidimensional matching system (considering over 40 criteria) has helped the German PES (BA) to achieve a leadership position in the field of online job portals. It also enabled BA to position itself as a modern service provider for all groups active on the labour market, bringing job seekers and employers together more quickly, with improved search results, more precise comparison between vacancies and applicants and an enhanced transparency nationwide, alongside more simplified and efficient consulting and job placement procedures and additional services to companies.
1 The double-sided asymmetric information problem can be stated in the following terms: employers try to
5
1.2.
J
OBM
ATCHINGP
ROCEDURES ATJ
OBC
ENTRESFor clarity of understanding, this section aims at providing a brief but (hopefully) clear description of the main phases and procedures of the job matching activities carried out by and at PES job centres, namely: identification of potential candidates; pre-screening interview at the job centre; referral to a job offer; follow-up of job referrals.
Identification of potential candidates
The main methods to identify potential candidates to registered job offers consist of the following ones:
• Manual consultation and analysis of available curricula vitae;
• Identification of potential applicants among job candidates present at the job centre, through face-to-face contact;
• Use of the already available automated matching tool, based on parameters such as: intended (and previous) occupation; experience; educational attainment; study and or training areas; qualification level; professional qualifications; driving, language and soft skills; profiling category; being a single parent; being part on an unemployed couple.
As far as the last method is concerned, it should also be noted that for every 50 potential candidates resulting from the performed queries, the following thresholds shall apply, as a rule of thumb:
• 10 to 15 applicants per job offer, on average (until a maximum of 20 to 30, when necessary), in the case of job offers marked as level 1;
• 8 to 10 applicants per job offer, on average (until a maximum of 20 to 25, when necessary), in the case of job offers marked as level 2.
Pre-screening interview at the job centre
Following the identification of potential applicants in the terms previously described, job centres proceed to the summoning of relevant candidates for a pre-screening interview aiming at giving information about the job offer conditions, as well as collecting additional information on the candidate in order to assess his or her suitability to the vacancy at hand and willingness to accept it. The following thresholds shall apply, as a rule of thumb:
• 15 to 25 applicants per vacancy, on average (until a maximum of 20 to 30, when necessary), in the case of job offers marked as level 1;
6
Referral to a job offer
Candidates that attend and perform successfully at the pre-screening interview conducted at the job centre will, in principle, receive a job referral aiming at an interview with the employer. At this stage, the following thresholds shall apply (always as a rule of thumb):
• 3 to 8 applicants per vacancy, on average, in the case of job offers marked as level 1; • 3 to 5 applicants per vacancy, on average, in the case of job offers marked as level 2.
In the case of job offers marked as level 1, it is also mandatory that a PES counsellor (namely the one responsible for its management and follow-up) shall be present; in the case of job offers marked as level 2, that will be up to the responsible counsellor to decide in face of the situation at hand. The main objective behind the participation of a PES job counsellor at the interview(s) with the employer is to ensure a greater effectiveness of the matching process, through the close monitoring and evaluation of potential refusals either by the candidate or the employer.
Follow-up of job referrals
This stage of the matching process aims at determining whether the candidate attended the interview with the employer and, if so, whether he or she declined the job offer and why (when applicable). Job offers refusals can be classified into one of the following categories:
• Refusal by the employer - Vacancy already fulfilled • Refusal by the employer - Unsuitable applicant
• Refusal by the employer - Selection of another candidate • Refusal by the employer - Interview not scheduled • Refusal by the employer - Facts declared by candidate • Refusal by the employer - Subjective reasons
• Job offer cancelled by the employer
• Refusal by the candidate - Salary related reasons • Refusal by the candidate - Work conditions • Refusal by the candidate - Job offer's occupation
• Refusal by the candidate - Commuting time/distance to work • Refusal by the candidate - Commuting expenses
• Refusal by the candidate - Other reasons • Candidate didn't attend the interview • Other reasons
• Placed at another job vacancy • Cancelled referral
• Candidate on medical leave
7 In the graph below (picture 1.1), the relative importance of the relevant types of refusals for the period 2012-2015 is highlighted, for a clearer picture of the context in which job referrals and placements take place:
Source: IEFP, IP
Picture 1.1 - Relative importance of job offers’ refusals by categories
As it would be expected, refusals by employers exceed, by far, the ones presented by candidates, who are subject to penalties when it is considered that they are not engaging in a facilitated job match. In 39.1% of the cases, the scheduling of the interview by the employer doesn’t even take place, followed by subjective reasons (24.3%) and the fulfilment of the reported vacancy through other channels (14.6%). When employers and candidates do meet, around 11% of the referred applicants are considered unsuitable by the former, in terms of the required skills for the job (other refusals after an effective job interview may be included in the rather unclear category of candidates declined by subjective reasons).
All in all, these figures appear to confirm the employers’ generalized lack of trust in the job brokering services provided by PES combined with the dominance of informal channels, such as already employed workers who are able to “provide trustworthy information about the new worker” (Larsen & Vesan, 2012). The greater preponderance of refusals by employers also seems to point to the lesser importance of building a good reputation among the unemployed (Larsen & Vesan, 2012). The need for an effective screening of suitable applicants and on-time delivery of results thus continues to present itself as an important goal to be achieved by the Portuguese PES, notwithstanding the efforts already undertaken and the improvements obtained in the last years, as previously mentioned.
0.05% 0.10% 0.11% 0.21% 0.29% 0.31% 0.35% 0.54%
2.24% 6.93%
10.96% 14.56%
24.28%
39.08%
0.00% 5.00% 10.00% 15.00% 20.00% 25.00% 30.00% 35.00% 40.00% 45.00% Refusal by the candidate - Work conditions
8
1.3.
S
TUDYO
BJECTIVESAs suggested by its title, the current research is focused on improving job matching services by the Portuguese PES, through the application of machine learning algorithms and can be captured by the following research question:
To what extent can job matching services provided by the Portuguese PES be improved through the application of machine learning algorithms and what is the best approach to the automation of the recruitment process?
The following points summarize the specific objectives that were pursued in order to achieve the above mentioned main goal:
• Extensive review of relevant literature and case studies in order to find the novelist and the most adequate and feasible machine learning algorithm(s);
• Study and application of the most relevant and recent algorithms available in the software package SAS Enterprise Miner;
• Identification of the most relevant variables to be used as inputs;
• Evaluation of the algorithm's performance, based on how effective it is in assigning consistent relevance scores to the candidates, compared to the ones assigned by human recruiters;
• Evaluation of the algorithm's performance against the applicant's risk of long term unemployment as estimated by the previously mentioned logistic regression, among other relevant input variables;
9
1.4.
S
TUDYR
ELEVANCE ANDI
MPORTANCEAs mentioned in the paper by Strohmeier and Piazza (2013), human resources management (HRM) constitutes a fairly new domain of data mining research and in spite of the existence on an extensive collection of application examples clearly demonstrating the relevance and importance of this field, there is still great room for improvement, namely in what concerns functional relevance and success. From the literature reviewed, only the paper by Drigas et al. (2004), which is also the least recent one, has a specific focus on registered unemployed, with a relatively restricted approach in what respects to the studied domains and variables, especially if one takes in consideration some of the factors that hinder PES performance in comparison to private sector companies, such as the administration of unemployment benefits and a particularly low skilled applicants' pool.
On the other hand, the first public version of the European Classification of Skills/Competences, Qualifications and Occupations (ESCO) - a standard and multilingual terminology supporting the automated analysis and interpretation of semi-structured and unstructured data, such as CVs and vacancies - has been recently released, providing an important basis for further and novel research in this field.
As already mentioned, an additional and important driver is the growing need to compensate for an insufficient number of employment counsellors (even in a more conservative scenario of semi-automated screening and selection procedures), in order to tackle the needs of the registered unemployed and improve the image and reputation of the Portuguese PES.
10
1.5.
O
UTLINE11
2.
CRITICAL LITERATURE REVIEW
According to Strohmeier & Piazza (2013), the following dimensions should be taken in consideration in what relates to the application of data mining techniques to human resources management (HRM):
• Functional dimension, comprising the following criteria: functional domain (HR problem being treated), functional relevance (whether and how the HR problem's relevance is justified) and functional success (evaluation of the success of data mining in solving the HR problem);
• Method dimension, comprising the following criteria: methodical category (mining methods that are employed) and methodical adjustment (whether these data mining techniques are general or domain-specific customized/developed);
• Data dimension: ensuring data availability and suitability;
• Information systems (IS) dimension: whether and which IS are provided; • User dimension: intended and supported HR user-related tasks;
• Ethical and legal awareness: whether and how these issues are being considered.
Given the relevance of its main findings and implications for future research, the above mentioned article offers a good structured approach to the organization of the present chapter.
2.1.
F
UNCTIONAL DIMENSIONAll of the publications reviewed so far have a clear focus on employee selection, namely on automated pre-screening and ranking of applicants, based on their quality and fitness for a certain job. Personality mining is also taken in consideration (Faliagka et al., 2013) and the paper Efficient Multifaceted Screening of Job Applicants (Mehta, Pimplikar, Singh, Varshney, & Visweswariah, 2013) presents an even broader approach by including the following sequential hiring stages:
• Technical match, based on text fields (such as skills) extracted from the candidate’s (unstructured) CV matched to the job description;
• Quality ranking, based on a dataset comprising past decisions by human screeners (pass or fail);
• Likelihood of a candidate accepting a job offer (onboard);
• Prediction of the risk of leaving the organization (attrition), at the pre-hire stage of the human resource lifecycle.
12
2.2.
M
ETHOD DIMENSIONFrom a broad range of data mining techniques, classification methods are the most frequently employed ones, which can be explained by the specific character of the addressed problems (discriminating suitable and unsuitable applicants).
In the model proposed by Akinyede & Daramola (2013), a feed forward neural network is considered (picture 2.1), where Ck consists of the jobs applicants applied for; Un and Jm correspond to the job history, qualification and experience of the applicant Sj; Pn represents the weight (i.e., relative importance) of each field; and the output variable measures how suitable the applicant is for a certain job. With a view to improve generalization performance and achieve the best classification, the multilayer perceptron with structural learning is employed and receiver operating characteristic (ROC) is used in order to provide the percentage of detections correctly classified and the non-detections incorrectly classified.
Source: Akinyede & Daramola, 2013
Picture 2.1 - Example of an artificial neural network model
In the paper by Drigas et al. (2004), an expert system for the evaluation of the unemployed at certain offered posts, based on neuro-fuzzy techniques, is presented. There is a fuzzy rule for every criteria of the type: "Candidate’s X matches X Criterion", where X belongs to a fuzzy set (training, education, experience, language and computer knowledge, for instance). These criteria can be satisfied in a binary way (yes or no, 0 or 1) or through a membership function (in which case the satisfaction of a certain criterion is scored between 0 and 1). The training of the system ultimately aims at finding a weight vector "w" that minimizes the following constrained linear least-squares problem (picture 2.2):
Source: Drigas et al, 2004
13 where:
• Si,j corresponds to the criteria ("j") satisfaction for training case "i";
• Di takes the value 1 if the proposed post for case "i" was accepted and 0 otherwise;
• and Lbj is the lower bound of weight "j" and Ubj is the upper bound (constrained in the interval [0-1]).
The authors manage to demonstrate that learning weights lead to an average 10% increase in job matching.
In the paper by Faliagka et al. (2013), four different machine learning models are considered, namely: Linear Regression (LR), M5’ model tree (M5’), REP Tree decision tree (REP), and Support Vector Regression (SVR) with two non-linear kernels (i.e. polynomial kernel and PUK universal kernel). The Tree models and the SVR model with a PUK kernel produce the best results, contrarily to linear regression, which performs poorly. The authors further conclude that the algorithm generated models presented high accuracy except for the jobs that required special skills.
In the model proposed by Mehta et al. (2013), a bipartite ranking through minimization of a standard univariate loss function is applied, based on random forest classifiers (of 100 trees) in order to better handle a great number of categorical features. After an experimental validation of the developed tool, the authors argue that its usage would have led to a "dramatic 14.6% increase in hiring yield over business as usual". An important issue that is also addressed in the paper at hand is that of imbalanced training sets, with many more negative samples than positive ones, due to its implications at various levels, namely in what relates to the most appropriate performance measures that should be taken in consideration.
In fact and according to the paper "Data mining for imbalanced datasets: An overview" (Chawla, 2005), predictive accuracy might not be appropriate when dealing with this type of cases and specific sampling techniques are required in order to reach more balanced datasets. In what relates to adequate performance evaluation, the following measures are proposed:
• ROC curves and AUC
14 • Precision and recall
The expressions for precision and recall can be derived from the following formulas:
Precision = TP / (TP + FP) Recall = TP / (TP + FN)
Although the main goal of learning from imbalanced datasets is to improve the recall without sacrificing precision, these two performance measures are often conflicting, since the increasing of the true positive for the minority class may result in an increase in the number of false positives. A metric that combines the trade-offs of precision and recall, that is, among different values of TP, FP, and FN, is the F-value, which expression is as follows:
F-Value = (1 + B2)*recall*precision / (B2*recall + precision), where B corresponds to the relative importance of precision versus recall and is usually set to 1.
• Cost sensitive measures (cost matrix and cost curves)
The main idea behind cost-sensitive measures is that, based, for instance, on a matrix defining the penalties incurred in false positives and false negatives, it is possible to search for a decision that minimizes the expected overall cost.
15 bagging, stacking, random forests and other ensembles, generalized linear models, nearest neighbours, partial least squares and principal component regression, logistic and multinomial regression" and other methods) are evaluated and random forests are considered to be the best family of classifiers, followed by SVM, neural networks and boosting ensembles. A last study worth mentioning is that of Lessmann, Baesens, Seow and Thomas (2015), where 41 different classification algorithms are compared, without any resampling, however. According to these authors, heterogeneous ensembles classifiers also perform well.
In conclusion and as pointed out in several articles (López, Fernández, & Herrera, 2014; Krawczyk, Wózniak, & Schaefer, 2014), there are three main types of approaches to deal with the class imbalance problem:
• Data level solutions: through the rebalancing of the class distribution by sampling the data space in order to diminish the effect caused by class imbalance, in what can be described as an external approach.
• Algorithmic level solutions: through the adaptation of several classification algorithms to strengthen the learning in favour of the positive class, in what can be described as an internal approach that creates new algorithms or modifies existing ones in order to tackle the problem at hand;
16
2.3.
O
THERR
ELEVANTD
IMENSIONSReal-world data is used in the majority of cases, with conventional (semi)structured data retrieved from HR Information Systems (HRIS) being the most frequent one, followed by the less frequent text data (acquired from documents produced by applicants or employees) and web content data (gathered from social networks). It should also be noted that some of the reviewed research only addresses specific occupations (Drigas et al., 2004; Faliagka et al., 2013) or organizations (Mehta et al., 2013). However, in order to better support selection decisions and enable the discovery of unexpected patterns, data should be as broad as possible, covering a large pool of heterogeneous applicants and job offers.
On the other hand, the majority of the systems presented in the research contributions consist in stand-alone applications that don't require data mining expertise and possess a user-friendly interface, as demonstrated in Faliagka et al. (2013), Mehta et al. (2013) and Akinyede and Daramola (2013).
End-user related issues should also be taken in consideration, by minimizing the need to perform data mining tasks, alongside the lack of transparency of the underlying models. The adoption of an adequate strategy for the embracing of analytics-based solutions is another critical issue to address at this level, as highlighted in Mehta et al. (2013).
17
3.
METHODOLOGY
This chapter will start with the presentation of the methodological approach and research strategy, alongside a brief description of the main data sources and variables that have been used and of the corresponding data collection and storage procedures. It will then proceed with a description of the sampling and analysis methods, including the classification models and instruments that have been taken under consideration. In general, and in more technical terms, the SEMMA methodology (which stands for Sample, Explore, Modify, Model, and Assess) has been followed closely:
• Sample the data, through the creation of one or more data tables, big enough to contain the most relevant information, without sacrificing, however, capacity and speed of processing (a trade-off that must be handled carefully);
• Explore the data, in order to understand it to the fullest, gain knowledge and detect possible anomalies;
• Modify the data, through the selection and transformation of existing variables, as well as the creation of new ones in order to enhance model performance;
• Model the data, by choosing the most appropriate algorithm among the most relevant ones in order to produce reliable predictions of the desired outcome;
• Assess the data, through the evaluation of the obtained results in terms of usefulness and reliability.
3.1.
D
ATAS
OURCESD
ESCRIPTIONThe main data sources that have been used in the current thesis consist of the following ones: Input variables
Internal data (from Portuguese PES databases): anonymised applications and job vacancies External data:
• Relevant statistical information available for public or research use; • ESCO database, freely available for download.
Target variable
Internal data (from Portuguese PES databases): matching results (i.e., if the applicant got the job or not).
18
Data set Nr. inputs Size Main variables
Registrations of job seekers
168
677 853 registered job seekers at stock in 2011
2 978 690 new registrations in 2012-2015
2 573 832 annulations in 2012-2015
•Applicant's personal data (masked id number, age, sex, nationality, marital status, type of existing disability, number of dependents, parish of residence)
•Applicant's academic/professional qualification (highest level of qualification, major subject, training certificates, work experience, ...) •Applicant's job history (date employed,
date disengaged, job code, status, employer, last-salary, condition for leaving, name, min year)
•Data relating to the registration (year, month, type of movement, date and reason for registration, preferred job or jobs, employment status, responsible career manager and job centre, geographical mobility profile, probability of becoming a long term unemployed)
•Administrative data relating to unemployment and social benefits (past benefits and new ones being claimed)
19
Data set Nr. inputs Size Main variables
Registered job offers 99
3 897 job offers at stock in 2011 398 151 new vacancies in 2012-2015
•Organization (masked id number, line of trade, number of workers)
•Job requirement (job offer code, occupation, required qualifications and skills, place of work, number of vacancies, required experience, salary and other working conditions)
•Data relating to employment incentives associated to the job offer
•Data relating to the registration of the job offer (year, month, type of movement, date, responsible job centre and manager, status of the job offer, handling level)
Summons for job interviews by PES
106 2 169 170
•"Snapshot" of the applicant's characteristics at the time of the call for a job interview
•Data relating to the registration and management of the summon for a job interview (date of the summon, applicant's id number, responsible job centre, outcome and date of the outcome)
Referrals to job offers by PES
135 2 547 923
•"Snapshot" of the applicant's and job offer's characteristics at the time of the referral
•Data relating to the registration and management of the referral (date of the referral, applicant's id number, responsible managers and job centres, outcome and date of the outcome)
Source: IEFP, IP
20 It would also be relevant to take in consideration data from Social Security (such as information on the complete previous experience of the unemployed and length of successful job placements) and (private) information available in social media profiles. However, the use of such elements is dependent on explicit consent, which prior studies have demonstrated to be very difficult to obtain (Bollinger et al., 2012).
As for relevant external statistical information, it consists of data freely available on Statistics Portugal online portal, namely:
• Proportion of purchasing power by geographic location;
• Unemployed, employed and active population by geographic location; • Population commuting patterns;
• Average monthly earnings by occupation;
• Expected evolution of employment over the following three months; • Quarterly unemployment rate;
• Persons employed at enterprise births by geographic localization and economic activity; • Demography of enterprises (number of births, deaths and survival rates of enterprises born
two years before) by geographic location and economic activity.
The finality of these external data is twofold: to enrich the core data and to support the conversion of nominal and categorical data to numerical data, namely in what concerns occupations, economic activities and geographical classifications.
The first public release of the European Classification of Skills/Competences, Qualifications and Occupations (ESCO v0, last updated in 06/08/2014), has also been used, on an experimental basis, as a means to establish a correlation between occupations based on common (hard) skills. This multilingual classification identifies and categorises skills, competences, qualifications and occupations relevant for the EU labour market, containing around 4.800 occupations and more than 5.000 skills. The system is freely available for use by everyone through an online portal (https://ec.europa.eu/esco/portal/download) and has been developed in an open IT format.
21
3.2.
P
RE-P
ROCESSING,
S
AMPLING ANDP
ARTITIONINGP
RE-
PROCESSINGFor analysis and modelling purposes, four distinct datasets were created based on the previously presented ones:
• One mixing nominal and numerical variables containing only internal data;
• One containing only internal data where all nominal variables are converted to numbers; • Two additional versions of the former data sets enriched with external data (including
ESCO).
This distinction derives from the fact that some classification algorithms are well suited to work with data of mixed scaling level (e.g., classification trees and Bayes classifiers), whereas others (e.g., ANNs and SVMs) benefit from encoding nominal variables (Lessmann et al., 2015).
All of these datasets are based on a table resulting from the joining of the master table containing referrals to job offers with the master table containing data relating to job offers. Since each job offer is related to more than one job referral, the most approximate registers based on the date of the referral and on the date of the creation or last update to the job offer were considered for that effect.
In order to reduce the original number of variables, the following options were taken:
• Elimination of variables with more than 50% of missing values, as well as of variables with a purely administrative nature;
• Aggregation of various dummy variables into a unique binary variable describing a common feature (such as, for instance, whether a job offer is associated with a financial incentive instead of considering each type of incentive as a distinct input);
• Substitution of mirror variables (such as the qualifications of the applicant vs. the minimum required qualifications specified in the job offer) by a variable quantifying whether a match between the two exists, ranging from 0 to 1.
As for the conversion of categorical variables to numerical ones, the following strategies were taken in consideration, depending on each type of situation:
• Substitution of nominal binary classes (of the type "yes" or "no") by numerical binary classes (0 or 1);
• Substitution of categorical variables with more than two classes into a single dummy variable (such as, for instance, whether an applicant is of Portuguese nationality instead of creating a dummy variable for each different possible value of the listed countries of origin); • Substitution of a categorical variable by one or more numerical variables providing
22 • Application of the Weight of Evidence (WOE) method, a "technique which converts a nominal input into an interval input by using a function of the distribution of a target variable for each level in the nominal input variable" (Zdravevski, Lameski, & Kulakov, 2013) and (Cathie, Chakraborty, & Garla, 2013).
The imputation of missing values (using a median/mode replacement for numeric/nominal attributes, amongst other techniques) and data transformation for normalization purposes will be described in the "Results" section.
S
AMPLINGAs previously mentioned, there are three common sampling approaches in what concerns unbalanced datasets (Damodaran, Kumar, Raj, Jagan, & State, 2016):
• Under-sampling: According to this technique, the apparent sampling frequency of the majority samples is reduced by randomly removing observations;
• Over-sampling: According to this technique, the apparent sampling frequency of the minority samples is increased by randomly repeating each observation;
• SMOTE: According to this (oversampling) technique, the apparent sampling frequency of the minority samples is increased by creating new synthetic observations using a specific algorithm.
Within the present thesis, the first and last techniques have been applied. The SMOTE approach, in particular, is addressed in several papers by SAS Institute (Damodaran et al., 2016; Wang, Lee, & Wei, 2015) and can be illustrated as follows (picture 3.1):
Source: Damodaran et al., 2016 Picture 3.1 - SMOTE sampling technique
23 Another important issue to address in this context is related to the size of the dataset to be processed, especially when the volume of information is big and there is enough processing capacity. Should the entire database be processed or only a sample of it? According to SAS Institute (Milley, Seabolt, & Williams, 1998), processing the entire database may be advantageous in scenarios such as the following ones: when there are more variables than records; when the process underlying the generation of the data is rapidly changing; in exception reporting systems; if the problem’s solution is dependent on a few records. In most cases, however, this alternative poses problems at various levels, namely: inference/generalization, since using all of the data leaves no space to test the model’s explanatory power on new events or to validate findings on data unseen by the model; quality of the findings, since exhaustive methods may reveal spurious relationships; speed and efficiency of processing. Exploring a sample that reflects and preserves the most important characteristics of the underlying data is, generally, easier and more efficient than processing the entire database, without loss of accuracy.
D
ATAP
ARTITIONINGIn the presence of a large number of observations, a straightforward approach can be adopted in what concerns data partitioning. In this type of context, the available data is normally divided into a train, validation and test set, except in the case of classification models containing out-of-bag data (such as Random Forests), where a test set won’t be necessary.
We recall that the main objective of partitioning is to avoid over or under-fitting. The training dataset is used for model fitting, in a preliminary phase, through the pairing of the input with the output; the validation dataset’s main goal is to monitor and tune the model, being also used for model assessment; the test partition main goal is to evaluate how the model will work with new data, that has never been presented to the model. In SAS Enterprise Miner there is the possibility of using random sampling, stratified random sampling, or a user-defined partition to create these datasets with the following default proportions: 40%/30%/30%. Within the present thesis, these have been changed to 50%/25%/25% or to 60%/20%/20% whenever appropriate or to 70%/30%, when there is no need or enough data to create a test set.
In the article “On the importance of the validation technique for classification with imbalanced datasets: Addressing covariate shift when data is skewed” (López et al., 2014), a problem known as dataset shift is addressed. It is described as consisting of a different data distribution between the training and test partitions and is also presented as being more severe in classification with imbalanced datasets. In order to prevent this situation, the authors propose a specific validation technique for the partitioning of data, known as ‘‘Distribution optimally balanced stratified cross-validation’’ (DOB–SCV), which basically tries to assure that each partition contains enough representatives of every region, by placing close-by samples on different folds. According to the same authors, there are three possible types of dataset shift:
24 • Covariate shift: It happens when input attribute values have different distributions between
the training and test sets.
• Concept shift/drift: This problem occurs when the relationship between the input and class variables changes, presenting itself as the hardest challenge among the different types of dataset shift.
The DOB–SCV technique attempts to alleviate the problem of covariate shift, preventing, at the same time, prior probability shift. Its pseudo-code is shown in the figure below (picture 3.2):
Source: López et al., 2014
Picture 3.2 - DOB–SCV partitioning method
When working with small datasets and in order to obtain more robust results (as well as to ensure computational feasibility), Lessmann et al. (2015) propose the Nx2-fold cross-validation technique, which involves the following steps, where the N parameter is set depending on dataset size: “i) randomly splitting a data set in half, (ii) using the first and second half for model building and evaluation, respectively, (iii) switching the roles of the two partitions, and (iv) repeating the two-fold validation N times.”
25
3.3.
M
ODELB
UILDINGFor the reasons presented earlier, in the present thesis the following families of classifiers have been taken in consideration:
• Random forests • Gradient Boosting • Support Vector Machines
• Ensembles of neural networks and or decision trees
It should be noted, however, that a bigger emphasis has been placed on random forests due to their advantages at various levels, namely in terms of accuracy, capacity to handle large datasets with thousands of variables, including badly unbalanced ones, as well as extensive missing values and many-valued categorical variables.
In fact (Breiman, 2001), the classifier at hand is considered to perform very well in comparison to many others, including support vector machines and neural networks due to a strategy that may appear to be counterintuitive but turns out to be quite effective (Liaw & Wiener, 2002): contrary to standard trees, where the best split among all variables is used to split each node, in a random forest, the best split among a subset of predictors randomly chosen at each node is used for that effect, yielding a low correlation. On the other hand, as the number of trees in the forest is increased, the generalization error converges a.s. to a limit, minimizing or even eliminating overfitting.
In comparison to other powerful tree-based modelling techniques, such as stochastic gradient boosting (Freeman, Moisen, Coulston, & Wilson, 2016), the random forest classifier is considered to be more user friendly, less prone to overfitting and less sensitive to parameter tuning. RF also performs better in the presence of correlated predictor variables, as it tends to spread importance among more variables than SGB. Another important advantage over SGB, especially when small datasets are involved, is the possibility of not needing to set aside an independent test set due to the out-of-bag option for model evaluation.
26
3.4.
B
RIEFO
VERVIEW OF THEU
NDERLYINGSAS
N
ODESFor clarity of understanding, this section aims at providing a brief description of the SAS nodes supporting the models previously presented, based on SAS® Enterprise Miner® 14.1 Reference Help and a SAS paper by Brown & Mues (2012).
The HP Forest node produces a predictive model known as forest, which consists of several decision trees differing from each other in the following ways: the training data for a tree consists of a sample without replacement within all available observations; the input variables that are used to split a node are randomly selected from all available inputs. Regarding other aspects, the training of trees in a forest is similar to the one applied to standard trees. For that effect, the three main available options comprise the number of trees, the number of inputs for a node and the sampling strategy, which can be fine tuned through the following node properties, respectively: Maximum Number of Trees, Number vars to consider in split search and Proportion of obs. in each sample. It should also be noted that this algorithm differs from Leo Breiman’s bagging algorithm (Breiman, 2001), since it samples the original data without replacement, in order to provide more variability between the trees, especially when larger training sets are involved. Another requirement to take in consideration relates to the fact that HP Forest does not generate DATA Step score code, making it necessary to use a special procedure (PROC HP4SCORE) to access HP Forest score code.
A support vector machine (SVM) consists of a supervised machine-learning method used to perform classification and regression analysis, having as its basic principle the construction of a maximum-margin hyperplane in a transformed feature space. The exact transformation doesn't need to be specified, though, since SVM models recur to the principle of kernel substitution in order to turn them into a general (nonlinear) model. Only binary classification problems (including polynomial, radial basis function, and sigmoid nonlinear kernels) are supported by the HP SVM node, which does not perform multi-class problems or support vector regression.
27 Neural networks (NN) consist of mathematical representations which try to mimic the functioning of the human brain, being highly flexible in modelling non-linear associations between input and target variables. Of the various possible architectures, the most widely used one is the Multilayer Perceptron (MLP), which normally comprises an input layer (obtaining the values of input variables), a hidden layer (providing the required nonlinearity) and an output layer (corresponding to one neuron, in the case of binary target variables). The inputs are processed by each neuron and the resulting output is transmitted to the subsequent layer neurons. During the training process, a weight is assigned to each of these connections and the output of a hidden neuron is computed through the application of an activation function (such as a logistic function, for instance) to the weighted inputs and the associated bias term. During the estimation process and after a random initialization, the network weights are iteratively adjusted in order to minimise an objective function such as the sum of squared errors.
Decisions trees consist of classification and estimation tools, based on algorithms that split the data into smaller branch-like segments and assign a class to each observation, through a series of leaf nodes with a root at the top containing the entire dataset. Two of the major advantages of this modelling technique over algorithms such as Neural Networks, for instance, relate, on the one side, to the production of output that can be represented by easily interpretable rules (written in a language such as sql, for instance) and, on the other side, to the treatment of missing data, which are used as inputs, based on surrogate rules whenever necessary. In SAS Enterprise Miner, the options to choose the splitting criteria and to the determine the tree construction method include popular features such as CHAID (Chi-square automatic interaction detection), as well as those described in Classification and Regression Trees (Breiman, Friedman, Stone, & Olshen, 1984).
28
4.
RESULTS
The main objective of this chapter is to present and discuss the results that were obtained throughout the study and their implications, within a comparative analysis with previous studies. For that effect, the main results will be presented according to each of the considered datasets and models, in order to better evidence differences that may arise between them and analyse whether they are supported by relevant literature.
4.1.
D
ATASETS ANDS
AMPLESD
ESCRIPTIONAs mentioned earlier, the following datasets have been considered:
• One mixing nominal and numerical variables containing only internal data ("Internal_mixed");
• One containing only internal data where all nominal variables are converted to numbers, through the WOE technique ("Internal_num");
• Two additional versions of the former data sets enriched with external data (including ESCO), namely: "Complete_mixed" and "Complete_num".
The datasets containing both internal and external data comprise 42 input variables, of which 6 were taken from sources external to the Portuguese PES operational system. The number of observations is common to all datasets, totalling 1,062,651. However, due to performance issues and the need to obtain more balanced datasets, only 10% of the observations have been taken in consideration, containing equal proportions of positive and negative events. For that effect, the following settings have been considered in SAS Sample node (picture 4.1):
29 After data partitioning (normally, 70% for training and 30% for validation), the posterior probabilities of the models had to be adjusted, namely through the inversion of prior probabilities, as illustrated below (picture 4.2):
Picture 4.2 - Decisions Node Settings
In order to determine a good cut-off for the predicted probabilities, SAS cut-off node has also been used, namely the option which finds the intersection between the Event Precision Rate and the True Positive, which in, the example below, equals 0.56 (picture 4.3).
30
4.2.
V
ARIABLES
ELECTIONAs highlighted in the paper "Identifying and Overcoming Common Data Mining Mistakes" (Wielenga, 2007), variable selection should not be restricted to just one method in order to avoid missing potentially important predictors, especially when a large number of variables is involved. A safe strategy thus consists of creating a pool of predictors based on the variables that were selected by any of the methods. SAS EM provides a variety of nodes for that effect, namely: (HP) Variable Selection, HP Forest, (HP) Regression, Stat Explore and Interactive Grouping (WOE). This step should be undertaken after data partition, in order to avoid overfitting and after missing values imputation, in the case of using regression nodes as a variable selection method.
In tables 4.1 to 4.3, below, the complete set of variables under consideration (including internal and external data), is presented, alongside the results obtained within the variable selection step, after sampling and data partition. The variables rejected by each of the methods were signalled in red. For that effect and in the case of the HP Forest node, variables with an out-of-bag margin reduction less than or equal to zero were rejected; as far as the HP Regression Node is concerned, non-null parameter estimates and p-values <0.05 were considered; lastly, default settings have been taken under consideration in the case of the remaining nodes.
Table 4.1 - Variable selection
Variable Name Role Level Description HP Forest HP Variable
Selection Stat Explore WOE HP Regression
AP_FREGUESIA INPUT NOMINAL
Job seeker's parish of
residence 10 37 1 8 S
AP_CPP_OFERTA INPUT NOMINAL Job offer's occupation 2 11 2 2 S
AP_CC INPUT NOMINAL
Job seeker's municipality of
residence 4 31 3 1 S
AP_APOIADA INPUT BINARY
Whether job offer benefits
from financial incentives 1 2 4 4 S
AP_NUT3 INPUT NOMINAL
Level 3 of the nomenclature of
territorial units for statistics 5 3 5 3 S
ofa_CAE2 INPUT NOMINAL
Job offer's sector of activity at
2 digits level 3 1 6 5 S
AP_CPP_PRETENDIDA INPUT NOMINAL
Job seeker's intended
occupation 22 38 7 13 S
AP_CPP_ANTERIOR INPUT NOMINAL
Job applicant's previous
occupation 19 30 8 12 S
Nascimentos_nr INPUT INTERVAL
Births of enterprises (external
variable - INE) 20 26 9 11 S
ISDR INPUT INTERVAL
Regional development composite index (Overall index) by Geographic
localization (NUTS - 2013) 12 7 10 6 S
PPC INPUT INTERVAL
Proportion of purchasing
power (external variable - INE) 9 12 11 7 S
AP_GOE INPUT BINARY Job offer's manager 6 32 12 10 N
AP_DISTRITO INPUT NOMINAL
Job seeker's district of
residence 7 9 13 9 N
Taxa_sobrev_2antes INPUT INTERVAL
Survival rate of enterprises 2
31 Table 4.2 - Variable selection (cont.)
Variable Name Role Level Description HP Forest HP Variable
Selection Stat Explore WOE HP Regression
AP_CPP2 INPUT NOMINAL
Job seeker's intended
occupation at 2 digit level 17 5 15 15 N
AP_INT_TEMPO_INSCRICAO INPUT INTERVAL
Registration period as a job
seeker with PES 8 4 16 17 S
AP_CATEGORIA INPUT NOMINAL
Category of job applicant (unemployed or employed; searching for a first or a new job; engaged in an active employment measure;
unavailable) 15 14 17 36 N
mt_SimTipocontrato INPUT INTERVAL
Similarity between job offer's demanded conditions and job seeker's profile in what relates to type of work contract (fixed
term...) 13 23 18 16 S
TxDesemp INPUT INTERVAL Quartely unemployment rate 30 22 19 20 N
ofa_NR_POSTOS_TRAB INPUT INTERVAL
Number of vacancies
contained in the job offer 11 8 20 24 S
ofa_SALARIO INPUT INTERVAL Job offer's (monthly) wage 21 13 21 23 N
Conta_Skills INPUT INTERVAL
Number of common skills between job offer's occupation and job seeker's intended occupation (external variable
-ESCO) 26 17 22 19 S
ofa_NR_PESSOAS_SERVICO INPUT INTERVAL
Number of people working in the company responsible for
the job offer 14 6 23 18 S
AP_IDADE INPUT INTERVAL Job seeker's age 24 15 24 21 S
AP_RSI1 INPUT BINARY
Whether job seeker benefits
from social benefits 23 18 25 40 N
AP_SEGMENTO INPUT NOMINAL
Job seeker's long term
unemployment risk profile 29 33 26 26 S
mt_SimProf INPUT INTERVAL
Similarity between job offer's demanded conditions and job seeker's profile in what relates
to occupation 25 25 27 22 S
AP_TEMPO_PRATICA_UCNP3 INPUT INTERVAL
Job seeker's experience at last
job (nr. months) 36 19 28 32 S
AP_MES INPUT NOMINAL Month of the job referral 27 10 29 25 S
AP_TEMPO_PRATICA3 INPUT INTERVAL
Job seeker's experience at intended occupation (nr.
months) 35 24 30 31 N
AP_SUBSIDIADO INPUT BINARY
Whether job seeker is receiving