Gene expression profile analysis of human intervertebral disc degeneration
Kai Chen*, Dajiang Wu*, Xiaodong Zhu, Haijian Ni, Xianzhao Wei, Ningfang Mao, Yang Xie, Yunfei Niu
and Ming Li
Department of Orthopedics, Changhai Hospital affiliated to the Second Military Medical University,
Shanghai, China.
Abstract
In this study, we used microarray analysis to investigate the biogenesis and progression of intervertebral disc degen-eration. The gene expression profiles of 37 disc tissue samples obtained from patients with herniated discs and de-generative disc disease collected by the National Cancer Institute Cooperative Tissue Network were analyzed. Differentially expressed genes between more and less degenerated discs were identified by significant analysis of microarray. A total of 555 genes were significantly overexpressed in more degenerated discs with a false discovery rate of < 3%. Functional annotation showed that these genes were significantly associated with membrane-bound vesicles, calcium ion binding and extracellular matrix. Protein-protein interaction analysis showed that these genes, including previously reported genes such asfibronectin, COL2A1 andb-catenin, may play key roles in disc degener-ation. Unsupervised clustering indicated that the widely used morphology-based Thompson grading system was only marginally associated with the molecular classification of intervertebral disc degeneration. These findings indi-cate that detailed, systematic gene analysis may be a useful way of studying the biology of intervertebral disc degen-eration.
Keywords: genes, intervertebral disc degeneration, molecular classification, protein-protein interaction.
Received: January 11, 2013; Accepted: June 11, 2013.
Introduction
The intervertebral disc (IVD) is a cartilaginous struc-ture that shows degenerative and age-related changes ear-lier than other connective tissues in the body (Urban and Roberts, 2003). Disc degeneration occurs when its cells die or become dysfunctional, especially in an acidic environ-ment. During degeneration, the IVD becomes dehydrated and vascularized, and there is an ingrowth of nerves (Hugheset al., 2012). As a multi-factorial process, disc de-generation is influenced by factors such as genetic predis-position, lifestyle conditions, including obesity, occupa-tion, smoking and alcohol consumption (Samartziset al., 2012), aging phenomena (Gruber and Hanley, 2007) and other health factors, such as diabetes. Disc degeneration is important clinically because of a strong association be-tween disc degeneration and back pain (Luoma et al., 2000), which is a major public health problem in modern industrialized societies. In addition, the altered physiology of the IVD during degeneration is associated with many other clinical symptoms or conditions, such as lower limb pain, paraesthesia, spinal stenosis and disc herniation (Hugheset al., 2012).
Previous studies have identified some molecular markers associated with disc degeneration. For example, asporin was found to be expressed at higher levels in degen-erated human IVD (Gruberet al., 2009). The mRNA ex-pression levels ofADAMTS-7andADAMTS-12were sig-nificantly higher in endplate cells of degenerative discs compared with those in non-degenerative discs (Zhanget al., 2012). In addition, genetic polymorphisms incollagen I, collagen IX, collagen XI, aggrecan, extracellular ma-trix-degrading enzymes, inflammatory cytokines, such as IL (interleukin)-1, IL-6 and TNFa(tumor necrosis factors
a),Fas/FasLand vitamin D receptors have been associated with the development of intervertebral disc degeneration (IVDD) (Kalbet al., 2012).
In this study, we compared the gene expression pro-file data of IVDD patients with that of healthy controls. The gene profiles were downloaded from the gene expression omnibus (GEO) database and the intervertebral disc data were classified into two groups according to the Thompson grading system (Thompsonet al., 1990).
Materials and Methods
Microarray data analysis
Microarray datasets were downloaded from the GEO database (accession numbers GSE15227 (Gruber et al.,
www.sbg.org.br
Send correspondence to Ming Li. Department of Orthopedics, Changhai Hospital affiliated to Second Military Medical University, 200433 Shanghai China. E-mail: [email protected]. *These authors contributed equally to this work.
2009) and GSE23130 (Gruberet al., 2012)). The signal in-tensities were re-calculated with the robust multi-array av-erage (RMA) (Irizarry et al., 2003) using the Entrez Gene-based center custom Chip Description File (CDF) de-veloped by University of Michigan (Daiet al., 2005). The single sample classified as Thompson grade I was consid-ered as healthy (Gruberet al., 2009) and ignored before merging the GSE15227 and GSE23130 data. ComBat (Johnsonet al., 2007) was applied to the merged dataset to remove potential unwanted batch effects. The samples were divided into two groups based on the Thompson grad-ing system. Grade IV and V samples were considered as more degenerated (Gruberet al., 2009). Significant analy-sis of microarray (SAM) (Tusheret al., 2001) was applied to identify differentially expressed genes using a delta of 1. Functional annotation was done on DAVID (Huang daet al., 2009) using significantly differentially expressed genes.
Protein-protein interaction analysis
Differentially expressed genes were submitted to STRING 9.0 (Szklarczyket al., 2011) to detect possible protein-protein interactions. EntrezGene IDs were trans-lated into official gene symbols by DAVID before submit-ting. A threshold score of 0.4 was applied as default. Only those interactions that were proven experimentally were considered. A simple Perl script was used to exclude genes/proteins not in the query gene list.
Cluster analysis
The data for each gene was median-centered before clustering. Centered correlation was applied as a similarity metric and average linkage as a clustering method. The analysis was done in Cluster 3.0 and a heatmap was gener-ated by TreeView. A one-sided Fisher’s exact test was used to assess the consistence of the molecular and Thompson grade classifications.
Results
Differentially expressed genes in IVD degeneration
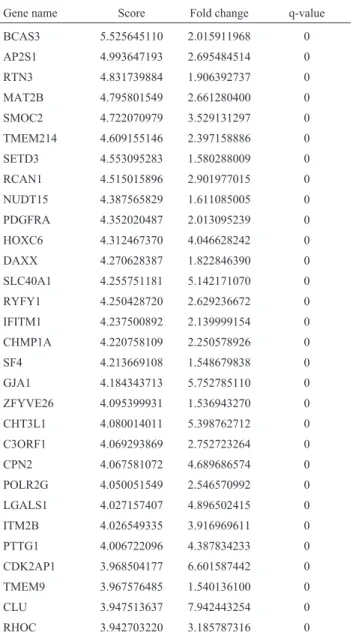
Eleven disc samples (eight Grade IV and three Grade V) were classified as the more degenerated group while the remaining 26 samples (10 Grade II and 16 Grade III) were classified as the less degenerated group. One thousand sam-ple permutations were used to estimate the false discovery rate (FDR). When delta was set to 1,555 genes were over-expressed in the more degenerated disc samples (Table 1) and 98 genes were underexpressed in the more degenerated disc samples (Table 2). Both groups had an FDR < 3%. The overexpressed gene list was referred to as IVDD_UP and the underexpressed gene list as IVDD_DN. Several of the IVDD_UP genes have been reported before. For example, asporin, which is present in the cartilage extracellular ma-trix (ECM) (Henryet al., 2001) and may be genetically
as-sociated with osteoarthritis (Loughlin, 2005), showed higher expression levels in Thompson Grade IV human discs compared to lower grade discs (Gruberet al., 2009). A highly conserved secreted serine protease, HTRA1, which degrades numerous extracellular matrix proteins, was also found in IVDD_UP. HTRA1 mRNA and protein levels are significantly elevated in degenerated disc tissue (Tiadenet al., 2012). The gene expression of cathepsin K, a cysteine protease that cleaves the triple helical domains of collagen types I and II, was significantly greater in more de-generated discs (grades III and IV) compared to healthier discs (grades I and II) (Gruberet al., 2011).
Functional annotation of differentially expressed genes
Differentially expressed genes were submitted to DAVID (Huang daet al., 2009) for functional annotation. Table 1- Top 30 IVDD_UP genes with p < 0.05 and FDR < 3%.
Gene name Score Fold change q-value
BCAS3 5.525645110 2.015911968 0
AP2S1 4.993647193 2.695484514 0 RTN3 4.831739884 1.906392737 0
MAT2B 4.795801549 2.661280400 0 SMOC2 4.722070979 3.529131297 0 TMEM214 4.609155146 2.397158886 0
SETD3 4.553095283 1.580288009 0 RCAN1 4.515015896 2.901977015 0
NUDT15 4.387565829 1.611085005 0 PDGFRA 4.352020487 2.013095239 0 HOXC6 4.312467370 4.046628242 0
DAXX 4.270628387 1.822846390 0 SLC40A1 4.255751181 5.142171070 0 RYFY1 4.250428720 2.629236672 0
IFITM1 4.237500892 2.139999154 0 CHMP1A 4.220758109 2.250578926 0
SF4 4.213669108 1.548679838 0 GJA1 4.184343713 5.752785110 0 ZFYVE26 4.095399931 1.536943270 0
CHT3L1 4.080014011 5.398762712 0 C3ORF1 4.069293869 2.752723264 0
CPN2 4.067581072 4.689686574 0 POLR2G 4.050051549 2.546570992 0 LGALS1 4.027157407 4.896502415 0
ITM2B 4.026549335 3.916969611 0 PTTG1 4.006722096 4.387834233 0
CDK2AP1 3.968504177 6.601587442 0 TMEM9 3.967576485 1.540136100 0 CLU 3.947513637 7.942443254 0
Databases for disease information, functional categories, gene ontology, curated pathways and protein domains were included to provide a comprehensive knowledge source. For the IVDD_UP genes, 195 functional annotation clus-ters were identified. The top three clusclus-ters ranked by the en-richment score were mainly associated with membrane-bounded vesicles, calcium ion binding and extracellular matrix, with enrichment scores of 4.7, 3.61 and 3.25, spectively. Noticeably, these enriched genes were also re-lated to the biological process of skeletal system develop-ment, including cartilage development. Among the IVDD_DN genes, there were only 19 clusters with the highest enrichment score being only 0.87; this score was for a cluster involving mainly zinc fingers and the Krueppel-associated box.
Protein-protein interactions among differentially expressed genes
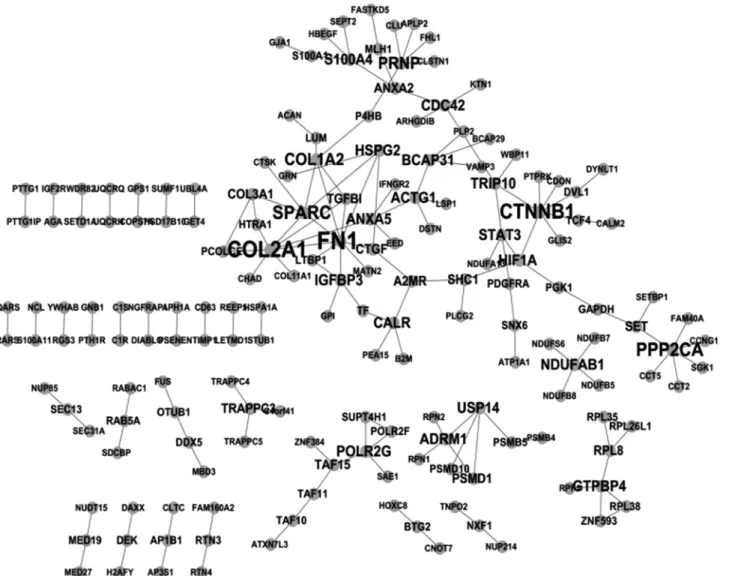
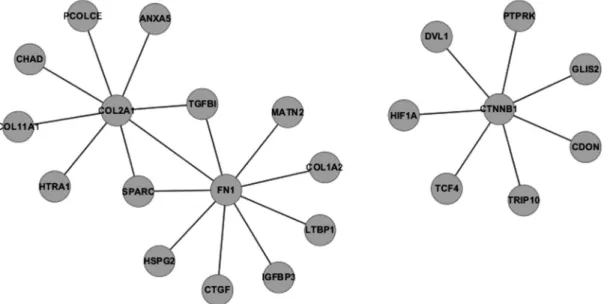
STRING showed that 159 experimentally proven protein-protein interactions were formed by 175 genes in IVDD_UP (Figure 1). Fibronectin 1,COL2A1 (collagen, type II,a1) andb-catenin were the three genes/proteins that had the most interacting partners (Figure 2). Of these 175 genes, 107 had only one interacting partner in IVDD_UP and thus resembled the phenomenon of scale-free biologi-cal networks (Barabasi and Albert, 1999). Surprisingly, no interactions were observed amongst IVDD_DN genes.
Cluster analysis of IVD tissues
Unsupervised hierarchical clustering was done on 22 disc tissues of GSE23130. The experimental results ob-tained using all 18,818 genes or only 1,984 genes with a minimum sample standard deviation of 1 were highly simi-lar (Figure 3). A one-tailed Fisher’s exact test showed a marginally significant association between the Thompson-based classification and the unsupervised molecular classi-fication (p = 0.04799 for the 18,818-gene case and 0.09133 for the 1,984-gene case).
Discussion
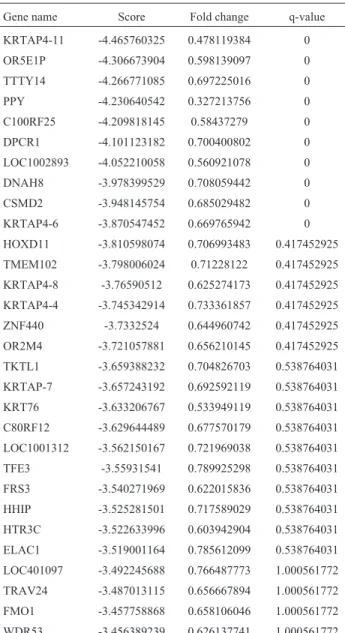
Our microarray analysis of the gene expression pro-file of degenerated IVD detected hundreds of differentially expressed genes that may be associated with IVD degener-ation. Functional annotation supported the biological rele-vance of our findings. Protein-protein interaction analysis of IVDD_UP revealed genes that may have key roles in IVD degeneration. Fibronectin 1 (FN1), a molecular marker for fibrosis (Leask and Abraham, 2004), was up-regulated in punctured mouse tail discs that showed pro-gressive degenerative changes and were fibrocartilaginous (Yanget al., 2009). Earlier studies reported that the degra-dation fragments of fibronectin (Fn-f) accumulate in the disc during degeneration (Oegemaet al., 2000) and induce IVD degeneration in rabbits (Greg Andersonet al., 2003). Given thatHTRA1can induce fibronectin proteolysis and one of the resultant fragments was found to be increased in HTRA1-treated IVD cell cultures as well as in disc tissue from patients with IVD degeneration, it was hypothesized thatHTRA1promoted IVD degeneration through the pro-teolytic cleavage of fibronectin and subsequent activation of resident disc cells (Tiaden et al., 2012). The over-expression of these two genes was consistent with this hy-pothesis. Interestingly, fibronectin mRNA and protein levels were significantly down-regulated following the up-regulation ofHTRA1in rhesus monkey choroid-retina en-dothelial cells (RF/6A) and human umbilical vein endothe-lial cells (HUVECs) (Jianget al., 2012), suggesting that some other unknown factors may be involved in the inter-action betweenHTRA1and fibronectin in IVD tissues. Table 2- Top 30 IVDD_DN genes with p < 0.05 and FDR < 3%.
Gene name Score Fold change q-value
KRTAP4-11 -4.465760325 0.478119384 0
OR5E1P -4.306673904 0.598139097 0 TTTY14 -4.266771085 0.697225016 0
PPY -4.230640542 0.327213756 0 C100RF25 -4.209818145 0.58437279 0 DPCR1 -4.101123182 0.700400802 0
LOC1002893 -4.052210058 0.560921078 0 DNAH8 -3.978399529 0.708059442 0
CSMD2 -3.948145754 0.685029482 0 KRTAP4-6 -3.870547452 0.669765942 0 HOXD11 -3.810598074 0.706993483 0.417452925
TMEM102 -3.798006024 0.71228122 0.417452925 KRTAP4-8 -3.76590512 0.625274173 0.417452925 KRTAP4-4 -3.745342914 0.733361857 0.417452925
ZNF440 -3.7332524 0.644960742 0.417452925 OR2M4 -3.721057881 0.656210145 0.417452925
TKTL1 -3.659388232 0.704826703 0.538764031 KRTAP-7 -3.657243192 0.692592119 0.538764031 KRT76 -3.633206767 0.533949119 0.538764031
C80RF12 -3.629644489 0.677570179 0.538764031 LOC1001312 -3.562150167 0.721969038 0.538764031
TFE3 -3.55931541 0.789925298 0.538764031 FRS3 -3.540271969 0.622015836 0.538764031 HHIP -3.525281501 0.717589029 0.538764031
HTR3C -3.522633996 0.603942904 0.538764031 ELAC1 -3.519001164 0.785612099 0.538764031
LOC401097 -3.492245688 0.766487773 1.000561772 TRAV24 -3.487013115 0.656667894 1.000561772 FMO1 -3.457758868 0.658106046 1.000561772
The IVDD_UP group of genes contained four colla-gen colla-genes: COL11A1, COL1A2, COL3A1 and COL2A1. COL2A1interacted with eight other proteins encoded by genes in IVDD_UP. Mutations inCOL2A1give rise to a spectrum of phenotypes that predominantly affecting carti-lage and bone. These chondrodysplasias are typically char-acterized by a disproportionately short stature, eye abnor-malities, cleft palate and hearing loss. Increasing evidence has also implicatedCOL2A1mutations in individuals with isolated degenerative joint disease (Kannuet al., 2010). The relationship between COL2A1 gene polymorphisms and knee osteoarthritis were also investigated in Han Chi-nese women (Xuet al., 2011).
Mutations in the COL11A1 gene (also known as STL2) have been identified in some people with Stickler syndrome (Martin et al., 1999). Other mutations in this gene cause segments of DNA to be skipped when the tein is being made, resulting in an abnormally short pro-alpha chain. Alterations inCOL11A1impair collagen
func-tion and can lead to hearing loss, tearing of the lining of the eye, and bone and joint abnormalities (Rodriguez et al., 2004). COL1A2 is a protein found in most connective tissues. Mutations in this gene are associated with asteo-genesis imperfecta, Ehlers-Danlos syndrome, idiopathic osteoporosis and atypical Marfan syndrome (Vasanet al., 1991; Wardet al., 2001; Hartikkaet al., 2004). However, the symptoms associated with mutations in this gene tend to be less severe than with mutations in the gene fora1 type I collagen since thea2 form is less abundant (Bou-Gharioset al., 2004). Multiple messages for this gene result from mul-tiple polyadenylation signals, a feature shared with most of the other collagen genes (Zuoet al., 2012).
COL3A1is a protein that, in humans, is encoded by theCOL3A1gene located on chromosome 2 (Cuttinget al., 1990).COL3A1is a fibrillar collagen found in extensible connective tissues such as skin, lung and the vascular sys-tem, frequently in association with type 1 collagen. Muta-tions in this gene often lead to the exclusion of multi-exons Figure 1- Protein-protein interaction network for IVDD_UP genes. The larger the font size, the greater the number of interacting partners per node.
Figure 2- Protein-protein interactions involving the three most connected proteins.Fibronectin 1(FN1),COL2A1 and CTNNB1were the first, second and third most connected proteins, with nine, eight and seven edges, respectively.
(Superti-Furgaet al., 1988). Other studies have shown that (1) IVD cells respond strongly to changes in the osmotic environment by altering their mRNA expression,e.g., hu-man cells cultured over five days showed increased expres-sion of aggrecan and collagen II in the nucleus and annulus cells in the presence of elevated osmolarity (Wuertzet al., 2007), and (2) there is an increase in collagen-II, aggrecan and Sox-9 protein expression in the nucleus pulposus (NP) and anulus fibrosus (AF) regions of discs from running ex-ercised rats compared with non-exex-ercised controls (Brisby et al., 2010). Our result may indicate an as yet unknown role forCOL2A1in degenerated IVD.
Proper regulation of Wnt/b-catenin signaling is re-quired for development and organization of the IVD (Kon-doet al., 2011). Furthermore,b-catenin was overexpressed in IVD extracted from patients with IVD degeneration and X-ray and micro-CT analyses revealed osteophyte forma-tion and narrowing of the disc space in three-month-old
b-cateninconditional activation (cAct) mice (Tanget al., 2012). Our results may provide clues for studying the bio-logical mechanism ofb-catenin in human disc tissue.
Unsupervised clustering has provided insights into the molecular heterogeneity of complex diseases such as cancer and is useful in cancer diagnosis and therapy. The application of this analysis in our study showed that the widely used morphology-based Thompson grading system was only marginally associated with the molecular classifi-cation of IVDD. This interesting finding indicates that there is scope for improving the clinical assessment of the prog-ress of IVDD.
References
Barabasi AL and Albert R (1999) Emergence of scaling in random networks. Science 286:509-512.
Bou-Gharios G, Ponticos M, Rajkumar V and Abraham D (2004) Extra-cellular matrix in vascular networks. Cell Prolif 37:207-220.
Brisby H, Wei AQ, Molloy T, Chung SA, Murrell GA and Diwan AD (2010) The effect of running exercise on intervertebral disc extracellular matrix production in a rat model. Spine (Phila Pa 1976) 35:1429-1436.
Cutting GR, McGinniss MJ, Kasch LM, Tsipouras P and Anto-narakis SE (1990) Physical mapping by PFGE localizes the COL3A1 and COL5A2 genes to a 35-kb region on human chromosome 2. Genomics 8:407-410.
Dai M, Wang P, Boyd AD, Kostov G, Athey B, Jones EG, Bunney WE, Myers RM, Speed TP, Akil H,et al.(2005) Evolving gene/transcript definitions significantly alter the interpreta-tion of GeneChip data. Nucleic Acids Res 33:e175. Greg Anderson D, Li X, Tannoury T, Beck G and Balian G (2003)
A fibronectin fragment stimulates intervertebral disc degen-eration in vivo. Spine (Phila Pa 1976) 28:2338-2345. Gruber HE and Hanley EN (2007) Do we need biomarkers for disc
degeneration? Biomark Insights 1:131-133.
Gruber HE, Hoelscher G, Loeffler B, Chow Y, Ingram JA, Hal-ligan W and Hanley Jr EN (2009a) Prostaglandin E1 and
misoprostol increase epidermal growth factor production in 3D-cultured human annulus cells. Spine J 9:760-766. Gruber HE, Ingram JA, Hoelscher GL, Zinchenko N, Hanley r.
EN and Sun Y (2009b) Asporin, a susceptibility gene in osteoarthritis, is expressed at higher levels in the more de-generate human intervertebral disc. Arthritis Res Ther 11:R47.
Gruber HE, Ingram JA, Hoelscher GL, Zinchenko N, Norton HJ and Hanley Jr EN (2011) Constitutive expression of cathepsin K in the human intervertebral disc: New insight into disc extracellular matrix remodeling via cathepsin K and receptor activator of nuclear factor-kappaB ligand. Ar-thritis Res Ther 13:R140.
Gruber HE, Hoelscher GL, Ingram JA and Hanley Jr. EN (2012) Genome-wide analysis of pain-, nerve- and neurotrophin-related gene expression in the degenerating human annulus. Mol Pain 8:63.
Hartikka H, Kuurila K, Körkkö J, Kaitila I, Grénman R, Pynnönen S, Hyland JC and Ala-Kokko L (2004) Lack of correlation between the type of COL1A1 or COL1A2 mutation and hearing loss in osteogenesis imperfecta patients. Hum Mutat 24:147-154.
Henry SP, Takanosu M, Boyd TC, Mayne PM, Eberspaecher H, Zhou W, de Crombrugghe B, Hook M and Mayne R (2001) Expression pattern and gene characterization of asporin, a newly discovered member of the leucine-rich repeat protein family. J Biol Chem 276:12212-12221.
Huang da W, Sherman BT and Lempicki RA (2009) Systematic and integrative analysis of large gene lists using DAVID bioinformatics resources. Nat Protoc 4:44-57.
Hughes SP, Freemont AJ, Hukins DW, McGregor AH and Rob-erts S (2012) The pathogenesis of degeneration of the inter-vertebral disc and emerging therapies in the management of back pain. J Bone Joint Surg Br 94:1298-1304.
Irizarry RA, Hobbs B, Collin F, Beazer-Barclay YD, Antonellis KJ, Scherf U and Speed TP (2003) Exploration, normaliza-tion, and summaries of high density oligonucleotide array probe level data. Biostatistics 4:249-264.
Jiang J, Huang L, Yu W, Wu X, Zhou P and Li X (2012) Overexpression of HTRA1 leads to down-regulation of fi-bronectin and functional changes in RF/6A cells and HUVECs. PLoS One 7:e46115.
Johnson WE, Li C and Rabinovic A (2007) Adjusting batch ef-fects in microarray expression data using empirical Bayes methods. Biostatistics 8:118-127.
Kalb S, Martirosyan NL, Kalani MY, Broc GG and Theodore N (2012) Genetics of the degenerated intervertebral disc. World Neurosurg 77:491-501.
Kannu P, Bateman JF, Randle S, Cowie S, du Sart D, McGrath S, Edwards M and Savarirayan R (2010) Premature arthritis is a distinct type II collagen phenotype. Arthritis Rheum 62:1421-1430.
Kondo N, Yuasa T, Shimono K, Tung W, Okabe T, Yasuhara R, Pacifici M, Zhang Y, Iwamoto M and Enomoto-Iwamoto M (2011) Intervertebral disc development is regulated by Wnt/beta-catenin signaling. Spine (Phila Pa 1976) 36:E513-E518.
Loughlin J (2005) Polymorphism in signal transduction is a major route through which osteoarthritis susceptibility is acting. Curr Opin Rheumatol 17:629-633.
Luoma K, Riihimaki H, Luukkonen R, Raininko R, Viikari-Juntura E and Lamminen A (2000) Low back pain in relation to lumbar disc degeneration. Spine (Phila Pa 1976) 25:487-492.
Martin S, Richards AJ, Yates J, Scott JD, Pope M and Snead MP (1999) Stickler syndrome: further mutations in COL11A1 and evidence for additional locus heterogeneity. Eur J Hum Genet 7:807-814
Oegema Jr. TR, Johnson SL, Aguiar DJ and Ogilvie JW (2000) Fibronectin and its fragments increase with degeneration in the human intervertebral disc. Spine (Phila Pa 1976) 25:2742-2747.
Rodriguez R, Seegmiller R, Stark M and Bridgewater L (2004) A type XI collagen mutation leads to increased degradation of type II collagen in articular cartilage. Osteoarthritis Carti-lage 12:314-320.
Samartzis D, Karppinen J, Chan D, Luk KD and Cheung KM (2012) The association of lumbar intervertebral disc degen-eration on magnetic resonance imaging with body mass in-dex in overweight and obese adults: a population-based study. Arthritis Rheum 64:1488-1496.
Superti-Furga A, Gugler E, Gitzelmann R and Steinmann B (1988) Ehlers-Danlos syndrome type IV: a multi-exon dele-tion in one of the two COL3A1 alleles affecting structure, stability, and processing of type III procollagen. J Biol Chem 263:6226-6232.
Szklarczyk D, Franceschini A, Kuhn M, Simonovic M, Roth A, Minguez P, Doerks T, Stark M, Muller J, Bork P, et al. (2011) The STRING database in 2011: Functional interac-tion networks of proteins, globally integrated and scored. Nucleic Acids Res 39:D561-D568.
Tang D, Xu G, Hou W, Ye X, Shi Q, Chen D and Wang Y (2012)
b-Catenin plays a key role in lumbar intervertebral disc de-generation. Spine (Phila Pa 1976)18-37
Thompson JP, Pearce RH, Schechter MT, Adams ME, Tsang IK and Bishop PB (1990) Preliminary evaluation of a scheme for grading the gross morphology of the human interver-tebral disc. Spine (Phila Pa 1976) 15:411-415.
Tiaden AN, Klawitter M, Lux V, Mirsaidi A, Bahrenberg G, Glanz S, Quero L, Liebscher T, Wuertz K, Ehrmann M,et al. (2012) Detrimental role for human high temperature re-quirement serine protease A1 (HTRA1) in the pathogenesis of intervertebral disc (IVD) degeneration. J Biol Chem 287:21335-21345.
Tusher VG, Tibshirani R and Chu G (2001) Significance analysis of microarrays applied to the ionizing radiation response. Proc Natl Acad Sci USA 98:5116-5121.
Urban JP and Roberts S (2003) Degeneration of the intervertebral disc. Arthritis Res Ther 5:120-130.
Vasan NS, Kuivaniemi H, Vogel BE, Minor R, Wootton J, Tromp G, Weksberg R and Prockop D (1991) A mutation in the pro alpha 2 (I) gene (COL1A2) for type I procollagen in Ehlers-Danlos syndrome type VII: Evidence suggesting that skip-ping of exon 6 in RNA splicing may be a common cause of the phenotype. Am J Hum Genet 48:305-317.
Ward L, Lalic L, Roughley P and Glorieux F (2001) Thirty-three novel COL1A1 and COL1A2 mutations in patients with osteogenesis imperfecta types I-IV. Hum Mutat 17:434-434. Wuertz K, Urban JP, Klasen J, Ignatius A, Wilke HJ, Claes L and Neidlinger-Wilke C (2007) Influence of extracellular osmo-larity and mechanical stimulation on gene expression of intervertebral disc cells. J Orthop Res 25:1513-1522. Xu P, Yao J and Hou W (2011) Relationships between COL2A1
gene polymorphisms and knee osteoarthritis in Han Chinese women. Mol Biol Rep 38:2377-2381.
Yang F, Leung VY, Luk KD, Chan D and Cheung KM (2009) In-jury-induced sequential transformation of notochordal nu-cleus pulposus to chondrogenic and fibrocartilaginous phe-notype in the mouse. J Pathol 218:113-121.
Zhang Q, Huang M, Wang X, Xu X, Ni M and Wang Y (2012) Negative effects of ADAMTS-7 and ADAMTS-12 on endplate cartilage differentiation. J Orthop Res 30:1238-1243.
Zuo C, Wen F, Li M, Zhang X, Chen H, Wu K and Zeng R (2012) COL1A2 polymorphic markers confer an increased risk of neovascular age-related macular degeneration in a Han Chi-nese population. Mol Vision 18:1787-1793.
Associate Editor: Houtan Noushmer