Cisplatin Resistant Spheroids Model Clinically
Relevant Survival Mechanisms in Ovarian
Tumors
Winyoo Chowanadisai1,2☯, Shanta M. Messerli2☯, Daniel H. Miller3,4, Jamie E. Medina2,5, Joshua W. Hamilton2,6, Mark A. Messerli2,7*, Alexander S. Brodsky3,8,9*
1Department of Nutritional Sciences, Oklahoma State University, Stillwater, Oklahoma, United States of America, 74078,2Marine Biological Laboratory, Woods Hole, Massachusetts, United States of America, 02543,3Department of Biology, Massachusetts Institute of Technology, Cambridge, Massachusetts, United States of America, 02139,4Whitehead Institute for Biomedical Research, Cambridge, Massachusetts, United States of America, 02142,5Department of Biological Sciences, Bridgewater State University, Bridgewater, Massachusetts, United States of America, 02325,6Swenson College of Science and Engineering, University of Minnesota, Duluth, Minnesota, United States of America, 55804,7Department of Biology and Microbiology, South Dakota State University, Brookings, South Dakota, United States of America, 57007,8Department of Pathology and Laboratory Medicine, Rhode Island Hospital and Alpert Medical School of Brown University, Providence, Rhode Island, United States of America, 02903,9Center for Computational Molecular Biology, Brown University, Providence, Rhode Island, United States of America, 02912
☯These authors contributed equally to this work.
*mark.messerli@sdstate.edu(MAM);alex_brodsky@brown.edu(ASB)
Abstract
The majority of ovarian tumors eventually recur in a drug resistant form. Using cisplatin sen-sitive and resistant cell lines assembled into 3D spheroids we profiled gene expression and identified candidate mechanisms and biological pathways associated with cisplatin resis-tance. OVCAR-8 human ovarian carcinoma cells were exposed to sub-lethal concentra-tions of cisplatin to create a matched cisplatin-resistant cell line, OVCAR-8R. Genome-wide gene expression profiling of sensitive and resistant ovarian cancer spheroids identified 3,331 significantly differentially expressed probesets coding for 3,139 distinct protein-cod-ing genes (Fc>2, FDR<0.05) (S2 Table). Despite significant expression changes in some transporters including MDR1, cisplatin resistance was not associated with differences in intracellular cisplatin concentration. Cisplatin resistant cells were significantly enriched for a mesenchymal gene expression signature. OVCAR-8R resistance derived gene sets were significantly more biased to patients with shorter survival. From the most differentially expressed genes, we derived a 17-gene expression signature that identifies ovarian cancer patients with shorter overall survival in three independent datasets. We propose that the use of cisplatin resistant cell lines in 3D spheroid models is a viable approach to gain insight into resistance mechanisms relevant to ovarian tumors in patients. Our data support the emerging concept that ovarian cancers can acquire drug resistance through an epithelial-to-mesenchymal transition.
OPEN ACCESS
Citation:Chowanadisai W, Messerli SM, Miller DH, Medina JE, Hamilton JW, Messerli MA, et al. (2016) Cisplatin Resistant Spheroids Model Clinically Relevant Survival Mechanisms in Ovarian Tumors. PLoS ONE 11(3): e0151089. doi:10.1371/journal. pone.0151089
Editor:Sandra Orsulic, Cedars-Sinai Medical Center, UNITED STATES
Received:January 22, 2016
Accepted:February 23, 2016
Published:March 17, 2016
Copyright:© 2016 Chowanadisai et al. This is an open access article distributed under the terms of the
Creative Commons Attribution License, which permits unrestricted use, distribution, and reproduction in any medium, provided the original author and source are credited.
Data Availability Statement:Microarray data are available at the Gene Expression Omnibus database (GSE45553).
Introduction
High Grade Serous Ovarian Cancer (HGSOC) is the most lethal form of ovarian cancer with approximately 16,000 new cases in the United States each year with 5 year survival rates<30%
[1]. Platinum and taxane-based chemotherapy are the most common first-line agents, however, eventual resistance to cisplatin and recurrence of ovarian cancer following initial therapy is a major limitation [2], and is associated with poor prognosis following recurrence [3]. Thus, there is a pressing medical need to identify predictive markers in order to identify patients who will benefit from chemotherapy, and to develop new treatment options for this lethal disease.
Myriad mechanisms of platinum therapy resistance have been identified including changes in cisplatin transport and trafficking, disruption of apoptosis, increased tolerance of cisplatin-DNA adducts, and increased cisplatin-DNA repair in response to cisplatin-cisplatin-DNA interactions [4,5]. Many tumors exhibit multiple resistance pathways simultaneously [6].
Experimental models have not recapitulated the many features exhibited in tumors includ-ing intercellular communication and the influence of the microenvironment [7]. There has been increasing interest in 3D culture models amenable for high-throughput screening [7,8]. We aimed to characterize a spheroid cisplatin resistance model and determine how well this model recapitulates resistance mechanisms observed in patients. Moreover, more in vitro mod-els are needed to model the extensive heterogeneity of HGSOC [7]. Other recently derived resistant models such as SKOV3 [9] may not be good models of HGSOC, [10] leaving just OVCAR3 as a potential model[11].
Towards these goals, we derived a new OVCAR-8 cisplatin resistant cell line (OVCAR-8R) and used genome wide expression analysis to discover genes differentially expressed in the sen-sitive and resistant cells as spheroids. Genes differentially expressed between the parental and resistant OVCAR-8 cells are enriched for markers of the mesenchymal state and are associated with survival. Despite significant expression changes of cisplatin transporters, OVCAR-8R spheroids did not show significantly different intracellular platinum concentration or transport properties compared to the parental OVCAR-8 spheroids. We applied multiple methods to evaluate how similar the expression changes adapted by OVCAR-8R may be reflected in HGSOC tumors. A pathway and a direct evaluation of a set of genes both indicated that many features of OVCAR-8R spheroids model HGSOC tumors. These data indicate that the OVCAR-8R spheroid model captured critical aspects of cisplatin resistance relevant to ovarian cancer patients.
Materials and Methods
Reagents
Cisplatin (cis-diamminedichloroplatinum(II)) was purchased from Sigma-Aldrich. The human ovarian adenocarcinoma cancer cell line OVCAR-8 cell line was purchased through the National Cancer Institute Developmental Therapeutics Program’s tumor reposi-tory program. OVCAR-8 was made resistantin vitroby continuous stepwise exposure to cis-platin up to 5μM to produce the corresponding cisplatin-resistant cell line OVCAR-8R. The
cells were stably resistant after 6 weeks of growth in the absence of cisplatin. All cell lines were maintained in Dulbecco’s modified Eagle’s medium (DMEM) (Gibco, Grand Island, NY) con-taining 10% fetal bovine serum (FBS) with antibiotics (50 units penicillin/mL DMEM, 50μg
streptomycin/mL). Cells were grown as attached monolayers and incubated in a humidified atmosphere with 5% CO2at 37°C. OVCAR-8 cell lines were authenticated by the ATCC Cell
Line Authentication Service.
and analysis, decision to publish, or preparation of the manuscript.
Cell viability assay
Cells were plated in 96 well plates and treated 24 h later with the indicated concentrations of cisplatin. Viability was measured after 96 h of treatment using the WST-1 reagent (Roche), according to the manufacturer’s instructions.
Spheroid generation
Spheroids were generated by seeding OVCAR-8 and OVCAR-8R cells in low attachment aga-rose gel molds with hemispherical recesses. Gel casts were created by pouring 2% agaaga-rose into 3D Petri Dish casting molds (Microtissues, Providence, RI) [12,13]. To generate spheroids with a diameter of about 300μm, approximately 10,000–25,000 cells in 190μL DMEM were
placed in each mold and allowed to grow for 2–3 days before collection.
Cisplatin uptake assay
Net cisplatin uptake was determined by measuring platinum content of ovarian cancer cells before and after incubation with cisplatin. Equal numbers of OVCAR-8 and OVCAR-8R cells were plated in T75 flasks. Cells were treated with 5μM cisplatin for 3 hrs. After cisplatin
treat-ment, cells were washed once with HBSS, and then with PBS lacking calcium and magnesium. Cells were then dissociated in PBS containing no calcium or magnesium and containing 5 mM EDTA, and centrifuged at 229 x g. The pellet was dissolved in 20 mM Tris, pH 7.6 and the cells lysed by multiple freeze-thaw cycles at -80°C.
Platinum was measured by using an Agilent 7500CE ICP-MS (Agilent Technologies, Palo Alto, CA) at the Interdisciplinary Center for Plasma Mass Spectrometry at the University of California at Davis. Cell lysates and platinum standards were introduced using a MicroMist Nebulizer (Glass Expansion, Pocasset, MA) into a temperature controlled spray chamber. Plat-inum standard solutions, were diluted from standardized platPlat-inum stock solutions (SPEX CertiPrep, Metuchen, NJ) to concentrations from 0.01 to 300 ppb in 3% nitric acid (Fisher Sci-entific, trace metal grade) in deionized water (Millipore). Cisplatin content, calculated from platinum concentrations, was normalized to protein concentration (Bio-rad assay, Bio-rad. Hercules, CA), and background readings, derived as platinum content of cells prior to cisplatin incubation, were subtracted. Net cisplatin uptake (expressed asμg cisplatin/g protein) was first
determined as mol platinum per g protein and converted to weight of cisplatin by multiplying by the ratio of molecular weights of cisplatin (300.1 g/mol) to platinum (195.1 g/mol).
Gene expression profiling by microarray analysis
Total RNA was isolated from spheroids using the Trizol reagent (Invitrogen, Carlsbad, CA). Microarrays were processed at the Yale Center for Genome Analysis facility. RNA was frag-mented and labeled with the Affymetrix GeneChip Whole Transcript Target Labeling Assay and hybridized to the Affymetrix Human Gene 1.0 ST Arrays according to recommended Affy-metrix protocols (AffyAffy-metrix, Santa Clara, CA). Signals were calculated by Robust Multichip Analysis (RMA) using Expression Console software (Affymetrix, version 1.1). Genes with low signals, defined as the lowest quartile in both cisplatin sensitive and resistant cells, were excluded from further analysis. Raw and processed microarray data were deposited into the NCBI Gene Expression Omnibus database (GSE45553).
Quantitative RT-PCR
and PCR products were detected by EvaGreen-DNA binding (SsoFast EvaGreen Supermix, Biorad). Gene expression relative to glyceraldehyde 3-phosphate dehydrogenase (GAPDH) was determined by theΔΔCtmethod. Primer sequences are listed inS1 Table.
Bioinformatics and survival analysis
The Significance Analysis of Prognostic Signatures (SAPs) code and ovarian tumor datasets were downloaded from dryad [15]. The OVCAR-8R derived datasets were added to the MSigDB gene set list for SAPs analysis.
Hierarchical clustering was performed in Gene-E using Pearson correlation to calculate dis-tances [16]. Survival analysis including the Cox Proportional Hazards model, Kaplan-Meier analysis, and statistical tests including Student’s t-test were performed in R. Multiple hypothe-sis corrections were performed using the qvalue package [17]. All The Cancer Genome Atlas (TCGA) data were downloaded from the TCGA data portal using the published dataset. All TCGA data include primary ovarian tumors only. The Australian Oncology Group microarray data for ovarian tumors, GSE9891, was downloaded from GEO. Signals were normalized and determined by RMA [18] and only primary tumors were considered.
Results
Selection of cisplatin resistant OVCAR-8 ovarian cancer cells
OVCAR-8 cells were chosen for this study because they readily form spheroids [13], have fea-tures indicative of high-grade serous ovarian cancer [10], are mutant for p53 [19] and form xenografts with HGSOC histology [20]. Therefore, we hypothesized OVCAR-8 cells would provide a good cell line model to investigate cisplatin resistance mechanisms in spheroid con-ditions. When initially derived and tested OVCAR-8 cells did not significantly express metal-lothionein and were considered cisplatin sensitive relative to other patient derived cell lines [21]. Selection of drug resistant lines from increasing drug concentrations remains a powerful tool to gain insight into resistance mechanisms; however, little is understood with regard to resistance mechanisms in the context of spheroid culture systems, which appear to model tumors significantly better than monolayer culture [22].
Serial exposure of OVCAR-8 cells to sub-lethal concentrations of cisplatin resulted in signif-icant, lasting changes in cisplatin resistance (Fig 1). In both monolayer and spheroid condi-tions, cisplatin resistant cells, OVCAR-8R, showed a significant ~4-fold increase in the cisplatin IC50. In monolayer cultures, resistant cells showed greater adhesion to the culture vessel as indicated by the darker and flatter appearance under phase contrast (Fig 1C and 1D) although no morphological differences could be determined for the spheroids themselves (Fig 1E and 1F). The proliferation rate of resistant cells was also diminished compared to sensitive cells (data not shown). Cells remained resistant after growing in the absence of cisplatin for multiple generations. We hypothesized that the differences between the resistant and sensitive spheroids would better model mechanisms of resistance active in ovarian tumors compared to monolayer culture. To begin to test this hypothesis, we examined the mRNA expression differ-ences between the parental OVCAR-8 and the resistant OVCAR-8R cells in spheroids using Affymetrix microarrays. OVCAR-8 and OVCAR-8R cells had strikingly different expression profiles with 3,139 transcripts significantly differentially expressed (Fc>2, q<0.01) (S2 Table).
OVCAR-8R cells sequester cisplatin
Drug transporters that mediate intracellular drug concentration have been investigated as driv-ers of chemoresistance [23]. Many candidate cisplatin exporters, associated with cisplatin sen-sitivity were significantly down-regulated, MDR1 (Fc>3, q = 2e-5), hCTR1/SLC31A1 (Fc>2,
q = 2.6e-4) [24], ATP7A (Fc>2, q = 2e-5) [25] while others were up-regulated, MRP1/ABCC1
(Fc = 3, q = 1.7e-5) [26] and ABCA3 (Fc>2, q = 2e-4) [27], in the resistant line (S2 Table).
However, even though multiple pre-clinical models suggest the importance of MDR1 in cis-platin resistance, MDR1 expression has only rarely been correlated with responses and survival in ovarian cancer patients, even when considering multiple mechanisms of increasing MDR1 expression including promoter fusions [23].
The complicated mixture of differential expression of known cisplatin transporters did not immediately suggest that cisplatin transport was responsible for the observed resistance. To test whether drug transport and subsequent changes to intracellular concentration were driving
Fig 1. Selection of OVCAR-8 cells in increasing concentrations of cisplatin exposure leads to sustained resistance to cisplatin treatment.Cell viability of cisplatin resistant and sensitive cells grown as monolayers (A) or spheroids (B), expressed as a percentage of untreated viability, following exposure to varying concentrations of cisplatin for 96 h. Statistical comparisons were performed at each dose using a two-tailed Student’s t-test. Asterisks (**, p<0.01;***, p<0.001) indicate significant difference in viability between cisplatin-sensitive (dashed line) and resistant cells (solid line) at the same cisplatin concentration (mean±SE, n = 9). (C+D). Photomicrographs of cisplatin resistant (C) and sensitive (D) cells under phase contrast illumination.
Resistant cells display stronger adhesion to the substrate while sensitive cells do not. Photomicrographs of spheroids from resistant (E) and sensitive (F) lines.
resistance in OVCAR-8R spheroids, we measured intracellular platinum concentration in the spheroids using a cisplatin uptake assay by mass spectrometry. No difference in net uptake of cisplatin in cisplatin-sensitive (25.2 ± 8.2μg cisplatin/g protein) spheroids, compared to
cis-platin-resistant spheroids (26.5 ± 7.7μg cisplatin/g protein) was observed. These observations
indicate that even though expression of many drug transporters was down-regulated in resis-tant cells, the intracellular platinum concentration remained unaffected.
As OVCAR-8R spheroids did not demonstrate reduced intracellular platinum concentra-tions, other potential resistant pathways were evaluated. To handle intracellular platinum concentrations, sequestration can be mediated by platinum binding proteins including Gluta-thione-S Transferases and metallothioneins [5]. Large increases in expression of genes that bind cisplatin such as metallothioneins (MT2A and MT1E) were observed, indicating that the concept cisplatin may be sequestered in these cells. The metallothionein I and II isoforms have increased expression between 3-fold to 7-fold in OVCAR-8R cells, and MT1E was among the top genes up-regulated (Fc = 47, q = 3e-7) compared to OVCAR-8 cells. Higher expression of metallothioneins is a known mechanism of cisplatin resistance and increased expression in OVCAR-8R cells may drive platinum sequestration and drug resistance [4].
To identify pathways that may be mediating resistance, gene set enrichment analysis, (GSEA), was performed [28]. DNA repair pathways can be up-regulated in resistant cells and have been associated with patient survival [29]. The nucleotide excision repair pathway was not significantly differentially expressed (S3 Table). GSEA revealed that none of the major DNA repair pathways were significantly enriched in the OVCAR-8R spheroids (S3 Table). GSEA did identify numerous differentially expressed pathways (S3 Table), consistent with increased resistance including apoptosis regulation (Apoptosis Hallmark gene set NES = 1.9, FDR = 2e-4), including the apoptosis inhibitors, BIRC3 and BCL2L1 (S2 Table), and the inflammatory response Hallmark gene set (NES = 2.3, FDR<1e-4), characterized by increased
expression of IL6, IL18, IL8, IL1A, and TNF (S2 Table).
Fig 2. Differentially expressed transcripts between OVCAR-8R and OVCAR-8 spheroids are correlated between microarray and qPCR assays. Genes in the microarray dataset with differences in expression between sensitive and resistant ovarian cancer spheroids. (A) qPCR and microarray expression levels correlate. qPCR relative expression was calculated relative to GAPDH. Microarray scores are RMA. Trend line was determined by linear regression (r2= 0.71, p = 0.009). (B) The fold changes for the selected transcripts.
Reactome nucleotide metabolism gene set (NES = 1.4, FDR = 0.18) including NT5E, recently linked to cisplatin resistance [30] (S2 Table) was strongly up-regulated OVCAR-8R spheroids. Together, these observations indicate that multiple pathways are dysregulated con-tributing to the increased resistance of the OVCAR-8R spheroids.
Resistant OVCAR-8R cells are more mesenchymal
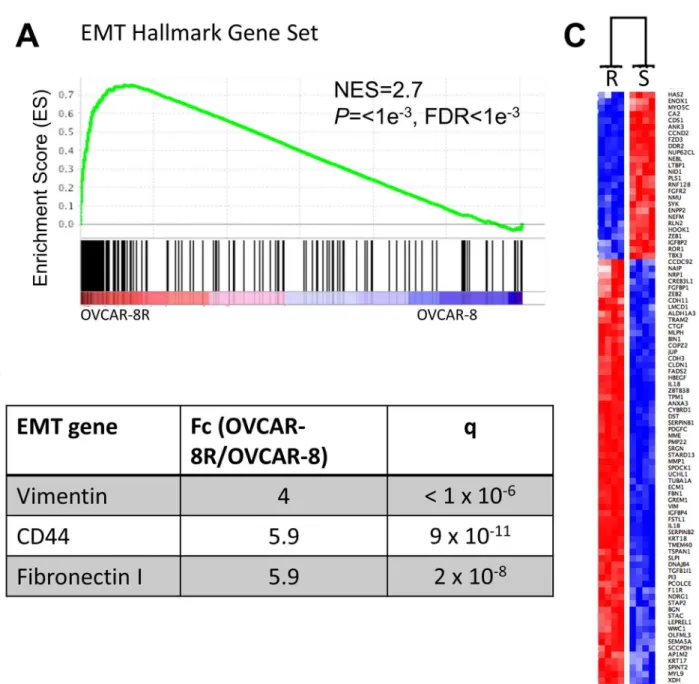
In order to test the hypothesis that the OVCAR-8R cells are more mesenchymal compared to OVCAR-8 cells, we evaluated whether the global gene expression program was indicative of a more mesenchymal phenotype. Mesenchymal cancer cells can be identified by examination of expression signatures indicative of mesenchymal states [31]. Epithelial-mesenchymal transi-tion (EMT) status in ovarian tumors is typically associated with more aggressive tumors and shorter survival [32,33]. The EMT hallmark gene set was the top-ranked cancer hallmark gene set when comparing OVCAR-8R and OVCAR-8 spheroids by GSEA (Fig 3A). Common mes-enchymal markers including MMP1, CD44, TGFBI, FN1, and vimentin had significantly higher expression in OVCAR-8R cells (Fig 3B). Dr. Brugge and colleagues recently reported ovarian cancer cells that were more mesenchymal were more invasive and correlated with poor outcome [33]. We observed significant overlap between the 3,139 differentially expressed resistant genes and the EMT signature proposed by Taube et al. (2010) (Overlap = 91 genes, P= 0.0001). These 91 EMT genes were strongly differentially expressed between OVCAR-8
and OVCAR-8R spheroids (Fig 3C). However, none of the major EMT transcription factors (SNAI1, SNAI2, TWIST1, ZEB1, or ZEB2) were significantly up-regulated in OVCAR-8R cells. In fact, only ZEB1 was modestly differentially expressed and it was 2-fold down-regulated in the resistant cells. Of special note, the expression of these factors was already high in OVCAR-8 spheroids, likely from the adaptation to spheroid cultures, which has been reported to increase expression of mesenchymal markers [33].
Alternatively, EMT could be driven by YAP1, another transcriptional driver that increases cancer stemness and EMT in multiple systems [34]. YAP1 is expressed 3 fold higher in OVCAR-8R spheroids (Fc = 1.5, q = 1e-5) and a YAP1 gene expression program is up-regu-lated as well (YAP1_up gene set [35], NES = 1.75, FDR = 0.002). These observations indicate a potential mechanism of EMT control, independent of expression changes of more classical EMT transcription factors, as YAP1 has recently been reported to drive EMT in multiple sys-tems including ovarian cancer [34,36–38]. OVCAR-8 cells are KRAS mutant and activation of YAP1 may be working with KRAS activation to drive resistance [37], indicating that inhibition of both KRAS and YAP1 could overcome resistance in this model.
Resistance gene expression signature is associated with survival
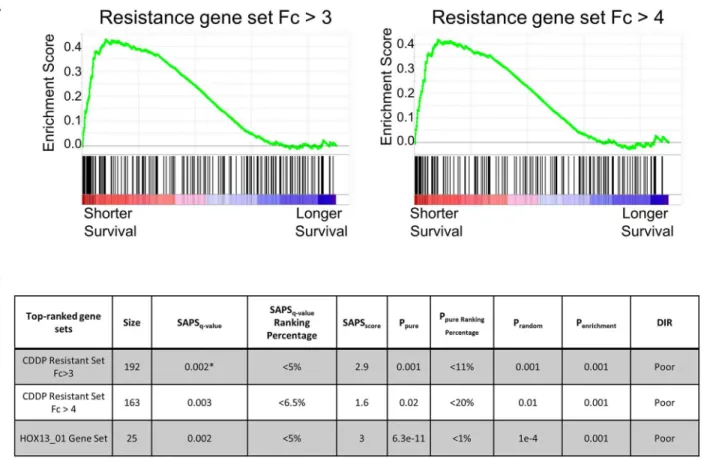
An increased mesenchymal state has been associated with shorter survival in ovarian cancer [33]. In order to determine if mechanisms of resistance captured by gene expression inthe resistance gene set to those from the Kegg, Reactome, BioCarta, and Gene Ontology data-bases.Fig 4shows that these two gene sets rank among the highest of the 5373 gene sets tested, with q-values of 0.002 for Fc>3 and 0.003 for Fc>4, near the maximum obtainable by the
algorithm.Fig 4Ashows the strong enrichment of the resistance gene sets across all the ovarian tumors evaluated. As a control, we list the HOX13_01 gene set, which was reported to be one of the most significantly associated with survival in ovarian cancer [40]. These observations indicate that the most differentially expressed genes in the OVCAR-8R spheroids significantly
Fig 3. Cisplatin resistance genes significantly overlap with genes associated with the mesenchymal state.(A) GSEA enrichment shows that the EMT hallmark gene set is significantly biased towards OVCAR-8R spheroids compared to OVCAR-8. (B) Key mesenchymal markers are significantly up-regulated in OVCAR-8R compared to OVCAR-8 spheroids. (C) The Taube EMT signature separates the OVCAR-8R and OVCAR-8 spheroids by hierarchical clustering using Gene-E with Pearson correlation calculated distances. Each row represents a gene. R is the OVCAR-8R and S is the parental OVCAR-8 spheroids. Red indicates higher risk, blue indicates lower risk.
identified patients with more aggressive and/or chemoresistant tumors leading to shorter over-all survival.
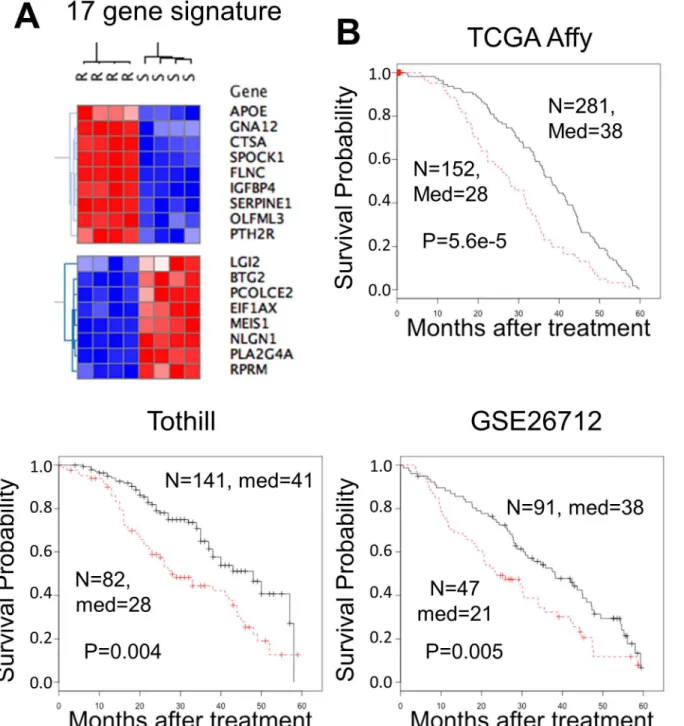
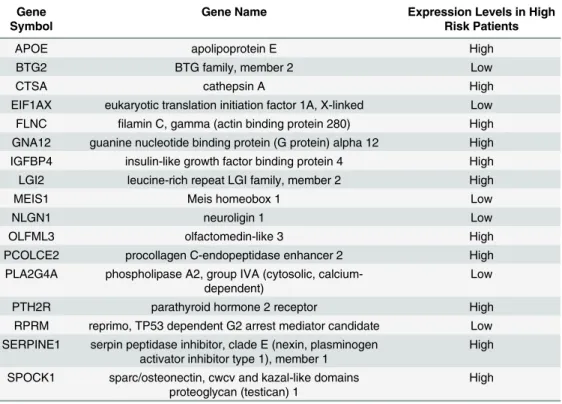
To assess if a defined gene expression signature can be derived from the list of differentially expressed transcripts that is associated with patient survival, we identified a 17 gene expression signature that separated OVCAR-8 and OVCAR-8R cells (Fig 5A) and separated high and low risk patients in 3 independent datasets (Fig 5B). These 17 transcripts, selected from the 3,139 resistant gene expression list, were significantly associated with survival in all three indepen-dent datasets (Table 1). These observations suggest that features of the sensitive and resistant cells are indicative of tumor behavior in patients.
Discussion
We developed a new spheroid model of drug resistance and provided evidence supporting its utility as a model for HGSOC tumors. We applied genome-wide expression profiling to gain insight into potential resistance mechanisms in the spheroids and examined which pathways may be relevant to patient tumors. In this model, resistance was not due to changes in drug transport or DNA repair, but rather to sequestration in combination with increased expression of anti-apoptosis pathways, cytokines, and an increased mesenchymal expression profile. Importantly, the changes adapted by the resistant cells in the expression profile identified patients with shorter survival and higher likelihood of relapse. We conclude that multiple
Fig 4. Differentially expressed transcripts are associated with survival across multiple ovarian cancer datasets.(A) SAPS analysis across 1735 ovarian tumor datasets suggests that both the Fc3 and Fc4 resistance transcript lists are significantly associated with shorter survival. (B) The Fc3 and Fc4 resistance gene sets were strongly enriched for shorter survival in the top 5% of all 5357 gene sets tested. Statistics for the resistance and representative strongly enriched gene sets are shown. The HOX13_01 gene set is shown as a positive control to compare the statistics.
mechanisms contribute to the cisplatin resistance of OVCAR-8R spheroids that are relevant to patients.
Previousin vitromodels of selected cisplatin resistance in ovarian cancer cell lines revealed a plethora of resistance mechanisms [6], of which sequestration and platinum inactivation are
Fig 5. A 17 cisplatin resistance gene expression signature was associated with shorter survival across three independent datasets and distinguishes OVCAR-8R from OVCAR-8 cells.Genes up-regulated in OVCAR-8R spheroids are expressed higher in patients with shorter survival and vice-versa. (A) Hierarchical clustering with Pearson correlation distances separates high and low expression in OVCAR-8R and OVCAR-8 spheroids. Hierarchical clustering was performed using Gene-E software [16]. (B) Overall survival curves for the three indicated datasets. Only patients with survival data up to 5 years were considered. The number of patients (n), median survival (med), and the p-value from a log-rank test are indicated. The red line indicates high risk and the black line represents low risk patients.
examples [21,41]. To determine how the OVCAR-8R spheroid resistance model compares to previously described cisplatin resistance models, we compared the gene expression changes to the A2780 resistance model in the GSE15709 [42] and GSE28648 [43] datasets. We found just 39 genes were differentially expressed across all 3 datasets (data not shown). We hypothesized that these 39 genes would be associated with survival and chemoresponse in patients. However, no significant association with survival was observed (data not shown). These findings indicate that the heterogeneity of the cell line models makes it challenging to connect gene expression signatures derived from such different conditions in this heterogeneous disease. This could be due to the strikingly different genetic backgrounds of these cell lines or because of the differ-ences in monolayer vs. spheroid culture conditions. Phenotypic and genetic analysis of pre-clinical models, including established cell lines, has led to sometimes-conflicting interpreta-tions of the validity of certain models [7]. The extreme genetic heterogeneity of ovarian tumors warrants continued development of pre-clinical models to capture the range of resistance mechanisms in various genetic backgrounds.
We specifically tested if resistance is associated with decreased platinum concentrations in the resistant cells and did not observe a significant difference in intracellular cisplatin concen-trations. The gene expression data and platinum uptake assay were consistent with cisplatin resistance being caused by increased sequestration of platinum, through up-regulation of metallothionein and other sulfur rich proteins. Consistent with sequestration, metallothionein I and II isoforms were up-regulated between 3-fold to 7-fold in OVCAR-8R cells, and metal-lothionein-1E was among the top genes up-regulated (47-fold) compared to parental OVCAR-8 cells. Higher expression of metallothioneins is a known mechanism of cisplatin resistance and their increased expression in OVCAR-8R cells is likely contributing to the observed resis-tance [4]. Therefore, the role of transporters in this OVCAR-8R spheroid model are different
Table 1. The 17 transcripts constituting the resistance survival expression signature.
Gene Symbol
Gene Name Expression Levels in High Risk Patients
APOE apolipoprotein E High
BTG2 BTG family, member 2 Low
CTSA cathepsin A High
EIF1AX eukaryotic translation initiation factor 1A, X-linked Low FLNC filamin C, gamma (actin binding protein 280) High GNA12 guanine nucleotide binding protein (G protein) alpha 12 High IGFBP4 insulin-like growth factor binding protein 4 High
LGI2 leucine-rich repeat LGI family, member 2 High
MEIS1 Meis homeobox 1 Low
NLGN1 neuroligin 1 Low
OLFML3 olfactomedin-like 3 High
PCOLCE2 procollagen C-endopeptidase enhancer 2 High
PLA2G4A phospholipase A2, group IVA (cytosolic, calcium-dependent)
Low
PTH2R parathyroid hormone 2 receptor High
RPRM reprimo, TP53 dependent G2 arrest mediator candidate Low SERPINE1 serpin peptidase inhibitor, clade E (nexin, plasminogen
activator inhibitor type 1), member 1
High
SPOCK1 sparc/osteonectin, cwcv and kazal-like domains proteoglycan (testican) 1
High
than the OVCAR-8 derived cisplatin resistant NCI/ADR-RES line, characterized by high MDR1 expression [44].
The mesenchymal nature of ovarian cancer cells is most often associated with more drug resistant tumors and shorter survival [32,33,45,46]. OVCAR-8 cells are an epithelial cell and 3D culture drives the mesenchymal state [47]. We observed increased expression in genes associated with epithelial—mesenchymal transition (EMT), such as YAP1, vimentin, fibronectin, collagen type 1 alpha 1, and P-cadherin expression [48]. OVCAR8 cells are reported to have relatively high YAP1 expression [49]. We observed changes in growth factor genes associated with EMT, such as transforming growth factor (TGF-β), epidermal growth factor (EGF), and fibroblast growth factor (FGF). The global gene expression pattern further supports the increased mesenchymal state of the OVCAR-8R spheroids. Together, these observations indicate that the OVCAR-8R spheroids model more mesenchymal, drug resis-tant tumors.
Our observations indicate that the OVCAR-8 spheroids represent a good model to examine cisplatin resistancein vitro. Similar to ovarian tumors, multiple mechanisms appear to contrib-ute to resistance and the differentially expressed genes in the resistant cells correlate with poor outcomes in patients. These changes in gene expression were long-lasting responses as resis-tance was maintained after extensive culture in the absence of platinum. Thisin vitromodel reflects similar cisplatin resistance mechanisms as those found in patients and will be useful for further physiological characterization of the resistance and investigation of methods for killing drug resistant cancer cells. We cannot conclude that all the observed changes are only observed in the spheroid form of the cells and not in the monolayer. Here, we focused on the spheroids and future efforts may evaluate differences in monolayer cultures.
A limitation of our study is that we only analyzed one cell line. Despite this limitation, this spheroid model is relevant to ovarian tumors as indicated by the common gene expression changes observed in the model and in ovarian tumors. The observation of the increased expres-sion of many mesenchymal markers, a global gene expresexpres-sion profile associated with survival using a global analysis, SAPS, as well as the derivation of a specific 17 gene expression signa-ture, all support the utility of this spheroid model to investigate mechanisms relevant to patients.
In summary, these observations indicate that the mechanisms of resistance in the OVCAR-8R cell line model are relevant to ovarian cancer patients, and support further investigation into the role of these genes in the development of resistance in ovarian cancer. This study of a spheroid model of ovarian cancer provides a foundation to gain new insights into cisplatin resistance in anin vitromodel.
Supporting Information
S1 Table. List of primer sequences used for qPCR.
(DOC)
S2 Table. List of genes significantly differentially expressed between OVCAR-8R and OVCAR-8 spheroids.
(XLSX)
S3 Table. Gene Set Enrichment Analysis (GSEA) of the Cancer Hallmarks and Reactome gene sets.Four worksheets are provided listing the gene sets enriched in the resistant or paren-tal cells.
Acknowledgments
We thank Joel Commisso at the Interdisciplinary Center for Plasma Mass Spectrometry at the University of California, Davis, for his technical expertise. We thank Milton C. Gum for his advice regarding dataset analyses. This work was funded by the NIH NCRR supplement grant P41 RR001395-27S1 (J.W.H.), NSF DBI-1005378“REU Site: Biological Discovery in Woods Hole”, faculty startup funds from the Office of Research at Oklahoma State University (W.C.), and the Mary Kay Foundation (A.S.B.).
Author Contributions
Conceived and designed the experiments: WC JWH SMM MAM. Performed the experiments: SMM DHM WC MAM JEM. Analyzed the data: WC SMM MAM ASB. Contributed reagents/ materials/analysis tools: DHM ASB. Wrote the paper: WC SMM MAM ASB.
References
1. Baldwin LA, Huang B, Miller RW, Tucker T, Goodrich ST, Podzielinski I, et al. Ten-year relative survival for epithelial ovarian cancer. Obstetrics and gynecology. 2012; 120(3):612–8. doi:10.1097/AOG. 0b013e318264f794PMID:22914471.
2. Bookman MA. Developmental Chemotherapy and Management of Recurrent Ovarian Cancer. Journal Clinical Oncology. 2003; 21:149s–67s.
3. Ross J, Romero I, Bast RCJ. Minireview: human ovarian cancer: biology, current management, and paths to personalizing therapy. Endocrinology. 2012; 153(4):1593–602. Epub 2012/03/15. doi:10. 1210/en.2011-2123
4. Siddik ZH. Cisplatin: mode of cytotoxic action and molecular basis of resistance. Oncogene. 2003; 22 (47):7265–79. Epub 2003/10/25. doi:10.1038/sj.onc.1206933PMID:14576837.
5. Galluzzi L, Senovilla L, Vitale I, Michels J, Martins I, Kepp O, et al. Molecular mechanisms of cisplatin resistance. Oncogene. 2012; 31(15):1869–83. Epub 2011/09/06. doi:10.1038/onc.2011.384PMID: 21892204.
6. Galluzzi L, Vitale I, Michels J, Brenner C, Szabadkai G, Harel-Bellan A, et al. Systems biology of cis-platin resistance: past, present and future. Cell death & disease. 2014; 5:e1257. doi:10.1038/cddis. 2013.428PMID:24874729; PubMed Central PMCID: PMCPMC4047912.
7. Lengyel E, Burdette JE, Kenny HA, Matei D, Pilrose J, Haluska P, et al. Epithelial ovarian cancer exper-imental models. Oncogene. 2014; 33(28):3619–33. doi:10.1038/onc.2013.321PMID:23934194; PubMed Central PMCID: PMCPMC3990646.
8. Napolitano AP, Dean DM, Man AJ, Youssef J, Ho DN, Rago AP, et al. Scaffold-free three-dimensional cell culture utilizing micromolded nonadhesive hydrogels. Biotechniques. 2007; 43(4):494–6–500. Epub 2007/11/21. PMID:18019341.
9. Ma L, Lai D, Liu T, Cheng W, Guo L. Cancer stem-like cells can be isolated with drug selection in human ovarian cancer cell line SKOV3. Acta biochimica et biophysica Sinica. 2010; 42(9):593–602. doi:10.1093/abbs/gmq067PMID:20705681.
10. Domcke S, Sinha R, Levine DA, Sander C, Schultz N. Evaluating cell lines as tumour models by com-parison of genomic profiles. Nature communications. 2013; 4:2126. doi:10.1038/ncomms3126PMID: 23839242; PubMed Central PMCID: PMCPMC3715866.
11. Wang L, Mezencev R, Bowen NJ, Matyunina LV, McDonald JF. Isolation and characterization of stem-like cells from a human ovarian cancer cell line. Mol Cell Biochem. 2012; 363(1–2):257–68. doi:10. 1007/s11010-011-1178-6PMID:22160925.
12. Rago AP, Chai PR, Morgan JR. Encapsulated arrays of self-assembled microtissues: an alternative to spherical microcapsules. Tissue Eng Part A. 2009; 15(2):387–95. doi:10.1089/ten.tea.2008.0107 PMID:19193131.
13. Vang S, Wu H-T, Fischer A, Miller DH, MacLaughlan S, Douglass E, et al. Identification of ovarian can-cer metastatic miRNAs. PloS one. 2013; 8(3):e58226. doi:10.1371/journal.pone.0058226PMID: 23554878; PubMed Central PMCID: PMCPMC3595263.
15. Beck A, Knoblauch N, Hefti M, Kaplan J, Schnitt S, Culhane A, et al. Data from: Significance Analysis of Prognostic Signatures. Dryad Digital Repository 2013. Available:http://dx.doi.org/10.5061/dryad. mk471.
16. Gould J. GENE-E website 2016. Available:http://www.broadinstitute.org/cancer/software/GENE-E/ index.html.
17. Storey JD, Tibshirani R. Statistical significance for genomewide studies. Proceedings of the National Academy of Sciences of the United States of America. 2003; 100(16):9440–5. Epub 2003/07/29. doi: 10.1073/pnas.1530509100PMID:12883005; PubMed Central PMCID: PMCPMC170937.
18. Irizarry RA, Irizarry RA, Hobbs B, Hobbs B, Collin F, Collin F, et al. Exploration, normalization, and sum-maries of high density oligonucleotide array probe level data. Biostatistics. 2003; 4(2):249–64. Epub 2003/08/20. doi:10.1093/biostatistics/4.2.249PMID:12925520.
19. Debernardis D, Sire EG, De Feudis P, Vikhanskaya F, Valenti M, Russo P, et al. p53 status does not affect sensitivity of human ovarian cancer cell lines to paclitaxel. Cancer research. 1997; 57(5):870–4. PMID:9041188.
20. Mitra AK, Davis DA, Tomar S, Roy L, Gurler H, Xie J, et al. In vivo tumor growth of high-grade serous ovarian cancer cell lines. Gynecologic oncology. 2015; 138(2):372–7. doi:10.1016/j.ygyno.2015.05. 040PMID:26050922; PubMed Central PMCID: PMCPMC4528621.
21. Schilder RJ, Hall L, Monks A, Handel LM, Fornace AJ Jr., Ozols RF, et al. Metallothionein gene expres-sion and resistance to cisplatin in human ovarian cancer. International journal of cancer Journal interna-tional du cancer. 1990; 45(3):416–22. PMID:2307530.
22. Shield K, Ackland ML, Ahmed N, Rice GE. Multicellular spheroids in ovarian cancer metastases: Biol-ogy and patholBiol-ogy. Gynecologic oncolBiol-ogy. 2009; 113(1):143–8. Epub 2009/01/13. doi:10.1016/j. ygyno.2008.11.032PMID:19135710.
23. Ween MP, Armstrong MA, Oehler MK, Ricciardelli C. The role of ABC transporters in ovarian cancer progression and chemoresistance. Critical reviews in oncology/hematology. 2015; 96(2):220–56. doi: 10.1016/j.critrevonc.2015.05.012PMID:26100653.
24. Song IS, Savaraj N, Siddik ZH, Liu P, Wei Y, Wu CJ, et al. Role of human copper transporter Ctr1 in the transport of platinum-based antitumor agents in cisplatin-sensitive and cisplatin-resistant cells. Molecu-lar cancer therapeutics. 2004; 3(12):1543–9. PMID:15634647.
25. Samimi G, Safaei R, Katano K, Holzer AK, Rochdi M, Tomioka M, et al. Increased expression of the copper efflux transporter ATP7A mediates resistance to cisplatin, carboplatin, and oxaliplatin in ovarian cancer cells. Clinical cancer research: an official journal of the American Association for Cancer Research. 2004; 10(14):4661–9. doi:10.1158/1078-0432.CCR-04-0137PMID:15269138.
26. Kamazawa S, Kigawa J, Minagawa Y, Itamochi H, Shimada M, Takahashi M, et al. Cellular efflux pump and interaction between cisplatin and paclitaxel in ovarian cancer cells. Oncology. 2000; 59(4):329–35. 12191. PMID:11096346.
27. Overbeck TR, Hupfeld T, Krause D, Waldmann-Beushausen R, Chapuy B, Guldenzoph B, et al. Intra-cellular ATP-binding cassette transporter A3 is expressed in lung cancer cells and modulates suscepti-bility to cisplatin and paclitaxel. Oncology. 2013; 84(6):362–70. doi:10.1159/000348884PMID: 23689165.
28. Subramanian A, Tamayo P, Mootha VK, Mukherjee S, Ebert BL, Gillette MA, et al. Gene set enrichment analysis: a knowledge-based approach for interpreting genome-wide expression profiles. Proceedings of the National Academy of Sciences of the United States of America. 2005; 102(43):15545–50. doi: 10.1073/pnas.0506580102PMID:16199517; PubMed Central PMCID: PMC1239896.
29. Kang J, D’Andrea AD, Kozono D. A DNA repair pathway-focused score for prediction of outcomes in ovarian cancer treated with platinum-based chemotherapy. Journal of the National Cancer Institute. 2012; 104(9):670–81. Epub 2012/04/17. doi:10.1093/jnci/djs177PMID:22505474.
30. Nevedomskaya E, Perryman R, Solanki S, Syed N, Mayboroda OA, Keun HC. A Systems Oncology Approach Identifies NT5E as a Key Metabolic Regulator in Tumor Cells and Modulator of Platinum Sen-sitivity. Journal of proteome research. 2015. doi:10.1021/acs.jproteome.5b00793PMID:26629888. 31. Taube JH, Herschkowitz JI, Komurov K, Zhou AY, Gupta S, Yang J, et al. Core
epithelial-to-mesenchy-mal transition interactome gene-expression signature is associated with claudin-low and metaplastic breast cancer subtypes. Proceedings of the National Academy of Sciences of the United States of America. 2010; 107(35):15449–54. doi:10.1073/pnas.1004900107PMID:20713713; PubMed Central PMCID: PMC2932589.
32. Marchini S, Fruscio R, Clivio L, Beltrame L, Porcu L, Fuso Nerini I, et al. Resistance to platinum-based chemotherapy is associated with epithelial to mesenchymal transition in epithelial ovarian cancer. Eur J Cancer. 2013; 49(2):520–30. doi:10.1016/j.ejca.2012.06.026PMID:22897840.
investigation. 2014; 124(6):2611–25. doi:10.1172/JCI69815PMID:24762435; PubMed Central PMCID: PMC4038562.
34. Moroishi T, Hansen CG, Guan KL. The emerging roles of YAP and TAZ in cancer. Nature reviews Can-cer. 2015; 15(2):73–9. doi:10.1038/nrc3876PMID:25592648.
35. Zhang J, Smolen GA, Haber DA. Negative regulation of YAP by LATS1 underscores evolutionary con-servation of the Drosophila Hippo pathway. Cancer research. 2008; 68(8):2789–94. doi: 10.1158/0008-5472.CAN-07-6205PMID:18413746.
36. Hall CA, Wang R, Miao J, Oliva E, Shen X, Wheeler T, et al. Hippo pathway effector Yap is an ovarian cancer oncogene. Cancer research. 2010; 70(21):8517–25. doi:10.1158/0008-5472.CAN-10-1242 PMID:20947521; PubMed Central PMCID: PMC2970655.
37. Shao DD, Xue W, Krall EB, Bhutkar A, Piccioni F, Wang X, et al. KRAS and YAP1 converge to regulate EMT and tumor survival. Cell. 2014; 158(1):171–84. doi:10.1016/j.cell.2014.06.004PMID:24954536; PubMed Central PMCID: PMCPMC4110062.
38. Lee KW, Lee SS, Kim SB, Sohn BH, Lee HS, Jang HJ, et al. Significant association of oncogene YAP1 with poor prognosis and cetuximab resistance in colorectal cancer patients. Clinical cancer research: an official journal of the American Association for Cancer Research. 2015; 21(2):357–64. doi:10.1158/ 1078-0432.CCR-14-1374PMID:25388162.
39. Beck AH, Knoblauch NW, Hefti MM, Kaplan J, Schnitt SJ, Culhane AC, et al. Significance analysis of prognostic signatures. PLoS Comput Biol. 2013; 9(1):e1002875. doi:10.1371/journal.pcbi.1002875 PMID:23365551; PubMed Central PMCID: PMC3554539.
40. Bentink S, Haibe-Kains B, Risch T, Fan JB, Hirsch MS, Holton K, et al. Angiogenic mRNA and micro-RNA gene expression signature predicts a novel subtype of serous ovarian cancer. PloS one. 2012; 7 (2):e30269. doi:10.1371/journal.pone.0030269PMID:22348002; PubMed Central PMCID:
PMC3278409.
41. Godwin AK, Meister A, O'Dwyer PJ, Huang CS, Hamilton TC, Anderson ME. High resistance to cis-platin in human ovarian cancer cell lines is associated with marked increase of glutathione synthesis. Proceedings of the National Academy of Sciences of the United States of America. 1992; 89(7):3070– 4. PMID:1348364; PubMed Central PMCID: PMCPMC48805.
42. Li M, Balch C, Montgomery JS, Jeong M, Chung JH, Yan P, et al. Integrated analysis of DNA methyla-tion and gene expression reveals specific signaling pathways associated with platinum resistance in ovarian cancer. BMC medical genomics. 2009; 2:34. doi:10.1186/1755-8794-2-34PMID:19505326; PubMed Central PMCID: PMCPMC2712480.
43. Zeller C, Dai W, Steele NL, Siddiq A, Walley AJ, Wilhelm-Benartzi CS, et al. Candidate DNA methyla-tion drivers of acquired cisplatin resistance in ovarian cancer identified by methylome and expression profiling. Oncogene. 2012; 31(42):4567–76. doi:10.1038/onc.2011.611PMID:22249249.
44. Ke W, Yu P, Wang J, Wang R, Guo C, Zhou L, et al. MCF-7/ADR cells (re-designated NCI/ADR-RES) are not derived from MCF-7 breast cancer cells: a loss for breast cancer multidrug-resistant research. Medical oncology. 2011; 28 Suppl 1:S135–41. doi:10.1007/s12032-010-9747-1PMID:21116879. 45. Gupta N, Gupta N, Xu Z, Xu Z, El-Sehemy A, El-Sehemy A, et al. Notch3 induces
epithelial-mesenchy-mal transition and attenuates carboplatin-induced apoptosis in ovarian cancer cells. Gynecologic oncology. 2013; 130(1):200–6.
46. Yang D, Sun Y, Hu L, Zheng H, Ji P, Pecot CV, et al. Integrated analyses identify a master microRNA regulatory network for the mesenchymal subtype in serous ovarian cancer. Cancer cell. 2013; 23 (2):186–99. doi:10.1016/j.ccr.2012.12.020PMID:23410973; PubMed Central PMCID: PMC3603369. 47. Huang RY, Wong MK, Tan TZ, Kuay KT, Ng AH, Chung VY, et al. An EMT spectrum defines an
anoi-kis-resistant and spheroidogenic intermediate mesenchymal state that is sensitive to e-cadherin resto-ration by a src-kinase inhibitor, saracatinib (AZD0530). Cell death & disease. 2013; 4:e915. doi:10. 1038/cddis.2013.442PMID:24201814; PubMed Central PMCID: PMCPMC3847320.
48. Zeisberg M, Neilson EG. Biomarkers for epithelial-mesenchymal transitions. The Journal of clinical investigation. 2009; 119(6):1429–37. doi:10.1172/JCI36183PMID:19487819; PubMed Central PMCID: PMCPMC2689132.