DOI: http://dx.doi.org/10.5007/1980-0037.2012v14n3p243
original article
RBCDH
Licence Creative Commom CC BY1 Federal University of Santa Cata-rina, Laboratory of Biomechanics, Florianópolis, SC, Brazil
2 University of Texas at Austin. Human Performance Laboratory. Austin, TX. USA
3 Auckland University of Techno-logy, Sport Performance Research Institute. School of Sport and Recreation. Auckland, AKL. New Zealand
4 Exercise Research Laboratory, School of Physical Education, Federal University of Rio Grande do Sul, Porto Alegre, Brazil
Received: 04 July 2011 Accepted: 26 January 2012
Frequency band analysis of muscle
activation during cycling to exhaustion
Análise da ativação muscular durante a pedalada até a
exaustão utilizando bandas de frequência
Fernando Diefenthaeler1,2
Rodrigo Rico Bini3
Marco Aurélio Vaz4
Abstract – Lower limb muscles activation was assessed during cycling to exhaustion using frequency band analysis. Nine cyclists were evaluated in two days. On the irst day, cyclists performed a maximal incremental cycling exercise to measure peak power output, which was used on the second day to deine the workload for a constant load time to exhaustion cycling exercise (maximal aerobic power output from day 1). Muscle activation of vastus lateralis (VL), long head of biceps femoris (BF), lateral head of gastrocnemius (GL), and tibialis anterior (TA) from the right lower limb was recorded during the time to exhaus-tion cycling exercise. A series of nine band-pass Butterworth digital ilters was used to analyze muscle activity amplitude for each band. he overall amplitude of activation and the high and low frequency components were deined to assess the magnitude of fatigue efects on muscle activity via efect sizes. he proile of the overall muscle activation during the test was analyzed using a second order polynomial, and the variability of the overall bands was analyzed by the coeicient of variation for each muscle in each instant of the test. Substantial reduction in the high frequency components of VL and BF activation was observed. he overall and low frequency bands presented trivial to small changes for all muscles. High relationship between the second order polynomial itting and muscle activity was found (R2 > 0.89) for all muscles. High variability (~25%) was found for muscle activation at the four instants of the fatigue test. Changes in the spectral properties of the EMG signal were only substantial when extreme changes in fatigue state were induced.
Key words: Electromyography; Fatigue; Frequency analysis.
Resumo– A ativação dos músculos do membro inferior foi avaliada durante a pedalada até a exaustão utilizando bandas de frequência. Nove ciclistas foram avaliados em dois dias. No primeiro dia, os ciclistas realizaram um teste de carga incremental para a determinação da máxima potência aeróbia, sendo esta utilizada como carga de trabalho para o teste de carga constante até a exaustão durante o segundo dia de avaliações. Foi adquirida durante o teste de carga constante a ativação dos músculos vastus lateralis (VL), porção longa do biceps femoris (BF), porção lateral do gastrocnemius (GL), e tibialis anterior (TA) do mem-bro inferior direito. Uma série de nove iltros digitais do tipo passa-banda Butterworth foi utilizada para a determinação da amplitude do sinal obtido de cada banda de frequência. As ativações musculares oriundas das nove bandas, das bandas de alta frequência e das bandas de baixa frequência foram deinidas para a análise dos efeitos da fadiga muscular por meio da magnitude das alterações. O padrão da ativação global das nove bandas durante o teste de carga constante foi determinado utilizando um polinômio de segunda ordem, enquanto a variabilidade da ativação foi avaliada por meio do coeiciente de variação. Reduções substanciais nas bandas de alta frequência foram observadas para os músculos VL e BF ao longo do teste. A ativação das nove bandas e das bandas de baixa frequência apresentou alterações triviais. Uma elevada capacidade preditiva do padrão de ativação muscular foi observada utilizando o polinômio de segunda ordem (R2 > 0,89). Uma elevada variabilidade
INTRODUCTION
Fatigue has been deined from diferent perspectives. Abbiss and Laursen1
deined fatigue as the sensation of tiredness associated with decrements in muscular performance. Changes in fatigue state in endurance cycling performance are not fully understood because fatigue involves the inter-action of various physiological systems1. Neuromechanical adaptation to
diferent fatigue states in cycling has been observed via changes in pedal force application2, joint kinematics3, and joint kinetics4. However, the link
between changes in joint kinetics and kinematics observed in previous studies and muscle activation is conlicting.
Endurance cycling performance has been related to higher aerobic power production, which mostly depends on the contribution of energy resources from Type I ibers5. Moreover, potential increases in motor unit
recruitment resulted in higher oxygen uptake6, lower pedaling cadence7,
and higher pedal force3 during fatigue in cycling. It has been hypothesized
that a reduction on the percentage of high frequency motor unit recruit-ment results in lower frequency spectrum of surface electromyograms8.
However, evidence of additional recruitment of less eicient high frequency motor units was not provided by previous research9. Controversial
evi-dence has been shown in muscle recruitment priority and its efects on electromyography spectral properties during fatigue10-12. herefore, it is
not clear whether changes in fatigue state do not afect muscle recruitment or whether changes in muscle activation are not detectable using surface electromyography.
Most research on cycling using electromyography to detect muscle fatigue had focus on amplitude analysis of the overall activation13,14.
Am-plitude analysis of muscle activation is usually conducted using low pass ilters or root mean square (RMS) analysis. Both options reduce the high spectral properties of the muscle activation signal because they attenuate fast changes in muscle activation from iltering or averaging (in the case of RMS), which minimizes the efects of fatigue on higher spectral changes15.
he partition of the activation signal into diferent frequency bands has been done using continuous15,16 and discrete wavelets17, because the spectral
analysis of the activation signal using the traditional fast Fourier transform may not be appropriate during dynamic contractions14. hese methods are
based on the assumption that shits in the spectral properties of the signal (e.g. lower overall power spectrum) are linked to changes in the motor unit recruitment priority (e.g. higher contribution of low frequency motor units)18. However, only von Tscharner16 provided evidence of changes in
spectral analysis of the gastrocnemius medialis and vastus lateralis muscles during a “mild” fatigue cycling exercise. Increases in intensity of low fre-quency components of vastus lateralis activation (<100 Hz) and moderate frequency components of gastrocnemius medialis activation (60-240 Hz) were related to a greater recruitment of slow motor units15. herefore, it is
muscle activation during cycling and if it is possible to detect changes in muscle recruitment based on the analysis of spectral properties of surface electromyographic signals.
To analyze how much fatigue state during cycling to exhaustion af-fected the activation of lower limb muscles, we compared the magnitude of changes in muscle activation through frequency band analysis. A series of band-pass Butterworth ilters were used for the analysis of the signal amplitude in diferent frequency bands. We hypothesized that, towards the end of the cycling test, cyclists would present greater contribution of the low frequency components of lower limb muscle activation. he reason for this hypothesis is based on the potential overall increase in the number of small and medium size motor units and a decrease in large size motor units, following the proposed fatigue mechanism described by De Luca8.
METHODS
Subjects
Nine competitive cyclists (elite/category 1 riders according to Ansley and Cangley19) volunteered to participate in this study. All participants signed
an Informed Consent Term in agreement with the Committee of Ethics in Research with Humans of the University of Texas at Austin (protocol # 2005-08-0035). he cyclists were asked to avoid high-intensity or exhaus-tive exercise at least 24 hours before the laboratory trials. he mean and standard deviation values for age, body mass, maximal oxygen uptake (VO2MAX), peak power output, and power/mass ratio of the subjects were 31.0 ± 7.0 years, 74.1 ± 7.6 kg, 61 ± 4.7 ml.kg-1.min-1, 424 ± 36 W, and 5.75
± 0.46 W.kg-1, respectively.
Protocol
All tests were performed on a stationary cycle ergometer Lode Excalibur Sport V2.0 (Groningen, he Netherlands) adapted with drop handlebars, clipless pedals, and a racing saddle. Cycle ergometer dimensions replicated cyclists’ bicycle coniguration for saddle height and horizontal position and vertical and horizontal position of the handlebars. During the pro-tocol, oxygen uptake and carbon dioxide produced were measured using an open-circuit indirect gas exchange system Physiodyne FLO-1B System (Physio-Dyne Instrument Corp., New York, USA). Heart rate was continu-ously assessed from a telemetric monitor (Polar Electro Oy S610, Finland). During the irst evaluation session, baseline measurements (e.g. body mass and height) were conducted. Ater that, cyclists performed a sub-maximal test to estimate the workload related to 90% of their predicted maximal heart rate20. he initial workload was set for the cyclists to achieve
between heart rate and power output. A maximal incremental cycling test was then conducted with an initial workload of 60% of the power output of the maximal predicted heart rate for four minutes and was increased to 75%, 90% and 100% every two minutes. If the cyclist had not achieved VO2MAX at the 100% stage of the incremental cycling, the workload was increased 5% every minute until voluntary exhaustion. Cyclists were instructed to keep their pedaling cadence stable during the whole test (~90 rpm) using visual feedback from the screen of the bicycle ergometer.
Ater 48 hours, cyclists returned to the laboratory for a second evalu-ation session. In this session, they performed a time to exhaustion cycling exercise at constant load on the same cycle ergometer from the irst session using the same coniguration from the irst session. Power output was set at the maximal power output measured during the irst evaluation session and the cyclists were instructed to maintain the pedaling cadence close to 90 rpm until volitional exhaustion.
Data acquisition
Surface electromyography (EMG) was used to measure muscle activity from vastus lateralis (VL), long head of biceps femoris (BF), lateral head of gastrocnemius (GL), and tibialis anterior (TA) muscles from the right lower limb during the test. Bipolar single diferential surface EMG sensors (99.9% Ag, 10 mm x 1 mm, 10 mm spaced apart; Delsys DE-2.1, Delsys Inc., USA) were used to obtain the EMG signals. he electrodes were positioned on the skin ater careful shaving and cleaning of the area, using an abrasive cleaner and alcohol swabs to reduce skin impedance, in accordance to the International Society of Electromyography and Kinesiology21. EMG sensors
were placed one third of the muscle length from the midpoint (to avoid the musculotendinous junction) longitudinally over the belly of the muscles in the approximate ibers direction. To minimize movement artifacts, elec-trode cables were taped to the skin. EMG signals were collected employing a Delsys Bagnoli electromyography system and the sotware EMGworks system 3.5 (Delsys Inc., USA) at a sampling rate of 1080 Hz per channel and ampliied with a gain of 1 K.
One relective marker attached to the pedal axis was measured using a six-camera infrared Vicon system (Oxford Metrics, England) at 120 Hz, with markers attached to the pedal axis and crank axis. EMG and kinematic data were synchronized by an internal trigger from the Vicon 612 analog-to-digital system (Oxford Metrics, England). Only data from horizontal and vertical displacement of pedal axis was exported for further analysis.
Data analysis
continuous wavelets described elsewhere16 were adapted to the discrete
analysis of band-pass iltering, and are shown in Table 1.
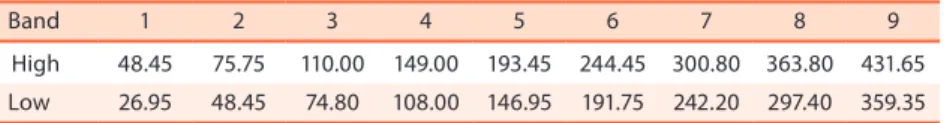
Table 1. Nine frequency bands selected from previous continuous wavelet model21 used on the series of band-pass digital iltering of EMG signals of each muscle. The high and low frequency parameters were used for the band stop of the Butterworth ilter.
Band 1 2 3 4 5 6 7 8 9
High 48.45 75.75 110.00 149.00 193.45 244.45 300.80 363.80 431.65 Low 26.95 48.45 74.80 108.00 146.95 191.75 242.20 297.40 359.35
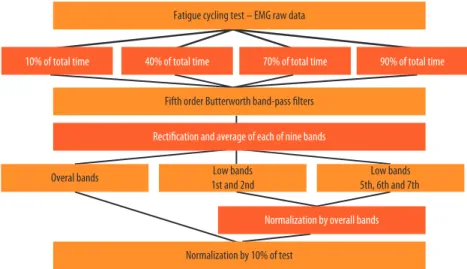
Each muscle’s EMG signal was iltered using each of the nine combina-tions of high and low band stop (frequency bands). EMG signals of each of the nine frequency bands that resulted from the iltering process were then rectiied, and separated into ten revolutions of the crank. he highest vertical displacement of the relective marker attached to the pedal axis was used to deine the transition between each pedal revolution and applied to compute averages of EMG signals of each revolution for each respective frequency band. he result of this process was nine average amplitude values for each frequency band per muscle per time-window. he sum of the nine average frequency bands was calculated for the analysis of the overall activation of each muscle (i.e. activation of all frequency bands of the EMG signal). he ith, sixth and seventh bands were averaged to compute the high frequency components of the signals, which would po-tentially represent the response of greater motor units15. he irst and the
second bands were averaged to compute the low frequency components of the signals, which would represent the response of smaller motor units15.
he high and low frequency pairs and the overall muscle activation were then normalized by their individual responses at the 10% of the test, where fatigue would be expected to be minimal. he overall, high and low values of the 40%, 70% and 90% of the test were then normalized by their results at the 10% of the test. his second normalization by the 10% of the test aimed between-subjects comparison, because the cyclists were expected not to be fatigued at the 10% of the test. he overview of signal processing and EMG data analysis is shown in Figure 1.
Statistical analysis
Data were averaged for the nine cyclists for the overall, high and low fre-quency bands. Each pair of time-window (i.e. 10 vs. 40%, 10 vs. 70%, and so on) was compared using efect sizes as described by Rhea22. Six pairs of
comparison were done between the four instants of the test (i.e. average of 10% – average of 40%/pooled standard deviation) and averaged for the overall, high and low frequency bands for each muscle. he average of the efect sizes of the six pairs of comparison for each variable (overall, high and low bands) and for each muscle were then scaled for trivial (<0.25), small (0.25 - 0.50), moderate (>0.50 - 1.0) or large efects (>1.0)22. We chose
Figure 1. Flow diagram of the EMG signal processing.
he proile of the overall muscle activation during the test was analyzed itting a second order polynomial to assess whether mean activation would increase or decrease. Variability of the overall bands was computed by the coeicient of variation for each muscle in each instant of the test.
RESULTS
Time to exhaustion performance was 405 ±81 s, maximal oxygen uptake was 61 ±5 ml.kg-1.min-1, power output was 424 ±36 W, and maximal heart
rate was 184 ±11 bpm.
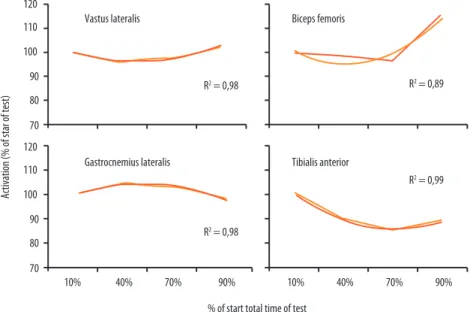
he proile of the four muscles activation was itted by a second order polynomial and the results are presented in Figure 2. All polynomial it-ting resulted in high prediction of the data with worst results for the BF.
A comparison of each time-window of the test indicated large decreases in VL and BF high frequency component at the 90% of the test compared to the 10% of the test. All other muscles and comparisons did not result in large diferences (see Table 2).
Between-subjects variability in muscle activation for the four muscles in each instant of the test is shown in Figure 3. High levels of variability were found for all four muscles, with coeicients of variation up to 43% for VL, 28% for BF, 30% for GL, and 48% for TA, respectively.
Figure 2. Average data of the overall muscle activation normalized by the 10% of total time of the test. Polynomial itting proile of the vastus lateralis, biceps femoris, gastrocnemius lateralis, and tibialis anterior. Strength of the relationship between the predicted values and the mean results indicated by R2.
Table 2. Efects sizes of the overall, high frequency (HF) and low frequency (LF) bands of vastus lateralis (VL), biceps femoris (BF), gastrocnemius lateralis (GL), and tibialis anterior (TA) during the test.
VL (%dif; ES, magnitude)
BF (%dif; ES, magnitude)
GL (%dif; ES, magnitude)
TA (%dif; ES, magnitude) 10% vs. 40%
Overall ß4%; 0.2, T ß2%; 0.1, T Ý5%; 0.2, T ß10%; 0.4, S HF ß6%; 0.6, M ß6%; 0.9, M ß4%; 0.5, M ß1%; 0.2, T LF Ý2%; 0.2, T Ý6%; 0.7, M Ý11%; 0.9, M Ý4%; 0.5, M 10% vs. 70%
Overall ß37%; 0.1, T ß27%; 0.1, T Ý31%; 0.1, T ß19%; 0.8, M HF ß18%; 0.5, M ß11%; 0.6, M ß12%; 0.3, S ß12%; 0.3, S LF ß16%; 0.1, T Ý11%; 0.7, M Ý17%; 0.7, M Ý24%; 0.4, S 10% vs. 90%
Overall Ý43%; 0.1, T Ý26%; 0.5, M ß15%; 0.1, T ß48%; 0.3, S HF ß15%; 1.0, L ß8%; 1.2, L ß12%; 0.5, M ß17%; 0.2, T LF Ý12%; 0.3, S Ý14%; 0.7, M Ý14%; 0.9, M Ý21%; 0.5, M 40% vs. 70%
Overall Ý2%; 0.1, T ß2%; 0.1, T ß1%; 0.1, T ß4%; 0.2, T HF ß3%; 0.1, T Ý1%; 0.1, T Ý1%; 0.1, T ß2%; 0.2, T LF ß4%; 0.3, S Ý2%; 0.2; T Ý1%; 0.1, T Ý6%; 0.2, T 40% vs. 90%
Overall Ý23%; 0.1, T Ý6%; 0.6, M ß16%; 0.4, S ß16%; 0.1, T HF ß3%; 0.4, S ß1%; 0.4, S ß3%; 0.1, T ß9%; 0.1, T LF Ý2%; 0.1, T Ý8%; 0.4, S Ý4%; 0.2, T Ý14%; 0.4, S 70% vs. 90%
Overall Ý5%; 0.1, T Ý19%; 0.6, M ß5%; 0.3, S Ý3%; 0.1, T HF ß4%; 0.3, S ß2%; 0.3, S ß2%; 0.2, T Ý1%; 0.1, T LF Ý6%; 0.4, S Ý3%; 0.2, T Ý2%; 0.1, T Ý2%; 0.1, T
DISCUSSION
Highly trained cyclists were evaluated in our study using a time to exhaus-tion cycling exercise test with constant load to induce high levels of fatigue. he analysis of four muscles related to power production during cycling was conducted and substantial declines were observed in high frequency bands for VL and BF comparing the 10% to the 90% of the test. No sub-stantial changes were observed for other muscles or between diferent time instants of the test.
Previous research described the efects of fatigue on physiological (e.g. heart rate6) and biomechanical variables (e.g. joint kinematics3), without
attention to the frequency components of muscle activation signals. Only one study reported changes in the spectral properties of the VL muscle, suggesting higher recruitment of small motor units during a “mild” fa-tigue cycling exercise in non-cyclists16. Diferent from previous studies,
our results indicate either (1) a reduction in greater motor units instead of a higher activation of small motor units due to any substantial changes in low frequency components or (2) a decrease in the frequency of activation of large motor units with fatigue. herefore, our results indicate that the high frequency component of VL and BF activation can be sensitive to changes in fatigue state.
During cycling to fatigue, higher VL and GL and unchanged BF RMS values were observed in one study14, diferent from the unafected RMS
values found for VL and GL and reduced RMS values for TA24. he RMS
is an analog of the overall muscle activation computed in our study, which does not indicate whether changes in muscle activation are related to combined or isolated changes in each frequency component. If the high frequency component increases to the same extent of the decrease in the low frequency components, the RMS (and overall muscle activation) would not be afected. herefore, the analysis of frequency contents of muscle activation is a better approach to determine the efects of fatigue in cycling.
he analysis of EMG signals in terms of high and low frequency com-ponents was previously used in isometric fatiguing tasks and revealed either a reduction25 or no changes in mean frequency26. In a previous study,
a reduction in EMG signal amplitude was observed using continuous wavelets to measure the time related to changes in the frequency content of the EMG signals during a mild fatigue cycling exercise16. In our study,
patterns of VL and BF observed in trained cyclists (push and pull actions during downstroke and upstroke phases, respectively).
Changes in the spectral properties of EMG signals have been theo-retically related to changes in the conduction velocity of muscle ibers8.
However, controversial evidence has been provided, as Macdonald et al.14
reported no signiicant changes in muscle iber conduction velocity with fatigue, and several studies questioned if changes in muscle iber conduc-tion velocity could afect the spectral properties of the EMG signals10-12.
he results of our study indicated that the efects of exhaustive fatiguing exercise on the frequency content of dynamic muscle activation may be in line with previous studies suggesting changes in muscle activation conduction velocity16,24. However, the comparison of a minimum fatigue
state (10% of the test) to a maximal fatigue state (90% of the test) was the only one that resulted in a reduction on the high frequency components of muscle activation. Due to limitations of surface EMG (e.g. movement of the muscle in relation to the electrodes during dynamic exercise, muscle temperature efects in signal frequency components), only large changes in fatigue state may be detectable.
he pattern of muscle activation was itted by a polynomial function with high relationship between the predicted and the mean overall re-sults. he increase of BF overall activation and the decline in TA overall activation with fatigue were consistent with previous indings24. However,
the variability measured by the coeicient of variation of the results has been rarely explored. When looking at the coeicient of variation, we could observe high variability for the overall muscle activation (up to 43% for VL at 90% of the test), indicating that neuromuscular adaptation to fatigue may occur and it is probably more complex than expected and potentially individually determined. Hug et al.27 presented similar results
for the variability of RMS values of more than 50% for TA, almost 50% for GL, more than 30% for BF and almost 30% for VL during steady state sub-maximal cycling. Taken together, these results highlight the fact that high between-subjects variability in muscle activation may compromise inferential statistical analysis of the EMG signals from surface EMG. One possible explanation is that muscle coordination may vary among diferent cyclists, increasing the variation in muscle activation for between-cyclists analysis. Another possibility is that subjects use diferent neuromuscular strategies while activating their muscles. In addition, changes in motor unit recruitment and in iring rates of motor units already recruited may result in high variability in the proile, amplitude of activation and frequency content of the EMG signals between subjects.
he limitations of the present study were mostly related to the previ-ously described limitations of surface EMG recording (i.e. adipose tissue iltering efects in EMG signals, cross-talking recordings from nearby muscles, muscle temperature efects in signal frequency components)8.
temperature, synchronization and non-stationary behavior of EMG signal may mask the real efects of fatigue28. As previously reported, during
dy-namic exercise the efects of fatigue on muscle iber conduction velocity are unlikely to be tracked using bipolar surface EMG29. Multi-polar arrays
of electrodes have been shown to be more reliable to detect fatigue efects on muscle activation30.
CONCLUSION
Substantial reduction in high frequency components of VL and BF activa-tion were observed during an exhaustive exercise in highly trained cyclists. Changes in the spectral properties of EMG signals were only substantial when extreme changes in fatigue state were induced.
ACKNOWLEDGMENTS
he authors would like to thank CNPq and Capes-Brazil for inancial support.
REFERENCES
1. Abbiss CR, Laursen PB. Models to explain fatigue during prolonged endurance cycling. Sports Med 2005;35(10):865-98.
2. Diefenthaeler F, Coyle EF, Bini RR, Carpes FP, Vaz MA. Muscle activity and pedal force proile of triathletes during cycling to exhaustion. Sports Biomech. 2012;11(1):10-9.
3. Sanderson DJ, Black A. he efect of prolonged cycling on pedal forces. J Sports Sci 2003;21(3):191-9.
4. Martin JC, Brown NAT. Joint-speciic power production and fatigue during maxi-mal cycling. J Biomech 2009;42(4):474-9.
5. Coyle EF, Feltner ME, Kautz SA, Hamilton MT, Montain SJ, Baylor AM, et al. Physiological and biomechanical factors associated with elite endurance cycling performance. Med Sci Sports Exerc 1991;23(1):93-107.
6. Lajoie C, Laurencelle L, Trudeau F. Physiological responses to cycling for 60 minutes at maximal lactate steady state. Can J Appl Physiol 2000;25(4):250-61.
7. Lepers R, Maiuletti NA, Rochette L, Brugniaux J, Millet GY. Neuromuscular fatigue during a long-duration cycling exercise. J Appl Physiol 2002;92(4):1487-93.
8. De Luca CJ. he use of surface electromyography in biomechanics. J Appl Biomech 1997;13(2):135-63.
9. Cannon DT, Kolkhorst FW, Cipriani DJ. Electromyographic data do not support a progressive recruitment of muscle ibers during exercise exhibiting a VO2 slow component. J Physiol Anthropol 2007;26(5):541-6.
10. Von Tscharner V, Nigg BM, Farina D. Spectral properties of the surface EMG can characterize/do not provide information about motor unit recruitment strategies and muscle iber type. J Appl Physiol 2008;105(5):1671-4.
11. Von Tscharner V, Nigg BM. Last Word on Point:Counterpoint: Spectral proper-ties of the surface EMG can characterize/do not provide information about motor unit recruitment strategies and muscle iber type. J Appl Physiol 2008;105(5):1682.
12. Rainoldi A. Point:Counterpoint: Spectral properties of the surface EMG can char-acterize/do not provide information about motor unit recruitment strategies and muscle iber type. J Appl Physiol 2008;105(5):1678.
Address for Correspondence
Fernando Diefenthaeler Universidade Federal de Santa Catarina – Campus Universitário Trindade, Centro de Desportos, Laboratório de Biomecânica, Florianópolis SC, Brasil – 88040-970. E-mail: fernando.diefenthaeler@ ufsc.br
14. Macdonald JH, Farina D, Marcora SM. Response of electromyographic variables during incremental and fatiguing cycling. Med Sci Sports Exerc 2008;40(2):335-44.
15. Wakeling JM, Horn T. Neuromechanics of muscle synergies during cycling. J Neurophysiol 2009;101(2):843-54.
16. Von Tscharner V. Time-frequency and principal-component methods for the analysis of EMGs recorded during a mildly fatiguing exercise on a cycle ergometer. J Electromyogr Kinesiol 2002;12(6):479-92.
17. Beck TW, Housh TJ, Johnson GO, Weir JP, Cramer JT, Coburn JW, et al. Compari-son of Fourier and wavelet transform procedures for examining the mechanomyo-graphic and electromyomechanomyo-graphic frequency domain responses during fatiguing isoki-netic muscle actions of the biceps brachii. J Electromyogr Kinesiol 2005;15(2):190-9.
18. Wakeling JM, Rozitis AI. Spectral properties of myoelectric signals from diferent motor units in the leg extensor muscles. J Exper Biol 2004;207(14):2519-28.
19. Ansley L, Cangley P. Determinants of “optimal” cadence during cycling. Eur J Sport Sci 2009;9(2):61-85.
20. Tanaka H, Monahan KD, Seals DR. Age-predicted maximal heart rate revisited. J Amer Col Cardiol 2001;37(1):153-6.
21. Merletti R, Botter A, Troiano A, Merlo E, Minetto MA. Technology and instru-mentation for detection and conditioning of the surface electromyographic signal: State of the art. Clin Biomech 2009;24(2):122-34.
22. Rhea MR. Determining the magnitude of treatment efects in strength training research through the use of the efect size. J Streng Cond Res 2004;18(4):918-20.
23. Cohen J. Statistical power analysis for the behavioral sciences. 2nd ed. Hillsdale, NJ: Lawrence Earlbaum Associates; 1988.
24. Dorel S, Drouet JM, Couturier A, Champoux Y, Hug F. Changes of pedaling technique and muscle coordination during an exhaustive exercise. Med Sci Sports Exerc 2009;41(6):1277-86.
25. Yassierli, Nussbaum MA. Utility of traditional and alternative EMG-based measures of fatigue during low-moderate level isometric eforts. J Electromyogr Kinesiol 2008;18(1):44-53.
26. Clancy EA, Bertolina MV, Merletti R, Farina D. Time- and frequency-domain monitoring of the myoelectric signal during a long-duration, cyclic, force-varying, fatiguing hand-grip task. J Electromyogr Kinesiol 2008;18(5):789-97.
27. Hug F, Drouet JM, Champoux Y, Couturier A, Dorel S. Interindividual variability of electromyographic patterns and pedal force proiles in trained cyclists. Eur J Appl Physiol 2008;104(4):667-78.
28. Dimitrova NA, Dimitrov GV. Interpretation of EMG changes with fatigue: Facts, pitfalls, and fallacies. J Electromyogr Kinesiol 2003;13(1):13-36.
29. Farina D. Counterpoint: spectral properties of the surface EMG do not provide information about motor unit recruitment and muscle iber type. J Appl Physiol 2008;105(5):1673-4.