The work was supported by a grant from City University of Hong Kong (Project No. ITRG . 9610024-630)
Bing L. Luk and Louis K.P. Liu are with the Department of Manufacturing Engineering and Engineering Management, City University of Hong kong, Hong Kong SAR, China; (email: [email protected] and [email protected])
Z. D. Jiang is with the College of Information Science and Engineering, Ningbo University, Zhejiang, China; (email: [email protected])
F. Tong is with the Key Laboratory of Underwater Acoustic Communication and Marine Information Technology, Xiamen University, Xiamen, China .(email: [email protected])
Impact Acoustic Non-destructive Evaluation in
Noisy Environment Based on Wavelet Packet
Decomposition
Bing L. Luk, Z. D. Jiang, Louis K. P. Liu, and F. Tong
Abstract – Impact acoustic is an effective non-destructive evaluation (NDE) method for many applications especially for inspecting the bonding quality of mosaic tile-walls. However, the audio noise can affect the power spectrum density (PSD) distribution of an acquired signal seriously. So, the traditional method of using PSD as the main identification tool is not sufficient. This paper proposes an evaluation method based on wavelet packet decomposition (WPD). Using WPD, the PSD of the signal is allocated into certain component fields. Investigation on the component PSD indicates it can reveal the bonding quality even in a noisy environment. An artificial neural network (ANN) is chosen as a classifier to simplify the evaluation system and makes it more effective and efficient. The performance of the proposed approach is evaluated experimentally. It is verified that this WPD approach can be applied to impact acoustic method to enhance its evaluation capability in a noisy environment.
Index Terms— impact acoustic, de-noising, wavelet packet, NDE
I. INTRODUCTION
For inspecting the bonding condition of structure or composite material, various non-destructive evaluation (NDE) methods have been developed [1][2][3][4]. Comparing to other classical detection methods using ultrasound-echo, impact-echo, etc., the impact acoustic approach has many advantages because it does not need a physically good contact between the sensor and the specimen and it is relatively low cost for practical implementation. It has been adopted for practical applications with considerable performance [5][6].
Wavelet transform has become a prevalent method in advance signal processing that people often refer to the technology to reveal the underlying characteristic of a given signal. For NDE applications, when an inspection device is working in unstructured or chaotic environments, the acquired signal is usually contaminated with noise. In the past decade, the wavelet-based de-noising method was verified to be effective, and has been adopted widely [7]. The main idea of the method lies on the decomposition of raw signal by using wavelet transformation. Based on the information in wavelet domain, we propose a
characteristic-extracting method using wavelet packet decomposition for impact acoustic non-detective evaluation. In next section, the basics of impact acoustic and wavelet packet transform will be introduced briefly. The impact acoustic NDE experimental system will be described in section III. The performance of method is illustrated in Section IV, and a conclusion will be drawn in section V.
II. THEORETICAL BASIS
A. Impact Acoustic
Impact acoustic inspection method is based on the sound signal generated by a small hard object impacting the surface of the specimen. This impact actually causes the underlying structure of the sample to vibrate. So, this sound signal could contain information about the integrity of the sample. F. Tong [5] analyzed the impact process using a mass-spring model and A.P. Christoforou [8] studied the impact response with the energy distribution. H.D. Wu [9] defined the ratio of the power of the lower 1/3 frequency range to that of the overall frequency range in impact sounds spectrum as the power accumulation ratio (PAR) factor. All those studies presume that the signals were obtained from noise-free environments. However, noise in the acquired signal can distort the original PSD distribution pattern seriously. As a result, detection methods which just depend on the PAR can be weakened significantly by the noise.
In the proposed method, the sound signal is sampled and stored as a discrete digital sequence, {x(n), n=0,1,…,N -1}, with the length N. Suppose that the signal x(n) is contaminated with the additive noise v(n). According to the linearity property of Fourier transform, the actual PSD of the resultant signal y(n)=x(n)+v(n) that can be calculate by,
| ) ( | | ) ( | 2 | ) ( | | ) ( | | ) ( | ) (
2π⋅pk =Y k 2=X k 2+V k 2+ X k ⋅V k ,
k=0,1,…,N-1 (1) where Y(k) and V(k) refer to the FFTs of y(n) and v(n), respectively. The PSD distribution pattern can be defined as,
∑
=
k
k
p
k
p
k
)
(
)
(
)
(
ρ
, k=0,1,…,N-1 (2)For the noise having proportional distribution in frequency domain (e.g. white noise), from Eq.1, it just increases the overall PSD of the raw signal to a certain level without affecting the pattern of ρ(k). Therefore, the proposed approach focuses on the reduction of the frequency-limited noise, which have affected the pattern of
ρ(k) in the finite frequency band. As a result, the majority of ρ(k) is retained and distortion is suppressed.
Proceedings of the International MultiConference of Engineers and Computer Scientists 2008 Vol II IMECS 2008, 19-21 March, 2008, Hong Kong
Normally, multi-band filters group is considered. The whole band will be divided into M subbands and ρ(k) is fallen into L components ρj(k) (j=0,1,…,M-1). Suppose that the noise just contaminates the J-th sub-band and leaves other subbands free of noise, the other M-1 components of PSD distributions ρj(k) (j≠J and j=0,1,…,M-1) will still contain the majority of information reflecting the bonding quality.
B. Wavelet Packet Decomposition
The wavelet transform is the most recent technique in advance signal processing. It is defined in term of basic function obtained by compression or dilatation, and translation operations of mother wavelet. In view of signal filtering, it uses a series of orthogonal filter to sample the input signal. The orthogonal high- and low-pass filters are used to extract one sample from two and decompose the signal into a series of constituent parts in time domain. Due to its orthogonal property, the wavelet transform can extract time–frequency features effectively and keep the signal information "unaffected" during the decomposition process. So, the wavelet is suitable for the analysis of non-stationary signals.
The wavelet packet can be used to discompose the signal over the full frequency band [10]. It has the same process as the wavelet transform, the only difference is that the wavelet packet transform further decomposes both the approximate and detail components while the wavelet transform just decomposes the former. Figure 1 shows the
L-level wavelet packet decomposition. From the decomposition process, it can be regarded as performing through a serial of filters with scale and translation parameters. It is fit to combine the wavelet packet decomposition with the component PSD distribution. The
L-th wavelet packet decomposition has 2L component, so M equals to 2L. Through the wavelet transform, the time signal is mapped into wavelet domain. From Figure 1, we will get M=2L component PSD distribution patterns after L
levels decomposition.
g
h g
h ↓2
↓2 ↓2
↓2
g
h
g
h
. . .
g
h
g
h
. . .
↓2
↓2
↓2
↓2
. . .
↓2
↓2
↓2
↓2
. . .
. . . …
…
…
… …
…
…
…
1st level 2nd level …… L-th level
s(t)
1 , 0k
w
0 , 0k
w 2
, 1k
w
3 , 1k
w
5 , 1k
w
4 , 1k
w wmj,k
g
h
g
h
. . .
g
h
g
h
. . .
↓2
↓2
↓2
↓2
. . .
↓2
↓2
↓2
↓2
. . .
Figure 1 Wavelet Packet Decomposition
So, the wavelet packet coefficients of the signal s(t) can be computed via
)
2
(
2
)
(
)
(
)
(
),
(
, , /2,
s
t
W
t
s
t
W
t
dt
W
t
k
w
jmk j m jm k j m
k
j
=
=
=
−
− −
∫
(3) Now, the power of signal is mapped into the wavelet packet node. We can define the power of the node as
∑
=
k m
k j m
j
w
2
,
ρ
(4)which is the signal power in some specific frequency band indexed by parameter j and m. In fact, according to energy conservation law, the sum of the node power in the
same level is equal to the power of signal: |s(t)|=∑ρjm, in which the node(m) powers are contained in the l-th level of wavelet packet decomposition.
The wavelet thresholding technique is adopted in de-noising processing according to the rules proposed by Donoho and Johnstone [11][12] using the following equation.
⎩
⎨
⎧
≥
−
⋅
=
<
=
λ
λ
λ
|
|
,
)
|
(|
)
(
|
|
,
0
, ,
, ,
, ,
m k j m
k j m
k j m
k j
m k j m
k j
w
for
w
w
sign
w
w
for
w
(5)
where, the parameter λ is the threshold in wavelet domain.
III. EXPERIMENTAL RESULTS
A. Experiment Setup
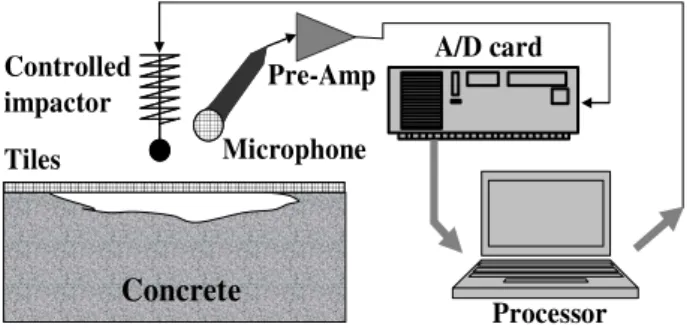
The NDE experimental system is illustrated in Figure 2. The apparatus adopted includes: a controlled impactor which is a rigid steel ball of 12mm diameter activated by a solenoid, a pre-amplifier module, an A/D converter with 40KHz sampling rate and a highly directional microphone. Such an impacting system provides a reliable and simple method to excite the test structure to generate sounds which contain information about the integrity of the structure.
Two type sample slabs are prepared in the experiment: one is of good bonding property; another contains an ø280mm circle-shaped void at the concrete substrate layer at the center location. The dimension of the slabs is 400mm × 400mm × 150mm. We call them ‘solid’ and ‘void’ for short respectively.
A/D card Pre-Amp
Microphone
Processor Concrete
Tiles Controlled impactor
Figure 2 Experimental System
B. PSD Distribution from Different Specimens
The PSD distribution of impact acoustic has been investigated in detail as discussed in [5]. In noise-free environment, extracting the characteristics of impact sound in frequency domain by PSD can be implemented easily since the PSD patterns of impact response is different among different bonding qualities. Figure 3(a) shows the normalized PSD of the impact sound from ‘solid’ slab, and Figure 3(b) is from ‘void’ slab. From those two figures, it can clearly identify the difference between a ‘solid’ and ‘void’ slab.
Although microphone has a highly direction property, it would be contaminated by noise inevitably while putting in a chaotic, mussy site. It can absorb any audible sound. We picked up a short speech signal recording from outdoor as the noise whose temporal waveform and PSD plotting in Figure 4(a). We found that although its small amplitude locates in temporal domain evenly, it has distinct PSD Proceedings of the International MultiConference of Engineers and Computer Scientists 2008 Vol II
IMECS 2008, 19-21 March, 2008, Hong Kong
0 100 200 300 400 500 600 700 800 900 1000 -5
0 5
Am
p
lit
u
d
e
(V
)
Time(0.025ms)
0 2 4 6 8 10 12 14 16 18 20
0 0.2 0.4 0.6 0.8 1
No
rm
a
li
z
e
d
PSD
Frequency(KHz)
(a)
0 100 200 300 400 500 600 700 800 900 1000 -5
0 5
Amp
lit
u
d
e
(V
)
Time(0.025ms)
0 2 4 6 8 10 12 14 16 18 20
0 0.2 0.4 0.6 0.8 1
N
o
rm
a
liz
e
d
P
S
D
Frequency(KHz) (b)
Figure 3 Impact Response from ‘solid’ And ‘void’ Slab
characteristics which are similar to the ‘solid’ type (Figure 3(a)).
Figure 4 Impact Response Contaminated by Additive Noise
Supposed the speech noise is additive, the contaminated signals obtained from ‘solid’ and ‘void’ slab are plotted in Figure 4(a) and Figure 4(b) respectively. Evidently, from Figure 4(b), the noise distorts the PSD
pattern of ‘void’ slab badly. In fact, this PSD pattern is more close to the PSD obtained from the ‘solid’ slab (see Figure 3(a) for comparison). So, we will get wrong judgement just from the PSD pattern when the signals are contaminated with noise.
As the noise has the same spectrum of the signal, any filter in temporal or frequency domain would not be feasible.
C. Component PSD
Under the noisy environment, the spectrum method on PSD does not work efficiently to distinguish the ‘void’ slabs from the solid slabs. However, through the wavelet packet decomposition to get component PSD pattern in special frequency bands, it is possible to develop a method to identify the health condition of the test sample in noisy conditions. The system diagram is shown in Figure 5.
Data Acquirement
Wavelet Packet Discomposition
(WPD)
Component PSD Generation
Artificial Neonenc Network (ANN) Impact
Response
Result
Figure 5 System Diagram with WPD
The impact response is translated in Data Acquirement
module to digital data, sequentially put through a threshold filter module in temporal domain to remove stochastic noise. Then, WPD operation is implemented with wavelet packet node coefficients from which the component PSD is generated. For the simplicity of system, 2-level wavelet packet decomposition is adopted (Figure 1). After that, filters are implemented according to the Eq.5 to remove the noise in wavelet domain in order to extract further the nature of the PSD pattern of the signal. Finally, the pattern is fed to an artificial neural network module to classify. Result of experiment is showed in Figure 6.
Comp onent
numb ers
Sp ecim
en nu m
bers
P
S
D
p
e
rcen
ta
g
e
(b)
Comp onent
number s
Sp ecim
en nu m
bers
P
S
D
p
ercen
ta
g
e
(a)
Comp onent
numb ers
Sp ecim
en nu m
bers
P
S
D
p
e
rcen
ta
g
e
(b)
Comp onent
numb ers
Sp ecim
en nu m
bers
P
S
D
p
e
rcen
ta
g
e
(b)
Comp onent
number s
Sp ecim
en nu m
bers
P
S
D
p
ercen
ta
g
e
(a)
Comp onent
number s
Sp ecim
en nu m
bers
P
S
D
p
ercen
ta
g
e
(a)
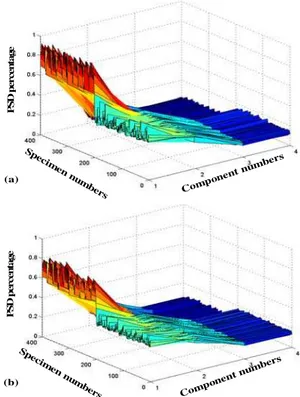
Figure 6 Component PSD of Wavelet Packet Decomposition
In experiment, we use the 2-level wavelet packet decomposition generating 4 node coefficient sequence:
0 100 200 300 400 500 600 700 800 900 1000 -6
-4 -2 0 2 4 6
A
m
p
litud
e(
V
)
Time(0.025ms)
0 2 4 6 8 10 12 14 16 18 20
0 0.2 0.4 0.6 0.8 1
N
o
rm
a
liz
e
d
P
S
D
Frequency(KHz)
(b)
0 100 200 300 400 500 600 700 800 900 1000 -6
-4 -2 0 2 4 6
A
m
p
lit
ud
e(V
)
Time(0.025ms)
0 2 4 6 8 10 12 14 16 18 20
0 0.2 0.4 0.6 0.8 1
N
o
rm
a
liz
e
d
P
S
D
Frequency(KHz) (a)
Proceedings of the International MultiConference of Engineers and Computer Scientists 2008 Vol II IMECS 2008, 19-21 March, 2008, Hong Kong
w21,k, w31,k, w41,k, w51,k. The wavelet is of arbitrary choice,
and the ‘db3’ wavelet is used in the experiment. The powers of them are computed as ρ21, ρ31, ρ41, ρ51,
respectively, to forming the component PSD.
In the experiment, 400 specimens (including 200 solid slabs and 200 void slabs) are investigated. Through 2-level wavelet packet decomposition, the power of raw signal allocates into 4 component fields. In Figure 6(a), it shows that the component PSD distribution of the noise-free raw signal. And Figure 6(b) stands for the one of noised signal. The first half 200 specimens are the impact responses of solid slabs and the second half 200 specimens the one of void slabs. Comparing the two figures, we find that the noise distorts the PSD distribution of raw signal. But the outline of component PSD pattern is not damaged which reflects the major characteristics of bonding quality.
D. Artificial Neural Network(ANN)
Now, the nature component PSD pattern of the signal is obtained. ANN is used as an efficient method for signal classification [13]. A 3-layer neural network of classical structure is used in our experiment including a 4-neuron input layer, one hidden layer and one output layer. The error backup propagation (BP) method with a momentum updating algorithm is chosen to train the ANN.
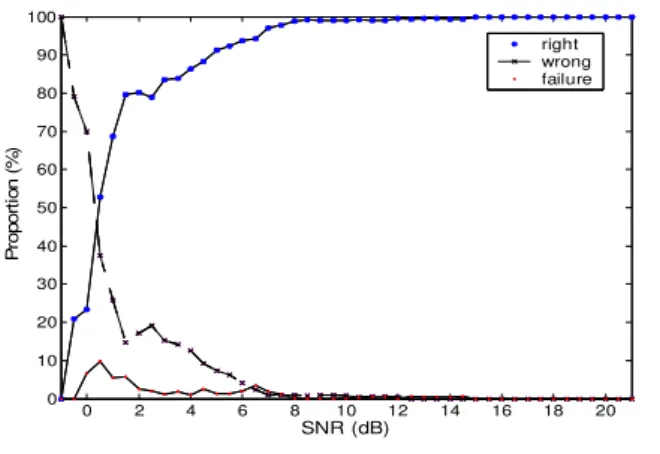
IV. PERFORMANCE
To verify the method, the performance of various SNR levels is simulated. It meets the normal signal detection principle. The performance is improved with the increase of the SNR. As shown in Figure 7, when SNR is greater than 15dB, the successful detection rate reaches 100%. Even with the SNR reduced to 2dB, the successful detection rate is still as high as 80%.
0 2 4 6 8 10 12 14 16 18 20
0 10 20 30 40 50 60 70 80 90 100
SNR (dB)
P
rop
ort
io
n
(%
)
right wrong failure
Figure 7 Performance with SNR
V. CONCLUSION
According to the characteristic of impact response, a novel method based on the wavelet packet and neural network is proposed to evaluate the bonding quality. In the investigation, the audible noise mixed with the impact response distorts the PSD distribution; however, it does not damage the outline of component PSD pattern. Through the 2-level wavelet packet decomposition and the ANN, the evaluation reaches a good result.
In practice, for simplifying the implementation, we use just 2 levels of wavelet packet decomposition and 3 neurons in the hidden layer of the ANN. The more levels of wavelet packet decomposition will result to the more detail
of PSD component pattern. The more neurons are in the hidden layer of ANN, the better is the classification performance. However, this will increase the processing time exponentially.
ACKNOWLEDGMENT
The authors would like to thank Mr. Alex Choy, Mr. David Lam, Mr. Ben Yeung and Mr. Alan Tso for their help in the development of the experimental system. The authors would also like to thank Sure-Smart Limited for the practical advice and workshop support
REFERENCES
[1] S. Yang, L. Gu, R.F. Gibson, Nondestructive detection of weak joints in adhesively bonded composite structures, Composite Structures, Vol.51, (2001):63-71.
[2] C. Cheng, M. Sansalone, The impact-echo response of concrete plates containing delaminations: numerical, experimental and field studies, Journal Materials and Structures, Vol.26, (1993):274-285.
[3] McCann DM, Fordc M C. Review of NDT methods in the assessment of concrete and masonry structures, NDT&E International, Vol.34(1), (2001):71-84.
[4] K. Mori, A. Spagnoli, A new contacting non-destructive testing method for defect detection in concrete, NDT&E International, Vol.35, (2002):399-406.
[5] F. Tong, S.K. Tso, X.M. Xu, Tile-wall bonding integrity inspection based on time-domain features of impact acoustics, Sensors and Actuators A: Physical, Vol.132(2), (2006):557-566.
[6] F. Tong, S.K. Tso, M.Y.Y. Hung, Impact-acoustics-based health monitoring of tile-wall bonding integrity using principal component analysis, Journal of Sound and Vibration, Vol.294(1-2), (2006):329-340.
[7] S.Sardy, P. Tseng, A.Bruce, Robust wavelet denoising, Signal Processing, IEEE Transactions, Vol.49, No.6, (2001):1146-1152.
[8] A.P. Christoforou, A.S. Yigit, Effect of flexibility on low velocity impact response, Journal of Sound and Vibration, Vol.217, (1998):563-578.
[9] H.D. Wu, M. Siegel, Correlation of accelerometer and microphone data in the “Coin Tap Test”, Proceedings of the Instrumentation and Measurement Technology Conference’99, Vol.2, (1999):814-819.
[10] H. Zhengjia et al., Wavelet transform and multiresolution signal decomposition for machinery monitoring and diagnosis, in Proc. IEEE Int. Conf. Industrial Technology, Dec.1996: 724-727.
[11] Donoho D.L., Johnstone, I.M., Ideal spatial adaptation by wavelet shrinkage, Biometrika, 81, (1994):425-455.
[12] Donoho, D.L., Johnstone, I.M., Adapting to unknown smoothness via wavelet shrinkage. Journal of the American Statistical Association, Vol.90, (1995):1200-1224.
[13] Y. Xiang, S.K. Tso, Detection and classification of flaws in concrete structure using bispectra and neural networks, NDT&E International Vol.35 (2003):19-27.
Proceedings of the International MultiConference of Engineers and Computer Scientists 2008 Vol II IMECS 2008, 19-21 March, 2008, Hong Kong