DOI: http://dx.doi.org/10.5007/1980-0037.2012v14n1p101
artigo original
DOI: http://dx.doi.org/10.5007/1980-0037.2012v14n1p101
review article
CC Licence
Creative Commom 1 Universidade Estadual de Londri-na. Centro de Educação Física e Es-porte. Departamento de Educação Física. Londrina, PR. Brasil. 2 Universidade Federal de Santa Catarina. Centro de Desportos. Departamento de Educação Física. Florianópolis, SC. Brasil.
3 Universidade Federal de Pelotas. Escola Superior de Educação Física. Pelotas, RS. Brasil. Received: 27 May 2011 Accepted: 21 September 2011
Accelerometers thresholds to estimate
physical activity intensity in children and
adolescents: a systematic review
Limiares de acelerômetros para a estimativa da
intensidade da atividade física em crianças e
adolescentes: uma revisão sistemática
Marcelo Romanzini 1
Edio Luiz Petroski 2
Felipe Fossati Reichert 3
Abstract– he aim of this study was to verify the criterion and cross-validity of acce-lerometer thresholds for distinguishing diferent physical activity intensities and iden-tifying sedentary behavior in children and adolescents. A systematic literature review was conducted using the PubMed, Scopus, Sports Discus and Web of Science databases. Inclusion criteria were: a) derivation and/or validation of accelerometer thresholds related to intensity of physical activity in youth (age 2 to 18 years); b) use of indirect calorimetry or direct observation as the reference method; c) original research articles published in English, Portuguese or Spanish. Nineteen studies were selected. he accelerometers most oten investigated were ActiGraph, RT3 and Actical. hresholds showed good to moderate validity in the calibration phase (sensitivity = 68 to 100%; speciicity = 61 to 100%). Generalizability of the thresholds was higher when they were tested on indepen-dent samples (Kappa = 0.72 to 0.91; sensitivity = 79 to 94%; speciicity = 72 to 98%) than during independent activities (Kappa = 0.46 to 0.71; sensitivity = 27 to 97%; speciicity = 52 to 95%). One calibration study tested the validity of thresholds in independent samples and activities, and only one threshold validation study was found. In conclusion, limited information is available on the generality of accelerometer thresholds for physical activity monitoring in children and adolescents. Validation studies are needed to identify appropriate thresholds for each type of accelerometer.
Key words:Calibration; Motion; Motor activity; Validity of tests.
iden-INTRODUCTION
he use of accelerometry in studies of physical activity in children and adolescents is becoming increasingly common.1 Accelerometers are
electronic devices that measure the acceleration of body movement2 and
enable objective quantiication of the frequency, duration, and intensity of physical activity. Although accelerometry does not provide contextual information on physical activity and is unable to measure certain forms of activity correctly,3,4 its use in child and adolescent research prevents
information bias, provides an improved understanding of the relationship between physical activity and health, and enables identiication of indings that would otherwise be undetectable by subjective measurements.5
From an operational standpoint, accelerometer counts must be translated into a biologically or behaviorally signiicant variable.6 his
process, known as calibration, involves the identiication of thresholds associated with the intensity of physical activity or the conversion of ac-celerometer counts into units of energy expenditure, using calorimetry or direct observation as a reference method. As the relationship between counts and biological or behavioral measures is inluenced by physical and physiological parameters6 and that diferent accelerometer models
collect and store data diferently,2 it is recommended that population-
and accelerometer-speciic thresholds or predictive models of energy expenditure be developed.
Over the past few years, a variety of accelerometer types have been cali-brated in samples of children and adolescents, and several thresholds and prediction models have been made available. However, authors have noted that the time spent by children and adolescents on moderate-to-vigorous physical activities varies signiicantly according to the adopted threshold.7-9
his may hinder comparison between studies on the prevalence of physical activity, and may afect the precision of efect measures in studies of the association between physical activity and health outcomes.
de Graauw et al.10 recently reviewed the validity of predictive models
derived from accelerometer counts and found them able to provide precise measurements of physical activity-related energy expenditure in children and adolescents only at the group level. On the other hand, no published studies have systematically reviewed the thresholds available for each ac-celerometer model and their indicators of validity in this population group. herefore, the aim of the present study is to provide a systematic review of the criterion and cross-validity of accelerometer count thresholds for the classiication of intensity of physical activity in children and adolescents.
METHODS
he search was limited to articles published until January 2011. Table 1 describes the search strategy used in each database.
Table 1. Keywords used to perform the literature search.
Databases Search string
PubMed Web of Science Scopus Sports Discus
(accelerometer* or accelerometry or motion sensor* or activity monitor* or ActiGraph or Actical
or Actiwatch or RT3 or Tritac or R3D or Mini-mitter) and (validity or validities or validity of results
or validity and reliability or validation or valid or calibration or cut-points or cut-of or threshold*)
and (physical activity or physical activities or locomotor activity or motor activities or sedentary
or moderate or vigorous or energy expenditure or free-living activities) and (adolescent* or teen*
or teenager* or youth* or adolescence or child or children or early childhood or young child or
students or young or preschool*)
he criteria for inclusion were as follows: a) establishment and/or validation of accelerometer count thresholds for determination of the intensity of physical activity; b) sample composed of children and/or ado-lescents (2–18 years); c) use of indirect calorimetry or direct observation as a reference method; d) original research articles published in English, Spanish, or Portuguese. Articles that mentioned accelerometer calibration only as a secondary portion of the Methods section were excluded, as were abstracts, review articles, dissertations, theses, monographs, book chapters, and duplicates. he references of all selected articles were also reviewed in an attempt to identify relevant studies not revealed by the literature search. No additional studies of relevance were thus identiied.
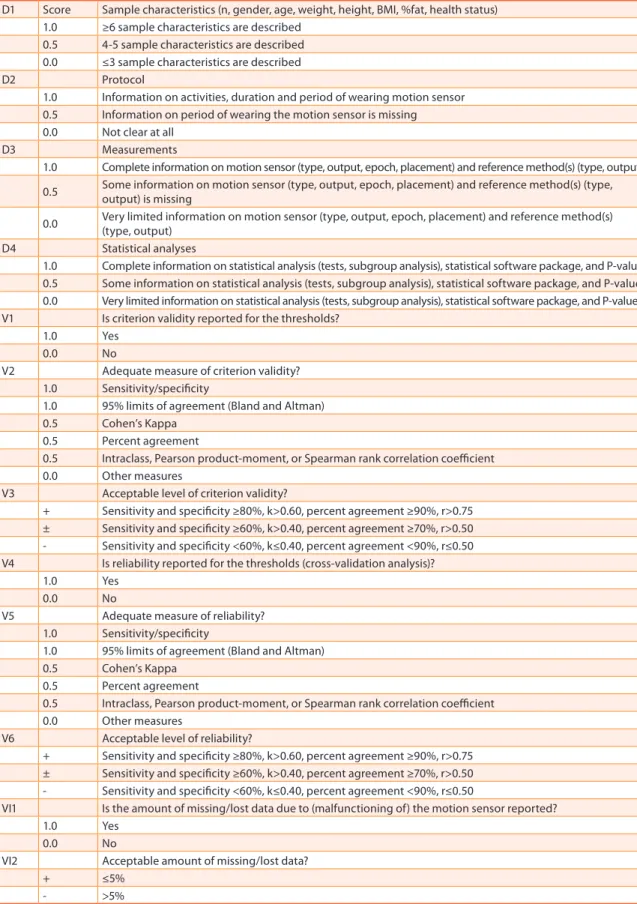
In order to enable comparison among thresholds and indicators of validity derived for each accelerometer model, data on a variety of pa-rameters (sample proile, physical activity proile, reference measure, and method used for derivation of thresholds) were extracted from each study. Furthermore, two investigators (MR and FFR) carried out independent assessments of the methodological quality of each study, using a modiied version of a checklist that has been previously employed elsewhere in the literature10,11 (Table 2). Any divergences in data extraction were reviewed
by a third investigator (ELP).
he criterion validity and cross-validity (generality) of thresholds were analyzed on the basis of the statistical measures adopted and their magnitude. Criterion validity was assessed by comparison of the intensity of physical activity as determined by each threshold versus a criterion measure. Cross-validity was assessed by comparison of the intensity of physical activity as determined by each threshold versus that determined by reference methods in independent samples and/or the same sample engaging in independent activities. Adequate measures of validity included sensitivity, speciicity, and 95% limits of agreement (Bland–Altman plots). Other measures of validity included percent agreement, Cohen’s kappa (k), and intraclass, Pearson’s product-moment (r), and Spearman’s rank cor-relation coeicients.12 Arbitrarily, a sensitivity and speciicity of ≥80% was
validity (±) as k>0.40 and ≥70% agreement or r>0.50, and poor validity (-) as k≤0.40 and <70% agreement or r≤0.50.13
Table 2. Checklist containing items concerning study design (D), validity (V), and feasibility (F).
D1 Score Sample characteristics (n, gender, age, weight, height, BMI, %fat, health status) 1.0 ≥6 sample characteristics are described
0.5 4-5 sample characteristics are described 0.0 ≤3 sample characteristics are described
D2 Protocol
1.0 Information on activities, duration and period of wearing motion sensor 0.5 Information on period of wearing the motion sensor is missing
0.0 Not clear at all
D3 Measurements
1.0 Complete information on motion sensor (type, output, epoch, placement) and reference method(s) (type, output)
0.5 Some information on motion sensor (type, output, epoch, placement) and reference method(s) (type, output) is missing
0.0 Very limited information on motion sensor (type, output, epoch, placement) and reference method(s) (type, output)
D4 Statistical analyses
1.0 Complete information on statistical analysis (tests, subgroup analysis), statistical software package, and P-value 0.5 Some information on statistical analysis (tests, subgroup analysis), statistical software package, and P-value 0.0 Very limited information on statistical analysis (tests, subgroup analysis), statistical software package, and P-value
V1 Is criterion validity reported for the thresholds?
1.0 Yes
0.0 No
V2 Adequate measure of criterion validity?
1.0 Sensitivity/speciicity
1.0 95% limits of agreement (Bland and Altman)
0.5 Cohen’s Kappa
0.5 Percent agreement
0.5 Intraclass, Pearson product-moment, or Spearman rank correlation coeicient
0.0 Other measures
V3 Acceptable level of criterion validity?
+ Sensitivity and speciicity ≥80%, k>0.60, percent agreement ≥90%, r>0.75 ± Sensitivity and speciicity ≥60%, k>0.40, percent agreement ≥70%, r>0.50 - Sensitivity and speciicity <60%, k≤0.40, percent agreement <90%, r≤0.50 V4 Is reliability reported for the thresholds (cross-validation analysis)?
1.0 Yes
0.0 No
V5 Adequate measure of reliability?
1.0 Sensitivity/speciicity
1.0 95% limits of agreement (Bland and Altman)
0.5 Cohen’s Kappa
0.5 Percent agreement
0.5 Intraclass, Pearson product-moment, or Spearman rank correlation coeicient
0.0 Other measures
V6 Acceptable level of reliability?
+ Sensitivity and speciicity ≥80%, k>0.60, percent agreement ≥90%, r>0.75 ± Sensitivity and speciicity ≥60%, k>0.40, percent agreement ≥70%, r>0.50 - Sensitivity and speciicity <60%, k≤0.40, percent agreement <90%, r≤0.50
VI1 Is the amount of missing/lost data due to (malfunctioning of) the motion sensor reported?
1.0 Yes
0.0 No
VI2 Acceptable amount of missing/lost data?
+ ≤5%
RESULTS
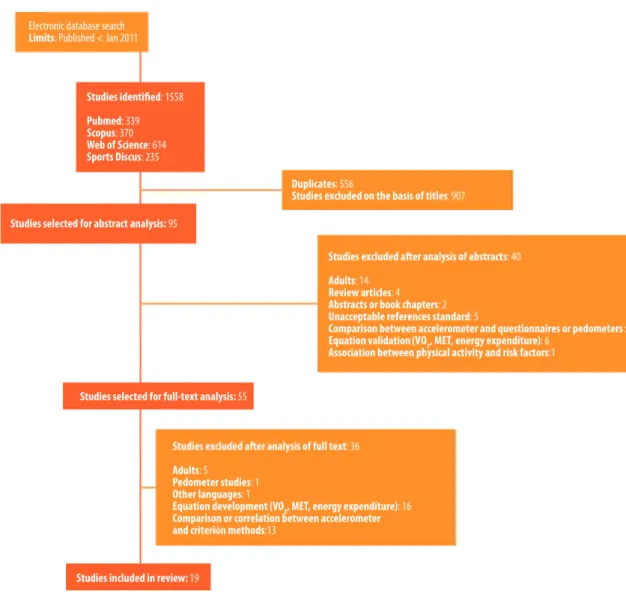
Our search strategy yielded 1558 studies, 19 of which were selected (Figure 1). hese studies provided thresholds for seven diferent models of acceler-ometers. he most commonly investigated models were ActiGraph, RT3, and Actical. Overall, 16 thresholds for identiication of sedentary behavior (SED), 23 for identiication of moderately intense activity (MOD), and 20 for detection of vigorous physical activity (VIG) were identiied. Five studies used direct observation as the reference method for comparison,14-18 whereas
all others used indirect calorimetry for calibration. One study assessed the cross-validity of previously published thresholds for the ActiGraph model.19
Eight provided cross-validation analysis, but only one used an independent sample and independent activities.17
Electronic database search Limits: Published < Jan 2011
Duplicates: 556
Studies excluded on the basis of titles: 907
Studies selected for abstract analysis: 95
Studies selected for full-text analysis: 55
Studies included in review: 19
Studies excluded after analysis of abstracts: 40
Adults: 14 Review articles: 4 Abstracts or book chapters: 2 Unacceptable references standard: 5
Comparison between accelerometer and questionnaires or pedometers : 8 Equation validation (VO2, MET, energy expenditure): 6
Association between physical activity and risk factors:1
Studies excluded after analysis of full text: 36
Adults: 5
Pedometer studies: 1 Other languages: 1
Equation development (VO2, MET, energy expenditure): 16
Comparison or correlation between accelerometer and criterion methods:13
Figure 1. Selection of studies included in the review.
were of high quality (>6 points),14,16,17,20,21 and all others were of moderate
quality (3.5–6.0 points). A single study provided feasibility data, noting an acceptable amount of data loss due to malfunctioning of the ActiGraph accelerometer (<5%).20
THRESHOLDS AND vALIDITy
Overall, thresholds had good to moderate validity in the calibration phase (sensitivity 68–100%, speciicity 61–100%) (Table 3). he ActiGraph model exhibited good validity for SED-related thresholds (sensitivity 86–100%, speciicity 91–100%) and moderate to good validity for MOD-related thresh-olds (sensitivity 77–96%, speciicity 61–100%) and VIG-related threshthresh-olds (sensitivity 68–100%, speciicity 80–95%). In children and adolescents (age 6–18 years) speciically, ActiGraph thresholds ranged from 100 to 800 counts·min-1 for SED, 1900–3600 counts·min-1 for MOD, and 3900–8200
counts·min-1 for VIG. In preschoolers (age 2–5 years), thresholds ranged
from 1100–1600 counts·min-1 for SED, 1680–3560 counts·min-1 for MOD,
and 3370–5020 counts·min-1 for VIG.
RT3 thresholds were calculated only in child and adolescent stud-ies. hresholds ranged from 40–420 counts·min-1 for SED, 950–1860
counts·min-1 for MOD, and 2330–4110 counts·min-1 for VIG. Only one study
reported validation parameters,21 which were indicative of good threshold
validity across all levels of physical activity intensity. he Actical acceler-ometer exhibited good to moderate validity for SED-related thresholds (sensitivity 86–97%, speciicity 72–98%), MOD-related thresholds (sensi-tivity 78–97%, speciicity 73–92%), and VIG-related thresholds (sensitiv-ity 77–98%, speciic(sensitiv-ity 61–79%). In children and adolescents, thresholds were set at 44–100 counts·min-1, 1500–2030 counts·min-1, and 2880–6500
counts·min-1 for SED, MOD, and VIG respectively. In preschoolers, only
one threshold was determined for MOD (715 counts·15s-1) and one for VIG
(1411 counts·15s-1).
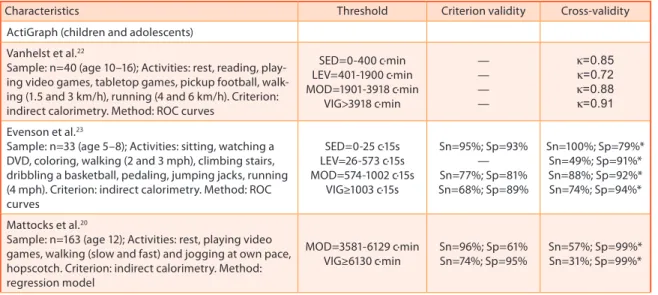
Table 3. Accelerometer count thresholds associated with intensity of physical activity (n=18).
Characteristics Threshold Criterion validity Cross-validity
ActiGraph (children and adolescents)
Vanhelst et al.22
Sample: n=40 (age 10–16); Activities: rest, reading, play-ing video games, tabletop games, pickup football, walk-ing (1.5 and 3 km/h), runnwalk-ing (4 and 6 km/h). Criterion: indirect calorimetry. Method: ROC curves
SED=0-400 c·min LEV=401-1900 c·min MOD=1901-3918 c·min
VIG>3918 c·min
— — — —
k=0.85 k=0.72 k=0.88 k=0.91
Evenson et al.23
Sample: n=33 (age 5–8); Activities: sitting, watching a DVD, coloring, walking (2 and 3 mph), climbing stairs, dribbling a basketball, pedaling, jumping jacks, running (4 mph). Criterion: indirect calorimetry. Method: ROC curves
SED=0-25 c·15s LEV=26-573 c·15s MOD=574-1002 c·15s
VIG≥1003 c·15s
Sn=95%; Sp=93% — Sn=77%; Sp=81% Sn=68%; Sp=89%
Sn=100%; Sp=79%* Sn=49%; Sp=91%* Sn=88%; Sp=92%* Sn=74%; Sp=94%*
Mattocks et al.20
Sample: n=163 (age 12); Activities: rest, playing video games, walking (slow and fast) and jogging at own pace, hopscotch. Criterion: indirect calorimetry. Method: regression model
MOD=3581-6129 c·min VIG≥6130 c·min
Sn=96%; Sp=61% Sn=74%; Sp=95%
Characteristics Threshold Criterion validity Cross-validity
Treuth et al.24
Sample: n=74 (age 13–14); Activities: rest, watching TV, playing computer games, sweeping, walking (2.5 and 3.5 mph), step aerobics, outdoors bicycling (12 mph), shooting baskets, climbing stairs, running (5 mph). Criterion: indirect calorimetry. Method: false-positives/ false-negatives analysis SED=0-50 c·30s LEV=51-1499 c·30s MOD=1500-2600 c·30s VIG>2600 c·30s — — — — Sn=100%; Sp=79%* Sn=55%; Sp=81%* Sn=74%; Sp=96%* Sn=48%; Sp=99%*
Puyau et al.25
Sample: n=26 (age 6–16); Activities: playing video games, coloring, playing with toys, warm-up exercises, walking (2.5 and 3.5 or 4 mph), martial arts, various games, running (4, 5, or 6 mph). Criterion: room calorim-etry. Method: regression model
SED=0-800 c·min LEV=800-3199 c·min MOD=3200-8199 c·min VIG≥8200 c·min — — — — Sn=100%; Sp=61%* Sn=12%; Sp=73%* Sn=54%; Sp=99%* Sn=7%; Sp=100%* ActiGraph (preschoolers)
Cauwenberghe et al.15
Sample: n=18 (age 4–6); Activities: sitting, standing, drawing, walking and running (on treadmill, at seven diferent speed settings), outdoor walking, free play. Criterion: direct observation. Method: ROC curves
SED=0-372 c·15s LEV=373-584 c·15s MOD=585-880 c·15s VIG≥881 c·15s Sn=86%; Sp=91% — Sn=87%; Sp=82% Sn=88%; Sp=91% — — — —
Pate et al.26
Sample: n=30 (age 3–5); Activities: walking (2 and 3 mph) and running (4 mph). Criterion: indirect calorim-etry. Method: visual inspection of VO2 data
MOD=420-841 c·15s VIG≥842 c·15s — — Sn=97%; Sp=86% Sn=66%; Sp=95%
Sirard et al.17
Sample: n=16 (age 3–5); Activities: sitting, playing while seated, slow and brisk walking, running. Criterion: direct observation. Method: ROC curves
SED<301ª, 363b, 398c c·min MOD≥615a, 812b, 891c
c·min VIG≥1231a,1235b,1255c
c·min Sn=94-100%; Sp=92-100% Sn=87-93%; Sp=67-100% Sn=96-100%; Sp=80-83% r=0,70 r=0,46 r=0,61
Reilly et al.18
Sample: n=30 (age 3-4); Activities: not reported.
Crite-rion: direct observation. Method: ROC curves SED<1100 c·min — Sn=83%; Sp=82%
RT3
Vanhelst et al.27
Sample: n=40 (age 10–16); Activities: rest, reading, play-ing video games, tabletop games, pickup football, walk-ing (1.5 and 3 km/h), runnwalk-ing (4 and 6 km/h). Criterion: indirect calorimetry. Method: ROC curves
SED=0-40 c·min LEV=41-950 c·min MOD=951-3410 c·min VIG>3410 c·min — — — — k=0,87 k=0,75 k=0,91 k=0,89 Kavouras et al.28
Sample: n=42 (age 10–14); Activities: walking (4 and 6 km/h), running (8 km/h), walking at grade (4 and 6 km/h, 6% grade). Criterion: indirect calorimetry. Method: regression model MOD=1323-2609 c·min VIG≥2610 c·min — — — —
Chu et al.21
Sample: n=35 (age 8–12); Activities: reading, coloring or playing board games, walking (2.4 and 6 km/h), running (8 km/h). Criterion: indirect calorimetry. Method: ROC curves
SED< 7 c·s LEV=7-30,9 c·s MOD=31-68,4 c·s VIG≥68,5 c·s Sn=100%; Sp=100% — Sn=87%; Sp=100% Sn=88%; Sp=97% Sn=94%; Sp=98% — Sn=84%; Sp=72% Sn=79%; Sp=84%
Rowlands et al.29
Sample: n=19 (age 9±1); Activities: playing computer games, walking (4 and 6 km/h), running (8 and 10 km/h), hopscotch, pickup football. Criterion: indirect calorim-etry. Method: regression model
MOD=970-2332 c·min VIG≥2333 c·min — — — — Actical
Evenson et al.23
Characteristics Threshold Criterion validity Cross-validity
Pfeifer et al.30
Sample: n=18 (age 3–5); Activities: walking (2 and 3 mph) and running (4 mph). Criterion: indirect calorimetry; Method: regression model.
MOD=715-1410 c·15s VIG≥1411 c·15s Sn=97%; Sp=92% Sn=98%; Sp=61% k=0,46 k=0,71
Puyau et al.31
Sample: n=32 (age 7–18); Activities: rest, playing video games, working at computer, dusting, aerobics, ball toss, walking (2 and 3 mph), running (4.5 to 7 mph). Criterion: room calorimetry. Method: regression model
SED=0-100 c·min LEV=100-1499 c·min MOD=1500-6499 c·min VIG≥6500 c·min Sn=86%; Sp=72% — Sn=92%; Sp=73% Sn=95%; Sp=70% — — — — Actiwatch
Puyau et al.31
Sample: n=32 (age 7–18); Activities: rest, playing video games, working at computer, dusting, aerobics, ball toss, walking (2 and 3 mph), running (4.5 to 7 mph). Criterion: room calorimetry; Method: regression model.
SED=0-49 c·min LEV=50-699 c·min MOD=700-2499 c·min VIG≥2500 c·min Sn=86%; Sp=71% — Sn=92%; Sp=68% Sn=97%; Sp=66% — — — —
Puyau et al.25
Sample: n=26 (age 6–16); Activities: playing video games, coloring, playing with toys, warm-up exercises, walking (2.5 and 3.5 or 4 mph), martial arts, various games, running (4, 5, or 6 mph). Criterion: room calorim-etry. Method: regression model
SED=0-99 c·min LEV=100-899 c·min MOD=900-2199 c·min VIG≥2200 c·min — — — — — — — — Actiheart
De Bock et al.14
Sample: n=33 (age 3–6); Activities: normal preschool activities. Criterion: direct observation. Method: ROC curves
SED=0-45 c·15s ♂ SED=0-25 c·15s ♀ MOD=HR>134 bpm, >118 c·15s ♂ MOD=HR>138 bpm, >105 c·15s ♀
Sn=78%; Sp=52% Sn=75%; Sp=61% Sn=27%; Sp=91% Sn=38%; Sp=93%
Biotrainer
Welk et al.16
Sample: n=30 (age 8–12); Activities: sitting, dribbling (while standing, walking, and running), walking, brisk walking, running. Criterion: direct observation. Meth-ods: ROC curves and regression model
MOD≥4000 c·min
— Sn=61%; Sp=93%
Activtracer
Tanaka et al.32
Sample: n=27 (age 5–6); Activities: rest, watching a video, coloring, playing with blocks, walking, climbing stairs, jogging at own pace, ball toss. Criterion: indirect calorim-etry. Method: regression models
MOD=395-1037 VIG≥1038 Sn=77%; Sp=94% — — —
*Generality indicators derived from Trost et al. (2011).
Sn denotes sensitivity; Sp, speciicity; k, Cohen’s kappa; c·s, counts per second; c·15s, counts per 15 seconds; c·30s, counts per 30 seconds; c·min, counts per minute; HR, heart rate; bpm, beats per minute.
aThreshold for age 3; bthreshold for age 4; cthreshold for age 5.
CROSS-vALIDATION Of THRESHOLDS
Four ActiGraph calibration studies tested the cross-validity of thresholds determined on independent samples and/or activities.17,18,22,26
Cross-vali-dation with independent samples showed good results for the thresholds reported by Vanhelst et al.22 (k=0.72–0.85) and Reilly et al.18 (sensitivity
83%, speciicity 82%). With independent activities, good to moderate cross-validity was found for the MOD and VIG thresholds determined by Pate et al.26 (sensitivity 97 and 66%, speciicity 86 and 95% respectively). With
independent samples and activities, there was poor to moderate cross-validity for the thresholds reported by Sirard et al.17 (r=0.46–0.71). An
found that those reported by Evenson et al.23 performed better across
difer-ent physical activity intensities (k=0.68) as compared with other published thresholds (k=0.62–0.36).20,24,25 Overall, the Evenson et al. thresholds23 had
good to moderate cross-validity for identiication of SED, MOD, and VIG activities (Table 2).
Two RT3 calibration studies tested the cross-validity of thresholds determined with independent samples.21,27 Vanhelst et al.27 reported
good cross-validity of thresholds across all intensities of physical activity (k=0.75–0,91), whereas Chu et al.21 found good cross-validity for
SED-related thresholds (sensitivity 94%, speciicity 98%) and moderate cross-validity of MOD- and VIG-related thresholds (sensitivity 84 and 79%, speciicity 72 and 84% respectively). he only cross-validation study of the Actical accelerometer was by Pfeifer et al.,30 who tested the cross-validity of
their thresholds with independent activities and reported moderate cross-validity for the MOD-related threshold (k=0.46) and good cross-cross-validity for the VIG-related threshold (k=0.71). Overall, cross-validity was greater when thresholds were tested on independent samples (k=0.72–0,91; sensi-tivity 79–94%; speciicity 72–98%)18,21,22,27 rather than independent
activi-ties (k=0.46–0.71; sensitivity 27–97%; speciicity 52–95%)14,16,26,30 (Table 2).
DISCUSSION
he present study reviewed the criterion validity and cross-validity of accelerometer count thresholds for classiication of physical activity in-tensity in children and adolescents. he ActiGraph, Actical, and RT3 ac-celerometers were those most commonly calibrated, and their thresholds were strikingly diferent for each intensity of physical activity. Overall, there was good to moderate validity for discrimination of SED, MOD, and VIG activities. However, limited information was provided on the cross-validity of these thresholds when tested with independent samples and independent activities.
Diferences in the criteria used to deine the intensity of physical activ-ity, sample size and proile, study protocol, and statistical procedures may have contributed to the discrepancies in thresholds determined for a single accelerometer model. It bears stressing that there is no clear understand-ing of which procedures are most adequate for derivation of accelerometer thresholds, which explains the lack of methodological standardization of calibration studies. As an illustrative example, a wide range of criteria have been used to categorize physical activity in the literature, and there is ongo-ing debate as to whether 3 or 4 METs should be used to deine moderate activity in children and adolescents.33,34
Another important methodological aspect concerns the method used for threshold derivation. Traditionally, regression models or ROC curves have been used. he pros and cons of these methods have been discussed at length elsewhere.35,36 In short, although regression models enable
error is a major limitation.10 ROC curves, in turn, enable empirical testing
of all possible thresholds on the ROC curve plot, which gives investigators the possibility of choosing the appropriate threshold based on the optimal balance between sensitivity and speciicity.
Regardless of the accelerometer model, thresholds exhibited good to moderate validity for determination of physical activity intensity as com-pared with the reference criterion measures adopted in calibration studies. However, in general, thresholds for moderate and vigorous physical activity derived from protocols based on ambulatory activities (walking and run-ning) had better validity15,17,21,30 than thresholds derived from protocols
which included a combination of ambulatory and non-ambulatory activi-ties.23,31,32 Indeed, certain non-ambulatory activities (dribbling a basketball,
climbing stairs, jumping jacks, step aerobics, martial arts, ball tossing) tend to give lower accelerometer counts than ambulatory activities with a lower energy expenditure.
Accordingly, most of the accelerometers identiied in this review are more sensitive to activities with a major vertical acceleration component, such as walking and running. Furthermore, accelerometers tend to be less precise when recording movement of body segments other than that on which they were placed.37 his set of factors may explain the superior
validity of thresholds derived from ambulatory activities. However, as the daily activities of children and adolescents are in no way restricted to ambulation, it is advisable for calibration studies to include activities that are truly representative of daily living in this population.36
here was limited information on the cross-validity of the thresholds identiied in our review of the literature. Overall, threshold cross-validity indicators were superior when tested on independent samples than when tested with independent activities. Likewise, Corder et al.38 found that
the accuracy of predictive models of energy expenditure derived from accelerometer counts is more dependent on the tested activities than on participant characteristics.
Ideally, threshold cross-validity should be tested on independent samples and activities. Sirard et al.17 monitored 269 preschoolers within
the school environment on diferent days and found poor to moderate correlation (r=0.46–0.70) between the sum of 15-second periods of physi-cal activities of difering intensity when categorized by direct observation and when categorized by thresholds determined during the calibration stage. Trost et al.19 tested the cross-validity of various sets of ActiGraph
thresholds in a sample of 206 participants between the ages of 5 and 15, using a protocol consisting of 12 activities of varying intensity (sedentary to vigorous), and found that the thresholds reported by Evenson et al.23
outperformed those reported by Treuth et al.,24 Mattocks et al.,20 and Puyau
et al.25 across all levels of physical activity.
he ActiGraph accelerometer is the most widely used model in child and adolescent research,11 and that for which the most thresholds have been
the uniaxial 7164 and GT1M models. Although the anteroposterior axis of the GT1M accelerometer was made available with second-generation models, current GT1M thresholds use information obtained from the vertical axis alone. he ActiGraph motion sensor currently available on the market is the GT3X model. his device consists of a triaxial acceler-ometer that collects information from three axes (vertical, medio-lateral, and anterior-posterior) and combines this information into a magnitude vector. herefore, although acceleration data recorded by the vertical axis of the GT1M model is comparable to that provided by the GT3X model39
for exploration of triaxial GT3X data, thresholds for the magnitude vector of this model have yet to be determined.
In short, the present review found that accelerometer count thresholds have good to moderate validity for estimation of physical activity intensity in children and adolescents. However, there is limited information on the cross-validity of these thresholds on independent samples and activities. Presently, there is evidence to indicate use of the Sirard et al. thresholds17
in preschoolers (poor to moderate cross-validity) and of the Evenson et al. thresholds23 in children and adolescents (good to moderate cross-validity).
Future validation studies are required to determine the most appropriate thresholds for each accelerometer model. Count thresholds of the magni-tude vector of the GT3X accelerometer are required for exploration of the triaxial capability of this new version of the ActiGraph device.
REfERENCES
1. Rowlands AV. Accelerometer assessment of physical activity in children: an update. Pediatr Exerc Sci 2007;19(3):252-66.
2. Chen KY, Bassett DR Jr. he technology of accelerometry-based activity monitors: current and future. Med Sci Sports Exerc 2005;37(Suppl 11):S490-500.
3. Matthew CE. Calibration of accelerometer output for adults. Med Sci Sports Exerc 2005;37(Suppl 11):S512-22.
4. Oliver M, Schoield GM, Kolt GS. Physical activity in preschoolers: understanding prevalence and measurement issues. Sports Med 2007;37(12):1045-70.
5. Reilly JJ, Penpraze V, Hislop J, Davies G, Grant S, Paton JY. Objective measure-ment of physical activity and sedentary behaviour: Review with new data. Arch Dis Child 2008;93(7):614-9.
6. Freedson P, Pober D, Janz KF. Calibration of accelerometer output for children. Med Sci Sports Exerc 2005;37(Suppl 11):S523-30.
7. Clif DP, Okely AD. Comparison of two sets of accelerometer cut-of points for calculating moderate-to-vigorous physical activity in young children. J Phys Act Health 2007;4(4):509-13.
8. Guinhouya CB, Hubert H, Soubrier S, Vilhelm C, Lemdani M, Durocher A. Moder-ate-to-vigorous physical activity among children: discrepancies in accelerometry-based cut-of points. Obesity (Silver Spring) 2006;14(5):774-7.
9. Mota J, Valente M, Aires L, Silva P, Santos MP, Ribeiro JC. Accelerometer cut-points and youth physical activity prevalence. Eur Phy Educ Rev 2007;13(3):287-99. 10. de Graauw SM, de Groot JF, van Brussel M, Streur MF, Takken T. Review of pre-diction models to estimate activity-related energy expenditure in children and adolescents. Int J Pediatr 2010;489304. doi:10.1155/2010/489304
update. Med Sci Sports Exerc 2009;41(4):818-27.
12. Szklo M, Javier Nieto F. Epidemiology: beyond the basics. Sudbury: Jones and Bartlett Publishers; 2007.
13. Innes E, Straker L. Validity of work-related assessments. Work. 1999;13(2):125-52. 14. De Bock F, Menze J, Becker S, Litaker D, Fischer J, Seidel I. Combining acceler-ometry and HR for assessing preschoolers’ physical activity. Med Sci Sports Exerc 2010;42(12):2237-43.
15. van Cauwenberghe E, Labarque V, Trost SG, de Bourdeaudhuij I, Cardon G. Cali-bration and comparison of accelerometer cut points in preschool children. Int J Pediatr Obes 2011;6(2-2):e582-9.
16. Welk GJ, Eisenmann JC, Schaben J, Trost SG, Dale D. Calibration of the Biotrainer Pro Activity Monitor in Children. Pediatr Exerc Sci 2007;19(2):145-58.
17. Sirard JR, Trost SG, Pfeifer KA, Dowda M, Pate RR. Calibration and Evaluation of an Objective Measure of Physical Activity in Preschool Children. J Phys Act Health 2005;2:345-57.
18. Reilly JJ, Coyle J, Kelly L, Burke G, Grant S, Paton JY. An objective method for meas-urement of sedentary behavior in 3- to 4-year olds. Obes Res. 2003;11(10):1155-8. 19. Trost SG, Loprinzi PD, Moore R, Pfeiffer KA. Comparison of accelerom-eter cut points for predicting activity intensity in youth. Med Sci Sports Exerc. 2011;43(7):1360-8.
20. Mattocks C, Leary S, Ness A, Deere K, Saunders J, Tilling K, et al. Calibration of an accelerometer during free-living activities in children. Int J Pediatr Obes. 2007;2(4):218-26.
21. Chu EYW, McManus AM, Yu CCW. Calibration of the RT3 Accelerometer for Am-bulation and NonamAm-bulation in Children. Med Sci Sports Exerc 2007;39(11):2085-91. 22. Vanhelst J, Beghin L, Turck D, Gottrand F. New validated thresholds for various
intensities of physical activity in adolescents using the Actigraph accelerometer. Int J Rehabil Res 2011;34(2):175-7.
23. Evenson KR, Catellier DJ, Gill K, Ondrak KS, McMurray RG. Calibration of two objective measures of physical activity for children. J Sports Sci 2008;26(14):1557-65. 24. Treuth MS, Schmitz K, Catellier DJ, McMurray RG, Murray DM, Almeida MJ, et
al. Deining accelerometer thresholds for activity intensities in adolescent girls. Med Sci Sports Exerc 2004;36(7):1259-66.
25. Puyau MR, Adolph AL, Vohra FA, Butte NF. Validation and calibration of physical activity monitors in children. Obes Res 2002;10(3):150-7.
26. Pate RR, Almeida MJ, McIver KL, Pfeifer KA, Dowda M. Validation and calibration of an accelerometer in preschool children. Obesity (Silver Spring) 2006;14(11):2000-6. 27. Vanhelst J, Béghin L, Rasoamanana P, heunynck D, Meskini T, Iliescu C, et al.
Calibration of the RT3 accelerometer for various patterns of physical activity in children and adolescents. J Sports Sci 2010;28(4):381-7.
28. Kavouras SA, Sarras SE, Tsekouras YE, Sidossis LS. Assessment of energy ex-penditure in children using the RT3 accelerometer. J Sports Sci 2008;26(9):959-66. 29. Rowlands AV, homas PWM, Eston RG, Topping R. Validation of the RT3 Tri-axial Accelerometer for the Assessment of Physical Activity. Med Sci Sports Exerc 2004;36(3):518-24.
30. Pfeifer KA, McIver KL, Dowda M, Almeida MJCA, Pate RR. Validation and Calibration of the Actical Accelerometer in Preschool Children. Med Sci Sports Exerc 2006;38(1):152-7.
31. Puyau MR, Adolph AL, Vohra FA, Zakeri I, Butte NF. Prediction of Activity Energy Expenditure Using Accelerometers in Children. Med Sci Sports Exerc 2004;36(9):1625-31.
32. Tanaka C, Tanaka S, Kawahara J, Midorikawa T. Triaxial Accelerometry for Assessment of Physical Activity in Young Children. Obesity (Silver Spring). 2007;15(5):1233-41.
Exerc 2005;37(2):329-36.
34. Ridley K, Olds TS. Assigning energy costs to activities in children: a review and synthesis. Med Sci Sports Exerc 2008;40(8):1439-46.
35. Jago R, Zakeri I, Baranowski T, Watson K. Decision boundaries and receiver operat-ing characteristic curves: new methods for determinoperat-ing accelerometer cutpoints. J Sports Sci 2007;25(8):937-44.
36. Welk GJ. Principles of design and analyses for the calibration of accelerometry-based activity monitors. Med Sci Sports Exerc 2005;37(Suppl 11):S501-11.
37. Clif DP, Reilly JJ, Okely AD. Methodological considerations in using accelerom-eters to assess habitual physical activity in children aged 0-5 years. J Sci Med Sport 2009;12(5):557-67.
38. Corder K, Brage S, Mattocks C, Ness A, Riddoch C, Wareham NJ, et al. Comparison of two methods to assess PAEE during six activities in children. Med Sci Sports Exerc 2007;39(12):2180-8.
39. Sasaki JE, John D, Freedson PS. Validation and comparison of ActiGraph activity monitors. J Sci Med Sport 2011;14(5):411-6.
Address for correspondence
Marcelo Romanzini
Departamento de Educação Física, Universidade Estadual de Londrina. Rod. Celso Garcia Cid, km 380, Campus Universitário.
CEP 86051-990, Londrina, Paraná, Brasil.