DOI: http://dx.doi.org/10.5007/1980-0037.2017v19n2p174
1 Pontifical Catholic University of Parana. Research Group on Physical Activity and Quality of Life. Curitiba, PR. Brazil.
2 Federal University of Parana. Gra-duate Program in Physical Education. Curitiba, PR. Brazil.
3 Washington University in St. Louis. Prevention Research Center. Brown School. St. Louis, MO. USA.
Received: 11 January 2017 Accepted: 10 March 2017
Combined physical activity and sitting time and
their contribution to body mass index in adults
Atividade física e tempo sentado combinados e sua
contribuição no índice de massa corporal em adultos
Priscila Bezerra Gonçalves1,2
Adalberto Aparecido dos Santos Lopes1,2
Alexandre Augusto de Paula Silva1,2
Jeruza Sech Buck Silva1,2
Alice Tatiane da Silva1,2
Leonardo Augusto Becker1,2
Marilson Kienteka1,2
Rodrigo Siqueira Reis1,2,3
Abstract – he aim of this study was to analyze the contribution of physical activity (PA) and sedentary time (ST) to Body Mass Index (BMI) in adults. he study was conducted in 2009, in Curitiba, Parana, Brazil with adults aged 18-65 years (1,411). A multidimen-sional questionnaire was used in which BMI, weekly minutes of PA and ST were obtained from self-reports. PA and ST were combined to determine the following independent variables: a) “active and not sedentary”; b) “active and sedentary”; c) “not active and not sedentary” and d) “not active and sedentary”. Multinomial logistic regressions were used to test the associations between PA, ST and BMI. he adjusted regression model showed that PA, regardless of ST, lowered the likelihood of participants being classiied as obese by 34% and 55%, respectively. In addition, PA at recommended levels (≥150 minutes/ week), while not being sedentary, lowered by 85% the likelihood of being classiied in the underweight category. Finally, ≥10 minutes/week of PA, while reporting higher ST levels, reduced the likelihood of being classiied as overweight by 37%. PA is associated with BMI regardless of TS. In addition, PA at recommended levels is inversely related to obesity and overweight.
Key words: Brazil; Motor activity; Nutritional status; Sedentary lifestyle.
INTRODUCTION
High Body Mass Index (BMI) values are an important risk factor for chronic noncommunicable diseases (NCDs), such as cardiovascular diseases, renal
diseases, diabetes, some cancers and musculoskeletal disorders 1. Data from
more than 19 million people in 186 countries have shown that the mean
BMI has increased considerably in recent decades1. In Brazil, in 2014, the
prevalence of adults in Brazilian capitals with overweight and obesity was
52.5% and 17.9%, respectively2. hus, the identiication of factors that may
attenuate or reverse this situation has been widely discussed in literature3.
In this sense, the regular practice of physical activity (PA) and the re-duction of sedentary time (ST) have been highlighted throughout the world
as they are factors of prevention for the emergence of NCDs4. Nevertheless,
23% of the world population5 and 15.4% of the Brazilian population2 is
considered physically inactive. Regarding sedentary behavior, 25.3% of the adult population of Brazilian capitals has a habit of watching television for
more than three hours daily2. In addition, women, older adults and people
of low socioeconomic status (SES) are more likely to spend longer times
in sedentary behavior6.
here is evidence, especially in high-income countries, that the increase in PA levels and the reduction of ST are associated, independently and
together, with lower adiposity7 and also with favorable lipid proile (HDL
cholesterol)8. Data from a multicenter study in 10 countries have shown
that higher PA levels were associated with reduction in the probability of overweight and obesity in adults, although no signiicant results were found
for ST9. In addition, a recent meta-analysis has found that practicing at least
60 minutes of moderate daily PA can eliminate the increased risk of death for a variety of NCDs, such as dyslipidemia, diabetes, hypertension, and
cardiovascular disease caused by high ST10. In a cohort study conducted
in Switzerland with 3,042 adults between 1991 and 2011, vigorous PA was inversely associated with obesity in both cross-sectional and longitu-dinal data. Participants who remained or became inactive were associated with weight gain and increased body fat, but ST was not associated with
increased BMI11. In another study conducted in Brazil, active commuting
and BMI were inversely associated12.
Despite the consistent relationship between inluence of PA on BMI and the beneits of regular practice of PA, to date, there is no evidence of the combined association of PA and ST with population BMI in samples of the Brazilian population. Available studies have analyzed these
behav-iors and factors in isolation13. Understanding this relationship will serve
METHODOLOGICAL PROCEDURES
Place of study
his study was carried out in the city of Curitiba, capital of the State of Paraná, which is located in the southern region of Brazil. At the time of data collection, the city had 1,897,997 inhabitants (≈1,130,139 adults) in
an area of 435,036 Km2. he city has high Municipal Human
Develop-ment Index (0.823), when compared to other Brazilian municipalities,
and with an extensive green area (65m2 per inhabitant), which includes
21 parks and 454 squares14.
Design, study characteristics and ethical aspects
his is an observational epidemiological study of cross-sectional design, part
of a broader project called “Caminhos para o Parque”, which aimed to examine
the role of urban parks in PA levels of adults in Curitiba, Paraná, Brazil.
he details of the methodology of this study are described in literature14.
Selection of parks and squares
For the present study, eight public leisure spaces (four parks and four squares) were selected. Initially, neighborhoods in which there were pub-lic spaces with characteristics of the physical environment were selected (e.g., parks, squares, animation axes) suitable for the practice of PA (75 neighborhoods). hen, with the aim of covering diferent characteristics of neighborhoods and the population of Curitiba, neighborhoods were stratiied according to income and characteristics of the “social and built
environment” (AMB) aimed at the practice of PA16. Coordinators of the
Municipal Secretariat of Sports Leisure and Youth (SMELJ) and Municipal Health Secretariat (SMS), indicated in which public spaces there were PA interventions or programs. After three consultations, consensus was ob-tained among coordinators and four parks and four squares were selected, being distributed in diferent income strata and AMB (high income and high AMB, high income and low AMB, low income and high AMB; low
income and low AMB)14.
Selection of households and participants
For the selection of households, an area of 500 meters radius was deter-mined from the central point of each public space included in the study. All segments of streets within this area were listed in order to identify places with domiciles. In each street segment, a household was randomly selected, and all residents of the household considered eligible (≥18 years, apparently healthy and residing at the place selected for at least one year) were identiied. Among these, a resident was randomly selected. More
detailed information on the sampling process is available in literature14.
Data collection
totaling 86 days. Twenty-ive female interviewers with experience in data collection were selected and trained by specialists from the Research Group on Physical Activity and Quality of Life. he theoretical course lasted 24 hours and the practical one lasted four hours. he research was approved by the Ethics Research Committee (No. 005/2008) and participants signed the Free and Informed Consent Form.
Dependent variable
BMI was calculated from self-reported measures of height and body mass17
and participants were classiied as “low weight” (≤18.5 kg / m²), “normal weight” (18.6-24.9 kg / m²), “overweight” (25-29.9 kg / m²) and “obese”
(≥30 kg / m²), as recommended by the World Health Organization18.
Independent variables
Total leisure PA was subjectively measured using the long version of the International Physical Activity Questionnaire (IPAQ ), validated for the Brazilian population, using the following equation: [walk + moderate
ac-tivity + (vigorous acac-tivity * 2)]19. ST was measured by the sum of the time
spent seated during weekdays and weekends, except time spent sitting in
a passive commuting (bus and / or car)4. Subsequently, the daily mean of
the total time spent in ST was calculated.
For purposes of analysis, two models were created for the combination of variables: a) active: PA ≥150 minutes / week and sedentary: ST ≥240
minutes / day, according to PA20 and ST recommendations4,10; b) active:
PA ≥ 10 minutes / week and sedentary: TS ≥240 minutes / day,
consider-ing a less rigid criterion for PA and ST recommendations4,10. Finally, the
independent variable was operationalized for each model, with PA and ST combination: a) “active and not sedentary”; b) “active and sedentary”; c) “not active and not sedentary” and d) “not active and sedentary”. he combination of these variables allowed us identifying which behaviors help to obtain a more adequate nutritional proile.
Covariates
Covariates were obtained through a questionnaire. Sex was obtained by the observation of interviewers (male / female). he age group was calculated from the date of birth and classiied into ive categories (18-29 years, 30-39 years, 40-49 years, 50-59 years and ≥60 years). Finally, SES was evaluated with questions that consider the number of household appliances, presence of maid and schooling of the family head, proposed by the Brazilian As-sociation of Research Companies (ABEP). For purposes of analysis, SES was classiied into three categories: low (E, D, C2 and C1), intermediate (B2 and B1) and high (A2 and A1).
Statistical analysis
Absolute and relative frequency distribution was performed to
was used to test the association between covariates and the PA and ST models. After performing bivariate analyses, covariates that presented p≤0.20 were included in the adjusted model (sex, age group and SES), as
possible confounding factors21. Finally, gross and adjusted multinomial
logistic regression was used to test the association between PA and ST combinations with BMI classiications. he forced input method was used in which all previously tested signiicant covariates (p≤0.20) were inserted into the regression model. Analyses were performed in SPSS 23.0 and the signiicance level was maintained at 5%.
RESULTS
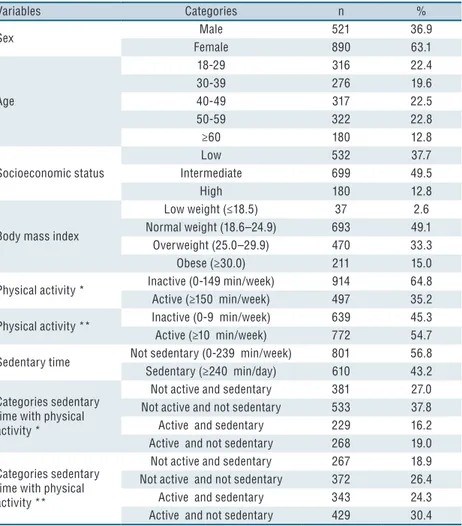
Of the total sample, 50 participants were excluded because they did not present complete data of variables used in the present study. hus, the inal sample consisted of 1,411 adults, mostly women (63.1%), aged 50-59 years (22.8%), intermediate SES (49.5%) and BMI classiied as normal (49.1%). Overall, 35.2% of participants reported performing ≥150 minutes / week of leisure PA and more than half (54.7%) reported practicing ≥10 minutes / week of leisure PA. In relation to ST, it was observed that in out of 10 par-ticipants, four remained ≥240 minutes / day in this behavior (43.2%). When considering the PA and ST categories, a greater proportion was observed in the non-sedentary and non-active groups for both PA classiications, ≥150 minutes / week (37.8%) and ≥10 minutes / week (26.4 %) (Table 1).
he most frequent measures among men were ST (48.4%, p = 0.003), overweight (37.8%, p = 0.016) and PA level considered active for both clas-siications, ≥150 minutes / week (41.8%, p <0.001) and ≥10 minutes / week (63.3%, p <0.001). On the other hand, low weight (3.3%, p = 0.016) and obesity (15.5%, p = 0.016) were more frequent among women. Regarding age group, higher frequency of adults classiied as sedentary (57.6%, p <0.001), with low weight (3.8%, p <0.001) and normal weight (68.0%, p < 0.001) was found among participants aged 18-29 years. Finally, for SES, higher fre-quency of participants classiied as sedentary (54.4%, p <0.001) and active in both classiications, ≥150 minutes / week (55.0%, p <0.001) and ≥10 minutes / week (75.6%, p <0.001) was found in participants with high SES (Table 2).
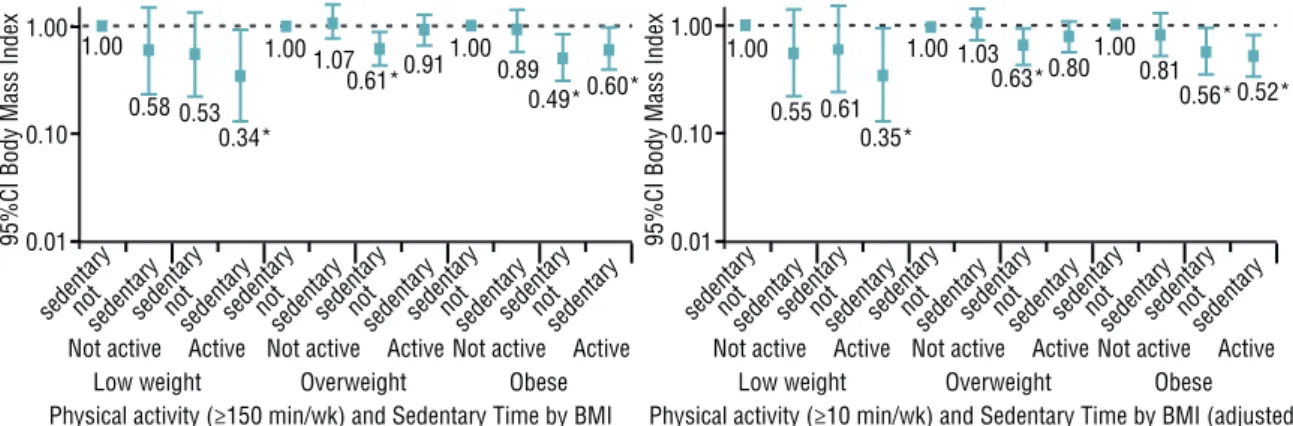
In the multinomial logistic regression analysis, for the combination of BMI, PA performed at ≥150 minutes / week and ST (Figure 1), there was an inverse association between “low weight” and “active / not sedentary” (OR: 0. 15, 95% CI 0.03-0.67), “obese” and “active / sedentary” (OR: 0.45, 95% CI: 0.26-0.77) and “obese” and “active / not sedentary “(OR: 0.52; 95% CI: 0.32-0.48) when adjusted for sex, age and SES. For the combination of BMI, PA performed at ≥10 minutes / week and ST (Figure 2), there was an inverse association between “low weight” and “active / not sedentary” (OR: 0.35, 95% CI: 0.13-0.93), “overweight” and “active / sedentary” (OR: 0.63, 95% CI: 0.43-0.92), “obese” and “active / sedentary” (OR: 0.56; 95%
CI: 0.35-0.92), “obese” and “active / sedentary” (OR: 0.52; 95% CI:
Table 1. Sociodemographic characteristics, physical activity and sedentary time in adults enrolled in the “Caminhos para o Parque” project. Curitiba, Paraná, Brazil (n = 1.411).
Variables Categories n %
Sex Male 521 36.9
Female 890 63.1
Age
18-29 316 22.4
30-39 276 19.6
40-49 317 22.5
50-59 322 22.8
≥60 180 12.8
Socioeconomic status
Low 532 37.7
Intermediate 699 49.5
High 180 12.8
Body mass index
Low weight (≤18.5) 37 2.6
Normal weight (18.6–24.9) 693 49.1
Overweight (25.0–29.9) 470 33.3
Obese (≥30.0) 211 15.0
Physical activity * Inactive (0-149 min/week) 914 64.8
Active (≥150 min/week) 497 35.2
Physical activity ** Inactive (0-9 min/week) 639 45.3
Active (≥10 min/week) 772 54.7
Sedentary time Not sedentary (0-239 min/week) 801 56.8
Sedentary (≥240 min/day) 610 43.2
Categories sedentary time with physical activity *
Not active and sedentary 381 27.0
Not active and not sedentary 533 37.8
Active and sedentary 229 16.2
Active and not sedentary 268 19.0
Categories sedentary time with physical activity **
Not active and sedentary 267 18.9
Not active and not sedentary 372 26.4
Active and sedentary 343 24.3
Active and not sedentary 429 30.4
Min=minutes; Week=week; ≥150 minutes/week*; ≥10 minutes/week **.
Table 2. Association between individual characteristics and physical activity, sedentary time and body mass index of adults enrolled in the “Caminhos para o parque” project. Curitiba, Paraná, Brazil. (n = 1411).
V ar ia b les / C at eg o ries
Sedentary time Physical activity Body mass index
Not
sedentary Sedentary*
Not
active Active**
Not
active Active**
Low weight
Normal weight
Over-weight Obese
n(%) n(%) p n(%) n(%) p n(%) n(%) p n(%) n(%) n(%) n(%) p
Sex
Male 262(51.6) 252(48.4)
0
.0
0
3
a 303(58.2) 218(41.8)
< 0 .0 0 1 a 191(36.7) 330(63.3) < 0 .0 0 1 a
8(1.5) 243(46.6) 197(37.8) 73(14.0)
0
.0
16
a
Female 532(59.8) 358 (40.2) 611(68.7) 279(31.3) 448(50.3) 442(49.7) 29(3.3) 450(50.6) 273(30.7) 138(15.5)
Age
18-29 134(42.4) 182(57.6)
< 0 .0 0 1 a 197(62.3) 119(37.7) 0. 4 0 9 a 145(45.9) 171(54.1) 0. 2 2 0 a
12(3.8) 215(68.0) 69(21.8) 20(6.3)
< 0 .0 0 1 a
30-39 161(58.3) 115(41.7) 184(66.7) 92(33.3) 112(46.6) 164(59.4) 3(1.1) 144(52.2) 86(31.2) 43(15.6)
40-49 182(57.4) 135(42.6) 207(68.5) 100(31.5) 159(50.2) 158(49.8) 10(3.2) 130(41.0) 129(40.7) 48(15.1)
50-59 203(63.0) 119(37.0) 201(62.4) 121(37.6) 144(44.7) 178(55.3) 10(3.1) 130(40.4) 114(35.4) 68(21.1)
≥60 121(67.2) 59(32.8) 115(63.9) 65(36.1) 79(43.9) 101(56.1) 2(1.1) 74(41.1) 72(40.0) 32(17.8)
Socioeconomic status
Low 353(66.4) 179(33.6)
<
0
.0
0
1
a 396(74.4) 136(25.6)
<
0
.0
0
1
a 298(56.0) 234(44.0)
< 0 .0 0 1 a 16
(3.0) 238(44.7) 188(35.3) 90(16.9)
0
.1
6
7
a
Intermediate 366(52.4) 333(47.6) 437(62.5) 262(37.5) 297(42.5) 402(57.5) 15 (2.1) 358(51.2) 225(32.2) 101(14.4)
High 82(45.6) 98(54.4) 81(45.0) 99(55.0) 44(24.4) 136(75.6) 6 (3.3) 97(53.9) 57(31.7) 20(11.1)
DISCUSSION
he aim of this study was to test the contribution of PA and ST, analyzed together, in the BMI of Brazilian adults. he main results showed that the likelihood of people being classiied as obese and underweight when compared to normal weight was lower in groups that practiced PA, re-gardless of the weekly volume. In addition, practicing minimum PA (≥10 minutes / week) decreased the participants’ likelihood of being classiied as overweight. Regarding individual characteristics, only one-third of the interviewees complied with recommendations of practice of leisure PA and approximately half of the sample was classiied as overweight or obese. In addition, achieving recommendations of practicing ≥150 minutes of PA
per week20 was associated with males (42%) and with high SES (55%).
Similar results were identiied in adults living in the Brazilian capitals, where 37.6% of this population performed leisure PA, being more prevalent
among men (45.6%) aged 18-24 years (51.4%)2. In relation to ST, there was
an inverse association with age group, that is, the younger (18-29 years), the higher the ST, corroborating results of a study carried out in 20 countries,
Figure 1. Box-plot for multinomial logistic regression analysis, crude and adjusted, between BMI and combination of physical activity (guidelines) and sedentary time (n=1,411).
BMI: Body Mass Index; Active: ≥150 minutes/week; Sedentary: ≥240 minutes/day; Adjusted by sex, age group and socioeconomic status; *p≤0.05.
Figure 2. Box-plot for multinomial logistic regression, crude and adjusted, analysis between BMI and combination of physical activity (>10minutes/week) and sedentary time (n=1,411).
in which adults aged 40-65 years were less likely of showing this behavior
when compared to the age group of 18-39 years22.
In this study, participants classiied as low weight, those who prac-ticed some weekly PA and did not remain four hours a day or more in ST, were less likely of being low weight when compared to not active or active groups with ST greater than four hours daily. hese indings reinforce the importance of PA, even in small volumes, since low weight is a health con-dition responsible for an 80% increase in the risk of death from any cause
compared to normal weight23. In addition, the causes of low weight may be
related to excessive alcohol consumption, smoking and inadequate diet24,
but these relationships still remain inconclusive. However, it is known that the practice of PA can inluence changes in lifestyle and healthy habits, reducing the risk factors of low weight and increasing the likelihood of
participants achieving an ideal weight3,5.
Participants who had ≥ 10 minutes of leisure PA, even with high ST, were less likely of being overweight compared to those classiied as not active and sedentary. Evidence suggests that excess ST is an important risk
factor for chronic diseases and premature mortality25. hus, PA can also
act as a protective factor, mitigating the detrimental efects of ST. hese indings corroborate more recent literature, indicating that performing at least one hour of PA per day may reduce the risk of death associated with
high sitting time10.
More signiicant results were found for the group of obese participants. Performing some weekly PA regardless of classiication used (≥ 10 minutes / week or ≥150 minutes / week), represented approximately 50% less chance of participants being classiied as obese, regardless of ST, reinforcing the indings of this study on the importance of the practice of PA and reduction of ST. Literature shows that physical inactivity was responsible for 6% of the
causes of death worldwide3 and 3.8% were attributed to sedentary behavior
26. In addition, the decrease in physical inactivity and ST can increase life
expectancy, on average, 0.68 and 0.23 years, respectively 3,26. hese results
indicate that changes in these behaviors, especially in the practice of PA, seem to be the starting point for maintaining healthy body weight.
he results of this study highlight the importance of multifactorial actions to promote healthy habits, such as the inclusion of PA in daily
life3,27, healthy eating27 and body weight control1. In addition, public
poli-cies should consider actions in community settings that may beneit, in
particular, less active groups with higher prevalence of ST28. For example,
propose changes in the planning of cities that favor the practice of PA
through active commuting 29. In general, it seems that the inclusion of PA
in people’s daily lives, even in reduced volume, can improve the chances of adjusting BMI to optimal health levels, thereby improving quality of life
and self-esteem, and reducing costs of the public health system30. hus,
even if people have high ST.
For a better interpretation of results, some limitations should be con-sidered. he cross-sectional design does not allow establishing a causal relationship among variables. Self-reported measures tend to overestimate PA and ST and may contribute to an increase in non-diferential error. In the analyses, only leisure PA was considered, not allowing extrapolation of the indings to other domains of PA. Sample selection was conducted in regions intentionally selected based on the social and physical characteristics of the dwelling region of participants. However, the sample distribution was balanced among neighborhoods, reducing the chances of clustering efect. In addition, the main confounding variables were included in the adjusted analyses and the efects were analyzed along diferent exposure and outcome gradients, assuring greater conidence in the internal validity of the indings.
CONCLUSION
In this study, PA was shown to be a protective factor against overweight and obesity, regardless of ST volume. his evidence strengthens the role of PA in controlling obesity, particularly for people who spend long time performing seated activities, such as in some jobs and during motor trans-portation. Obesity control actions should prioritize increased opportuni-ties for practicing PA in work environments, as well as increasing access to healthier commuting, such as walking and cycling. In addition, future studies should be conducted on samples from other regions and cities, as well as objective measures should be used to evaluate the PA and ST in order to conirm the indings of this study.
REFERENCES
1. Collaboration, NCD Risk Factor. Trends in adult body-mass index in 200 countries
from 1975 to 2014: a pooled analysis of 1698 population-based measurement studies with 19.2 million participants. Lancet 2014;387(10026):1377–96.
2. Ministério da Saúde. Secretaria de Vigilância em Saúde. Vigilância de Fatores
de Risco e Proteção para Doenças Crônicas por Inquérito Telefônico: VIGITEL 2014. Disponível em: <http://bvsms.saude.gov.br/bvs/publicacoes/vigitel_bra-sil_2014.pdf>.
3. Lee I-M, Shiroma EJ, Lobelo F, Puska P, Blair SN, Katzmarzyk PT, et al. Efect
of physical inactivity on major non-communicable diseases worldwide: An analysis of burden of disease and life expectancy. Lancet 2012;380(9838):219–29.
4. Owen N, Sugiyama T, Eakin EE, Gardiner PA, Tremblay MS, Sallis JF.
Adults’ sedentary behavior: Determinants and interventions. Am J Prev Med 2011;41(2):189–96.
5. Sallis JF, Bull F, Guthold R, Heath GW, Inoue S, Kelly P, et al. Progress in physical
activity over the Olympic quadrennium. Lancet 2016;6736(16):1–12.
6. Mielke GI, Da Silva ICM, Owen N, Hallal PC. Brazilian adults’ sedentary
be-haviors by life domain: Population-based study. PLoS One 2014;9(3):1–7.
7. Du H, Bennett D, Li L, Whitlock G, Guo Y, Collins R, et al. Physical activity
8. Crichton GE, Alkerwi A. Physical activity, sedentary behavior time and lipid levels in the Observation of Cardiovascular Risk Factors in Luxembourg study. Lipids Health Dis 2015;14(1):87.
9. Van Dyck D, Cerin E, De Bourdeaudhuij I, Hinckson E, Reis RS, Davey R, et al.
International study of objectively measured physical activity and sedentary time with body mass index and obesity: IPEN adult study. Int J Obes 2015;39(2):199–207.
10. Ekelund U, Steene-Johannessen J, Brown WJ, Fagerland MW, Owen N, Powell
KE, et al. Does physical activity elminate the detrimental association of sitting time with mortality? A harmonized meta-analysis of data from more than one million men and women. Lancet 2016;6736(16):1–10.
11. Wanner M, Martin BW, Autenrieth CS, Schafner E, Meier F, Brombach C, et
al. Associations between domains of physical activity, sitting time, and diferent measures of overweight and obesity. Prev Med Reports 2016;3:177–84.
12. Florindo AA, Guimarães VV, Cesar CLG, Barros MBDA, Alves MCGP,
Goldbaum M. Epidemiology of leisure, transportation, occupational, and household physical activity: prevalence and associated factors. J Phys Act Health 2009;6(5):625–32.
13. Chaves RN, Souza MC, Santos D, Seabra A, Garganta R, Maia JAR. Fatores
genéticos e ambientais da atividade física. Um estudo em famílias com três gerações. Rev Bras Cineantropom Desempenho Hum 2010;12(6):408–14.
14. Fermino R, Reis R, Hallal PC, Kaczynski AT. Who are the users of urban parks?
A study with adults from Curitiba, Brazil. J Phys Act Health 2015;12(1):58–67.
15. Fermino R, Reis RS, Cassou AC. Fatores individuais e ambientais associados ao
uso de parques e praças por adultos de Curitiba-PR, Brasil. Rev Bras Cineantropom Desempenho Hum 2012;14(4):377–89.
16. Hino AAF, Reis RS, Ribeiro IC, Parra DC, Brownson RC, Fermino RC. Using
observational methods to evaluate public open spaces and physical activity in Brazil. J Phys Act Health 2010;7 (Suppl 2):S146-54.
17. Silveira EA da, Araújo CL, Gigante DP, Barros AJD, Lima MS de. Weight and
height validation for diagnosis of adult nutritional status in southern Brazil. Cad Saude Publica 2005;21(1):235–45.
18. World Health Organization. Global strategy on diet, physical activity and health
[Internet]. 2004; Available from: http://www.who.int/dietphysicalactivity/strategy/ eb11344/strategy_english_web.pdf [2016 dez 20]
19. Hallal PC, Gomez LF, Parra DC, Lobelo F, Mosquera J, Florindo AA, et al.
Lessons learned after 10 years of IPAQ use in Brazil and Colombia. J Phys Act Health 2010;7(2):S259–64.
20. World Health Organization. Global recommendations on physical activity for
health [Internet]. Geneva: World Health Organization. 2010; Available from: <http://apps.who.int/iris/bitstream/10665/44399/1/9789241599979_eng.pdf> [2016 dez 20].
21. Barros AJ, Hirakata VN. Alternatives for logistic regression in cross-sectional
studies: an empirical comparison of models that directly estimate the prevalence ratio. BMC Med Res Methodol 2003;3:21.
22. Bauman A, Ainsworth BE, Sallis JF, Hagströmer M, Craig CL, Bull FC, et al. he
descriptive epidemiology of sitting: A 20-country comparison using the interna-tional physical activity questionnaire (IPAQ ). Am J Prev Med 2011;41(2):228–35.
23. Cao S, Moineddin R, Urquia ML, Razak F, Ray JG. J-shapedness: an often missed,
often miscalculated relation: the example of weight and mortality. J Epidemiol Community Health 2014;68(7):683–90.
24. Roh L, Braun J, Chiolero A, Bopp M, Rohrmann S, Faeh D. Mortality risk
as-sociated with underweight: a census-linked cohort of 31,578 individuals with up to 32 years of follow-up. BMC Public Health 2014;14(1):371.
25. Katzmarzyk PT. Standing and mortality in a prospective cohort of canadian Adults.
CORRESPONDING AUTHOR
Priscila Bezerra Gonçalves Pontifícia Universidade Católica do Paraná
Grupo de Pesquisa em Atividade Física e Qualidade de Vida (GPAQ), Telefone: + 55 41 3271 2503 Rua Imaculada Conceição, 1155 - Prado Velho-80215-901-Curitiba, Paraná, Brasil.
Email: priscilab.goncalves@hotmail. com
26. Rezende LFM, Sá TH, Mielke GI, Viscondi JYK, Rey-López JP, Garcia LMT.
All-Cause Mortality Attributable to Sitting Time. Analysis of 54 Countries Worldwide. Am J Prev Med 2016;1–11.
27. Cecchini M, Sassi F, Lauer J a, Lee YY, Guajardo-Barron V, Chisholm D.
Tackling of unhealthy diets, physical inactivity, and obesity: health efects and cost-efectiveness. Lancet 2010;376(9754):1775–84.
28. Heath GW, Parra DC, Sarmiento OL, Andersen LB, Owen N, Goenka S, et al.
Evidence-based intervention in physical activity: Lessons from around the world. Lancet 2012;380(9838):272–81.
29. Reis RS, Salvo D, Ogilvie D, Lambert E V, Goenka S, Brownson RC. Scaling
up physical activity interventions worldwide: Stepping up to larger and smarter approaches to get people moving. Lancet 2016;6736(16):1–12.
30. Ding D, Lawson KD, Kolbe-Alexander TL, Finkelstein EA, Katzmarzyk PT, Van