DOI: http://dx.doi.org/10.5007/1980-0037.2016v18n2p197
Agreement analysis between critical power and
intensity corresponding to 50% ∆ in cycling
exercise
Análise de concordância entre a potência crítica e a
intensidade correspondente ao 50% ∆ no exercício de
ciclismo
Kristopher Mendes de Souza1
Ricardo Dantas de Lucas1
Paulo Cesar do Nascimento Salvador1
Lucas Crescenti Abdalla Saad Helal1
Luiz Guilherme Antonacci Guglielmo1
Camila Coelho Greco2
Benedito Sérgio Denadai2
Abstract
∆) between oxygen uptake (VO2) at lactate threshold (LT) and maximal oxygen uptake (VO2max) in untrained subjects during cycling exercise. Fifteen healthy male subjects (age: 26.0 ± 3.5 years; body weight: 76.6 ± 10.4 kg; height: 178.2 ± 7.6 cm) volunteered to participate in the study. Each subject performed a series of tests to determine LT, VO2LT, CP, VO2CP,
50% ∆, VO250% ∆, and VO2max 2LT, CP, VO2CP, 50% ∆, VO250% ∆ and VO2max were 109 ± 15 W, 1.84 ± 0.23 L.min-1, 207 ± 17 W, 2.78 ± 0.27 L.min-1,
206 ± 19 W, 2.77 ± 0.29 L.min-1, and 3.71 ± 0.49 L.min-1
∆ (t = 0.16; p = 0.87) or between VO2CP
and VO250% ∆ (t = 0.12; p = 0.90). However, the bias ± 95% limits of agreement for comparison between CP and 50% ∆ and between VO2CP and VO250% ∆ were 1 ± 27 W (0.3 ± 14.1%) and 0.01 ± 0.24 L.min-1 (0.2 ± 8.9%), respectively. In summary, the
mean CP and 50% ∆ values w
limits of agreement between the two intensities, CP estimated based on 50% ∆ might taken into account.
Key words: Exercise intensity; Lactate threshold; Maximal oxygen uptake.
Resumo – A proposta deste estudo foi determinar o nível de concordância entre a potência crítica (PC) e a intensidade correspondente a 50% da diferença (50% ∆) entre o consumo de oxigênio (VO2) no limiar de lactato (LL) e o consumo máximo de oxigênio (VO2max) em sujeitos não treinados durante o exercício de ciclismo. Quinze sujeitos saudáveis do sexo masculino (idade: 26,0 ± 3,5 anos; massa corporal: 76,6 ± 10,4 kg; estatura: 178,2 ± 7,6 cm) participaram deste estudo. Cada sujeito realizou uma série de testes para determinar o LL, VO2LL, PC, VO2PC, 50% ∆, VO250% ∆ e VO2max. Os valores de LL, VO2LL, PC, VO2PC, 50% ∆, VO250% ∆ e VO2max foram 109 ± 15 W, 1,84 ± 0,23 L.min
-1, 207 ± 17 W, 2,78 ± 0,27 L.min-1, 206 ± 19 W,
2,77 ± 0,29 L.min-1 e 3,71 ± 0,49 L.min-1
foi encontrada entre a PC e o 50% ∆ (t = 0.16; p = 0.87) e entre o VO2PC e o VO250% ∆ (t = 0.12; p = 0.90). Entretanto, o bias ± 95% dos limites de concordância para as comparações entre a PC e o 50% ∆ e entre o VO2PC e o VO250% ∆ foram 1 ± 27 W (0,3 ± 14,1%) e 0,01 ±
0,24 L.min-1 (0,2 ± 8,9%), respectivamente. Em resumo, os valores médios de PC e 50% ∆ não
1 Federal University of Santa Cata-rina. Sports Center. Physical Effort Laboratory, Florianópolis, SC. Brazil.
2 State University of São Paulo. Human Performance Laboratory. Rio Claro, SP. Brazil.
Critical power estimation in cycling exercise Souza et al.
INTRODUCTION
Exercise intensity domains are deined based on their diferent metabolic and physiological proiles1,2 and are classiied as moderate, heavy, and
severe1. he nature and magnitude of the blood lactate ([La]) and oxygen
uptake (VO2) responses within these three exercise intensity domains are very speciic1-4 and, consequently, promote diferent adaptations to
train-ing4. he lactate threshold (LT) is considered the upper boundary of the
moderate-intensity domain1-4, while the critical power (CP; the asymptote
of the power-time relationship) represents the boundary between the heavy- and severe-intensity domains1-4. hus, the accuracy of determining these
boundary work rates (i.e., LT and CP) has been considered essential for both aerobic training prescription and experimental designs.
Particularly, given that CP represents an important demarcator of meta-bolic and physiological stability and a fundamental index for understanding high-intensity exercise tolerance3,5-8, its relevance cannot be overemphasized.
However, the determination of CP is especially demanding in terms of the subject’s efort and testing time9. As an alternative, studies investigating the
metabolic and physiological responses to heavy- and severe-intensity exercise have established work rates using the “percentage delta” (% ∆) method10,11.
he % ∆ considers both VO2 at LT (VO2LT) and maximal oxygen uptake (VO2max)10,11, such that the 50% ∆ intensity refers to the work rate calculated
to require 50% of the diference between VO2LT and VO2max.
Using this approach, it is assumed that the overall metabolic and physi-ological demands experienced by subjects exercising at the same % ∆ are similar. However, this assumption can be questioned because it does not account for some aspects (e.g., inter-subject variability, exercise mode, and aerobic training status) that can inluence the % ∆ corresponding to CP9,11,12.
As a consequence, diferent subjects exercising at a given % ∆ might actu-ally be in diferent exercise intensity domains. Nevertheless, based on the % ∆ concept, some studies involving untrained subjects have assumed the work rate associated with 50% ∆ to be the boundary between the heavy- and severe-intensity domains10,12,13,15,16. However, to our knowledge, the
validity of this approach is missing since direct comparison between CP and 50% ∆ in untrained subjects has never been appropriately investigated.
hus, it is important to determine the relationship between CP and 50% ∆ since assigning the boundary between the heavy- and severe-intensity domains based on a ixed % ∆ can result in dramatic variations in meta-bolic and physiological response proiles and in the exercise tolerance of diferent subjects. herefore, the purpose of this study was to determine the level of agreement between CP and 50% ∆ in untrained subjects. We hypothesized that the CP and 50% ∆ would be similar when the mean values of the two parameters are compared. On the other hand, when the limits of agreement described by Bland and Altman17 are considered, the
Subjects
Fifteen healthy male subjects (age: 26.0 ± 3.5 years; body weight: 76.6 ± 10.4 kg; height: 178.2 ± 7.6 cm) volunteered to participate in the study. he subjects participated in exercise at a recreational level and were familiar with cycle ergometry and the exercise testing procedures used in our laboratory. After they were fully informed about the risks and stresses associated with the study, the subjects gave their written informed consent to participate. he experimental protocol was approved by the Research Ethics Commit-tee of the Federal University of Santa Catarina (process number 2188) and was conducted in accordance with the Declaration of Helsinki.
Experimental design
he subjects were required to visit the laboratory on ive diferent occa-sions. First, they performed a submaximal step incremental test (four to six stages) to determine LT, followed by a maximal ramp incremental test for the measurement of VO2max and maximal power output (Pmax). During the following sessions, the subjects performed four randomized maximal constant work rate tests to exhaustion at 75%, 85%, 95% and 105% Pmax for determination of the curvature constant of the power-time relation-ship (W’) and CP. he pedal cadence was maintained between 70 and 75 rpm for all tests. he subjects were instructed to avoid any consumption of cafeine or alcohol and strenuous exercise in the 24 h preceding a test session and to arrive at the laboratory in a rested and fully hydrated state, at least 3 h postprandial. All tests were performed at the same time of day under controlled environmental laboratory conditions (temperature: 19-22°C; relative humidity: 50-60%) to minimize the efects of diurnal biological variation on the results18. With the exception of the submaximal
and maximal incremental exercise tests, which were performed on the same day, the subjects performed only one test on any given day. he tests were separated by intervals of 24-48 h but completed within a period of 2 weeks.
Equipment
Critical power estimation in cycling exercise Souza et al.
analyzer (YSL 2700 STAT, Yellow Springs, OH, USA). he analyzer was calibrated as recommended by the manufacturer.
Submaximal and maximal incremental exercise tests
First, each subject performed a submaximal step incremental test to deter-mine LT. he test started at 60 W and was increased by 20 W every 3 min during four to six stages. Capillary blood samples were collected within the inal 20 s of each stage for [La] determination. he LT was determined from the relationship between [La] and the work rate and was deined as the irst sudden and sustained increase in [La] above the baseline concen-trations12. After 30 min of rest, the subjects performed a maximal ramp
incremental test for the assessment of VO2max and Pmax. he test started at 90% LT during the irst 4 min and was thereafter continuously increased by a rate of 25 W.min-1 until the volitional exhaustion. Each subject was
verbally encouraged to undertake maximal efort. Breath-by-breath VO2 data were reduced to 15-s stationary averages and VO2max was deined as the highest average 15-s VO2 value recorded during the ramp incremental test. he attainment of VO2max was assumed using the criteria proposed by Midgley et al.19 and Poole et al.20. he P
max was deined as the highest work
rate attained in the ramp incremental test. he 50% ∆ was determined as the work rate corresponding to VO2 halfway between VO2LT and VO2max. he VO2 at 50% ∆ (VO250% ∆) was determined using the VO2-work rate relationship during the ramp incremental test.
Determination of CP and
W
’
he subjects performed four randomized maximal constant work rate tests until exhaustion at 75%, 85%, 95% and 105% Pmax. hese work rates were chosen to induce a time to exhaustion (tlim) ranging from 2 to 12 min5,8,21. Each test started with a 5-min warm-up at LT, followed by 5
min of rest. Further, after 3 min pedaling at 20 W, the power output was adjusted to one of the previously established work rates and the subjects were instructed to continue until they were unable to maintain the re-quired work rate. Timing began when the pedal cadence reached 70 rpm and stopped when the subject could no longer maintain a pedal cadence higher than 67 rpm despite verbal encouragement9. he t
lim was measured
to the nearest second. Individual W’ and CP estimates were derived from the four constant work rate prediction trials by least-squares itting of the following regression models:
a) nonlinear power output (P) vs. time to exhaustion (tlim):
tlim = W’ / (P - CP) (1);
b) linear work (W) vs. time to exhaustion (tlim):
W = (CP x tlim) + W’ (2);
c) linear power output (P) vs. 1 / time to exhaustion (tl i m): P = (W’ / t
error of the estimate (SEE) for CP8,22,23. Breath-by-breath VO
2 data were
recorded continuously during all tests and were reduced to 15-s stationary averages. he peak VO2 was deined as the highest average 15-s VO2 value recorded during the tests. he VO2 at CP (VO2CP) was determined using the VO2-work rate relationship during the ramp incremental test.
Statistical analysis
All data are expressed as the mean ± standard deviation. he Shapiro-Wilk test was applied to ensure a Gaussian distribution of the data. A paired Student t-test was used to compare CP and 50% ∆. he bias and limits of agreement between the two variables were calculated as described by Bland and Altman17. he Pearson product moment correlation coeicients were
used to assess the signiicance of relationships between the variables. All analyses were carried out using the GraphPad Prism software package for Windows (v.5.0, GraphPad Prism Software, Inc., San Diego, CA, USA). he level of signiicance was set at p < 0.05.
RESULTS
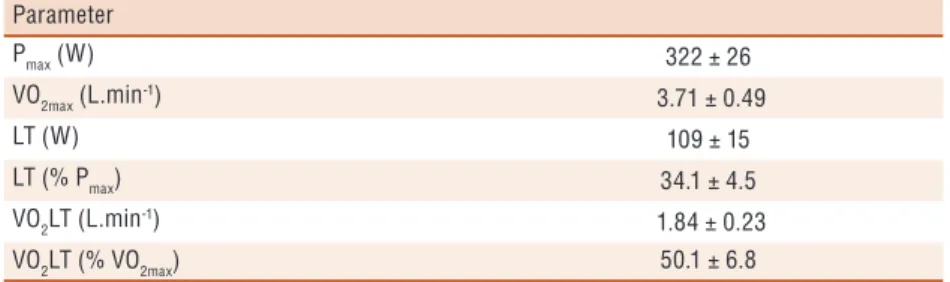
he values of Pmax, VO2max, LT and VO2LT determined during the incre-mental tests are shown in Table 1. he values of peak VO2 and tlim recorded during the constant work rate tests performed at 75%, 85%, 95% and 105% Pmax are shown in Table 2. As expected, peak VO2 in these constant work rate tests was not signiicantly diferent from the VO2max measured during the ramp incremental test (F = 1.74; p = 0.21).
Table 1. Physiological parameters determined during the incremental tests
Parameter
Pmax (W) 322 ± 26
VO2max (L.min-1)
3.71 ± 0.49
LT (W) 109 ± 15
LT (% Pmax) 34.1 ± 4.5
VO2LT (L.min-1)
1.84 ± 0.23
VO2LT (% VO2max) 50.1 ± 6.8
Pmax = maximal power output; VO2max = maximal oxygen uptake; LT = lactate threshold; VO2 = oxygen uptake.
Table 2.Oxyg en uptake and time to exhaustion in the constant work rate tests
% Pmax VO2 (L.min-1) t
lim (min)
75% Pmax 3.71 ± 0.45 10.5 ± 1.8
85% Pmax 3.69 ± 0.39 5.6 ± 1.2
95% Pmax 3.67 ± 0.50 3.8 ± 0.7
105% Pmax 3.54 ± 0.42 2.6 ± 0.5
Critical power estimation in cycling exercise Souza et al.
Table 3 shows the values of W’, CP, VO
2CP, 50% ∆, and VO250% ∆.
he goodness-of-it of the power-time relationship was r2 = 0.99 ± 0.01.
he SEE and 95% conidence interval associated with the estimated pa-rameters of the power-time relationship were 1.9 ± 1.2 kJ and 1.6 to 2.0 kJ, respectively, for W’ and 4 ± 3 W and 3 to 4 W for CP. In addition, CP was equivalent to 50.1 ± 7.9% ∆. hus, no signiicant diference was found between CP and 50% ∆ (t = 0.16; p = 0.87). Similarly, there was no signiicant diference between VO2CP and VO250% ∆ (t = 0.12; p = 0.90).
Table 3.Parameters derived from the power-time relationship and intensity corresponding to 50% ∆ Parameter
W’ (kJ) 21.3 ± 4.2
CP (W) 207 ± 17
CP (% Pmax) 64.3 ± 2.7
VO2CP (L.min-1) 2.78 ± 0.27
VO2CP (% VO2max) 75.2 ± 3.9
50% ∆ (W) 206 ± 19
50% ∆ (% Pmax) 64.1 ± 3.5
VO250% ∆ (L.min-1) 2.77 ± 0.29
VO250% ∆ (% VO2max) 75.1 ± 3.4
W’ = curvature constant of the power-time relationship; CP = critical power; Pmax = maximal power output; VO2max = maximal oxygen uptake; VO2 = oxygen uptake; 50% ∆ = work rate corresponding to VO2 halfway between VO2 at LT and VO2max.
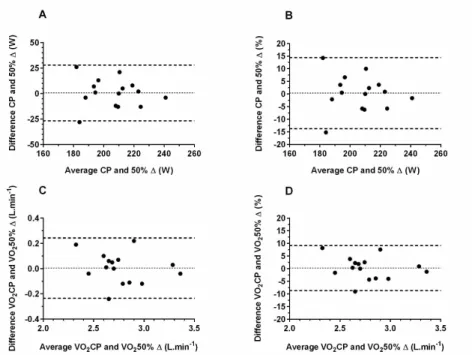
Figure 1 illustrates the bias ± 95% limits of agreement for comparison between CP and 50% ∆ (1 ± 27 W; 0.3 ± 14.1%) and between VO2CP and VO250% ∆ (0.01 ± 0.24 L.min-1; 0.2 ± 8.9%), respectively. he CP was
sig-niicantly correlated with 50% ∆ (Figure 2A; r = 0.70; p < 0.01). Likewise, VO2CP and VO250% ∆ were highly correlated (Figure 2B; r = 0.91; p < 0.01).
Figure 1. Bland-Altman plots of CP versus 50% ∆ (A and B) and VO2CP versus VO250% ∆ (C and
DISCUSSION
he purpose of this study was to investigate the relationship between CP and 50% ∆ in untrained subjects. To our knowledge, this was the irst study to assess the limits of agreement between the two exercise intensities. he paired Student t-test revealed no signiicant diference between CP and 50% ∆ either for work rate or VO2, suggesting that 50% ∆ can be used to determine the boundary between the heavy- and severe-intensity domains. However, the limits of agreement of Bland-Altman analysis showed that estimating CP by the calculation of 50% ∆ for a single subject could result in an error of up to ± 27 W or 14% (Figure 1). Obviously, the potential for error is particularly high and such estimates would be unwise if precision were needed in training prescription and experimental designs.
Individual agreement analysis indicated that CP was situated below the 50% ∆ (ranging from 12 to 28 W or from 6 to 16%) in four subjects and was above it in an additional six subjects (ranging from 5 to 26 W or from 2 to 13%). In the remaining subjects (n = 5), the 50% ∆ was found within an acceptable range of CP error calculation (less than or equal to the SEE for CP). his result clearly highlights signiicant interindividual variability when CP is estimated based on 50% ∆. herefore, assigning exercise intensity based on a ixed % ∆ might result in diferences in the metabolic and physiological stress experienced by diferent subjects.
Some physiological mechanisms associated with the aerobic nature of LT, CP and VO2max may help explain the interindividual variability in % ∆ corresponding to CP. hese mechanisms are likely to include muscle iber type composition, gas exchange and blood low characteristics, as well as muscle contractile and metabolic properties1,2. he dynamics of
these physiological mechanisms inluence the range of diference between VO2LT and VO2max1,2. In this respect, subjects with greater aerobic capacity
Critical power estimation in cycling exercise Souza et al.
fatigue-related metabolites can be both slower and lower during exercise1,2.
Interestingly, many of the landmark investigations of supra-LT VO2 kinetics used work rates determined by % ∆, mainly the work rate corre-sponding to 50% ∆1,2,12,14. However, the results of the present study indicate
that two subjects exercising at 50% ∆ might actually be in diferent exercise intensity domains. Consequently, the two subjects would demonstrate dif-ferent metabolic and physiological response proiles and tolerable duration of exercise. his is a matter of concern since experimental interventions such as ‘priming’ exercise and training, which depend on the exercise intensity domain investigated28,29, have been used in an attempt to determine the
main limiting factors of supra-LT VO2 kinetics and exercise tolerance. hus, especially in studies investigating topics such as VO2 kinetics and exercise tolerance, incorrect inferences and interpretations could be made when the exercise intensity is normalized by % ∆.
It is also known that CP typically occurs between approximately 40-60% ∆, with a mean of 50% ∆6,11. his is conirmed by the present data
since only two subjects of the 15 subjects studied had a CP outside this range (CP was equivalent to 32% and 64% ∆ in the two subjects). hus, according to Lansley et al.11, the prescription of exercise at ≤ 40% ∆ and ≥
60% ∆ should result in metabolic and physiological response proiles that are consistent with heavy- and severe-intensity exercise, respectively, in the majority of healthy subjects. However, considering some studies with small sample sizes (many studies have used seven subjects)12,21, any subject
with a CP outside this range could compromise the results. herefore, we propose the use of a “safety zone” of ± 20% ∆ from the 50% ∆ in studies that normalize the exercise intensity by the % ∆ method (i.e., 30% ∆ if heavy-intensity exercises are required and 70% ∆ for those intended to be severe intensity). Although inaccurate, this is a safer approach to ensure similar metabolic and physiological responses within the heavy- and severe-intensity exercise domains.
A limitation of the present study was the lack of rigorous control for nutrition, hydration and resting states of the subjects, especially during the constant work rate tests. However, the use of four predictive trials to model the power-time relationship resulted in SEE values of 1.9% and 8.9% for CP and W’, respectively. his is consistent with the proposed SEE values of less than 2% and 10% for CP and W’, respectively30. Additionally, the
indings and suggestions of the present study are restricted to cycling ex-ercise and untrained subjects, since CP occurs at a higher relative intensity in trained subjects3,9. Indeed, de Lucas et al.3 and Caputo and Denadai9
and populations.
CONCLUSION
In summary, CP was not signiicantly diferent from 50% ∆ (work rate and VO2) when the mean values were analyzed using an inferential statisti-cal approach. However, considering the limits of agreement between the two exercise intensities, CP estimated based on 50% ∆ might result in a remarkable error when the absolute variability of individual diferences is taken into account. We therefore do not recommend the interchangeable use of CP and 50% ∆ when exercise intensity accuracy is needed.
Acknowledgements
he authors thank all volunteers of this study for their time and efort.
REFERENCES
1. Poole DC, Jones AM. Oxygen uptake kinetics. Compr Physiol 2012;2(2):933-996.
2. Rossiter HB. Exercise: Kinetic considerations for gas exchange. Compr Physiol
2011;1(1):203-44.
3. de Lucas RD, Souza KM, Costa VP, Grossl T, Guglielmo LGA. Time to
exhaus-tion at and above critical power in trained cyclists: he relaexhaus-tionship between heavy and severe intensity domains. Sci Sports 2013;28(1):9-14.
4. Greco CC, Caputo F, Denadai BS. Critical power and maximal oxygen uptake:
Estimating the upper limit of the severe domain, a new challenge? Sci Sports 2008;23(5):216-22.
5. Chidnok W, Fulford J, Bailey SJ, Dimenna FJ, Skiba PF, Vanhatalo A, Jones
AM. Muscle metabolic determinants of exercise tolerance following exhaustion: relationship to the “critical power”. J Appl Physiol 2013;115(2):243-50.
6. Jones AM, Vanhatalo A, Burnley M, Morton RH, Poole DC. Critical power:
implications for the determination of VO2max and exercise tolerance. Med Sci Sports Exerc 2010;42(10):1876-90.
7. Jones AM, Wilkerson DP, DiMenna FJ, Fulford J, Poole D. Muscle metabolic
responses to exercise above and below the ‘critical power’ assessed using 31P-MRS. Am J Physiol Regul Integr Comp Physiol 2008;294(2):585-93.
8. Vanhatalo A, Fulford J, DiMenna FJ, Jones AM. Inluence of hyperoxia on muscle
metabolic responses and the power-duration relationship during severe-intensity exercise in humans: a 31P magnetic resonance spectroscopy study. Exp Physiol 2010;95(4):528-40.
9. Caputo F, Denadai BS. Does 75% of the diference between VO2 at lactate
thresh-old and VO2max lie at the severe-intensity domain in well-trained cyclists? Sci Sports 2009;24(5):257-61.
10. Carter H, Pringle JS, Jones AM, Doust JH. Oxygen uptake kinetics during treadmill
running across exercise intensity domains. Eur J Appl Physiol 2002;86(4):347-54.
11. Lansley KE, DiMenna FJ, Bailey SJ, Jones AM. A ‘new’ method to normalise
exercise intensity. Int J Sports Medicine 2011;32(7):535-41.
12. Carter H, Jones AM, Barstow TJ, Burnley M, Williams CA, Doust JH. Oxygen
Critical power estimation in cycling exercise Souza et al.
CORRESPONDING AUTHOR
Kristopher Mendes de Souza Universidade Federal de Santa Catarina, Centro de Desportos. Laboratório de Esforço Físico Campus Universitário, Trindade, CEP: 88040-900, Florianópolis (SC), Brazil.
E-mail: kristophersouza@yahoo. com.br
13. Burnley M, Doust JH, Vanhatalo A. A 3-min all-out test to determine peak oxygen
uptake and the maximal steady state. Med Sci Sports Exerc 2006;38(11):1995-2003.
14. DiMenna FJ, Jones, AM. “Linear” versus “nonlinear” VO2 responses to exercise:
reshaping traditional beliefs. J Exerc Sci Fit 2009;7(2):67-84.
15. Johnson TM, Sexton PJ, Placek AM, Murray SR, Pettitt RW. Reliability
analy-sis of the 3-min all-out exercise test for cycle ergometry. Med Sci Sports Exerc 2011;43(2):2375-80.
16. Vanhatalo A, Doust JH, Burnley M. Determination of critical power using a 3-min
all-out cycling test. Med Sci Sports Exerc 2007;39(3):548-55.
17. Bland JM, Altman DG. Statistical methods for assessing agreement between two
methods of clinical measurement. Lancet 1986;1(8476):307-10.
18. Atkinson G, Reilly T. Circadian variation in sports performance. Sports Med
1996;21(4):292-312.
19. Midgley AW, Carroll S, Marchant D, McNaughton LR, Siegler J. Evaluation of
true maximal oxygen uptake based on a novel set of standardized criteria. Appl Physiol Nutr Metab 2009;34(2):115-23.
20. Poole DC, Wilkerson DP, Jones AM. Validity of criteria for establishing maximal
O2 uptake during ramp exercise tests. Eur J Appl Physiol 2008;102(4):403-10.
21. Chidnok W, Dimenna FJ, Bailey SJ, Vanhatalo A, Morton RH, Wilkerson DP,
Jones AM. Exercise tolerance in intermittent cycling: application of the critical power concept. Med Sci Sports Exerc 2012;44(5):966-76.
22. Greco CC, Caritá RAC, Dekerle J, Denadai BS. Efect of aerobic training status
on both maximal lactate steady state and critical power. Appl Physiol Nutr Metab 2012;37(4):736-43.
23. Hill DW, Smith JC. A method to ensure the accuracy of estimates of anaerobic
capacity derived using the critical power concept. J Sports Med Phys Fitness 1994;34(1):23-37.
24. Hill DW, Poole DC, Smith JC. he relationship between power and time to achieve
VO2max. Med Sci Sports Exerc 2002;34(4):709-14.
25. Caputo F, Denadai BS. he highest intensity and the shortest duration permitting
attainment of maximal oxygen uptake during cycling: efects of diferent methods and aerobic itness level. Eur J Appl Physiol 2008;103(1):47-57.
26. Poole DC, Ward SA, Gardner GW, Whipp BJ. Metabolic and respiratory proile
of the upper limit for prolonged exercise in man. Ergonomics 1988;31(9):1265-79.
27. Poole DC, Ward SA, Whipp BJ. he efects of training on the metabolic and
respiratory proile of high-intensity cycle ergometer exercise. Eur J Appl Physiol Occup Physiol 1990;59(6):421-9.
28. Bailey SJ, Vanhatalo A, Wilkerson DP, DiMenna FJ, Jones AM. Optimizing
the ‘priming’ efect: inluence of prior exercise intensity and recovery duration on O2 uptake kinetics and severe- intensity exercise tolerance. J Appl Physiol 2009;107(6):1743-56.
29. Bailey SJ, Wilkerson DP, DiMenna FJ, Jones AM. Inluence of repeated sprint
training on pulmonary O2 uptake and muscle deoxygenation kinetics in humans. J Appl Physiol 2009;106(6):1875-87.
30. Ferguson C, Rossiter HB, Whipp BJ, Cathcart AJ, Murgatroyd SR, Ward SA.