J Appl Oral Sci.
255
ABSTRACT
Statistical results on restorative dentistry
experiments: effect of the interaction between
main variables
Andrea Nóbrega CAVALCANTI1, Giselle Maria MARCHI2, Gláucia Maria Bovi AMBROSANO3
1- DDS, MSc, PhD, Associate Professor, Department of Oral Rehabilitation, School of Dentistry, School of Medicine and Public Health of Bahia (EBMSP), Salvador, BA, Brazil.
2- DDS, MSc, PhD, Associate Professor, Department of Restorative Dentistry, Piracicaba Dental School, State University of Campinas, Piracicaba, SP, Brazil. 3- MSc, PhD, Full Professor, Department of Community Dentistry and Biostatistics, Piracicaba Dental School, State University of Campinas, Piracicaba, SP, Brazil.
Corresponding address: Andrea Nóbrega Cavalcanti - Av. Silveira Martins, 3386 - Cabula - Salvador, BA - Brasil - 41.150-100 - Phone/fax: +55-71-3257-8200 - e-mail: [email protected]
!"!#$!%&'(!"!)*!+',-'.//0'1'23%#4"56#37&'83$!)*!+'99-'.//:'1';""!<6!%&'=!*+>5+?'9@-'./9/
S
! "# "$!%&!'!%(#"#&"' )*+*) ! ",'&"#&!&$*" "$!%&-)%.&"'&#$")' "-$&*)#)!*$/0&1/)'& /)*)&"#& more than one main variable being studied in a research, the effect of the interaction between those variables is fundamental on experiments discussion. However, some .,23 #&$!'&,$$2*&4/)'& /)&+56!%2)&,7& /)&"' )*!$ ",'&"#&8*)! )*& /!'& /)&#"8'"-$!'$)&%)6)%0& Objective: To determine the most adequate interpretation for factorial experiments with +56!%2)#&,7& /)&"' )*!$ ",'&')!*%(&/"8/)*& /!'& /)&#"8'"-$!'$)&%)6)%0&9! )*"!%#&!'.&:) /,.#;& The p-values of the interactions found in two restorative dentistry experiments (0.053 and <0<=>?&4)*)&"' )*+*) ).&"'& 4,&."# "'$ &4!(#;&$,'#".)*"'8& /)&"' )*!$ ",'&!#&', &#"8'"-$!' & !'.&!#&#"8'"-$!' 0&@)#2% #;&A"77)*)' &-'."'8#&4)*)&,3#)*6).&3) 4))'& /)& 4,&!'!%(#)#B& !'.& # 2.")#& *)#2% #& 3)$!:)& :,*)& $,/)*)' & 4/)'& /)& #"8'"-$!' & "' )*!$ ",'& 4!#& 2#).0& Conclusion: The p-value of the interaction between main variables must be analyzed with caution because it can change the outcomes of research studies. Researchers are strongly advised to interpret carefully the results of their statistical analysis in order to discuss the -'."'8#&,7& /)"*&)C+)*":)' #&+*,+)*%(0Key words: Biostatistics. Dental research. Analysis of variance.
INTRODUCTION
Factorial experiments are those in which more than one main factor is studied. This type of statistical design is frequently employed on dental research2,3,8,9,11,13,15. The important feature behind
this experimental design is that the effects of a number of different main variables are investigated simultaneously, and all associations between the different variables are considered in the analysis. In the case of an experiment with two main variables, both presenting two levels of variation, the experiment is described as a 2x2 factorial experiment, and so on4.
The factorial experiment demonstrates advantages over other statistical designs7. It
)'!3%)#&)7-$")' &#":2% !'),2#&"'6)# "8! ",'&,7& 4,&
or more interventions, including all participants in their analyses. Also, in a factorial design it is
+,##"3%)& ,& $,'#".)*& /)& 3)')- #& ,7& *)$)"6"'8& !%%&
interventions together and the isolated effects of each intervention7,10,12.
The p-value indicates the probability of seeing the observed difference, or greater, just by chance if the null hypothesis is true. Values close to 0 indicate that the observed difference is unlikely to be due to chance, whereas a p-value close to 1 suggests that there is no difference between groups other than that due to random variation16. In a factorial
design, data calculations establish one p-value for each involved factor and another for the interaction between them.
D& #"8'"-$!' & "' )*!$ ",'& 3) 4))'& 4,& 7!$ ,*#&
indicates that the effect of one variable depends on the levels of the second variable14. As a general rule,
the interpretation of the p-value of the interaction
#/,2%.& 3)& .,')& -*# B& !'.& "7& /"#& +56!%2)& "#& ', & #"8'"-$!' B& /)'& /)&:!"'&)77)$ #&$,2%.&3)&)C!:"').&
www.scielo.br/jaos
J Appl Oral Sci.
256
separately140&E,4)6)*B&*)#)!*$/)*#&#,:) ":)#&-'.&
/)& *)#2% #& ,7& !& 7!$ ,*"!%& )C+)*":)' & ."7-$2% & ,&
interpret, especially when there are multiple main variables included in the experimental design. In addition, there is always a controversy on how to interpret the p-value of the interaction, when it is
')!*%(&8*)! )*& /!'& /)&#"8'"-$!'$)&%)6)%&F"0)0&GHIJ& K&GH<0<I?0&L'&,*.)*& ,&.) )*:"')& /)&:,# &!.)M2! )&
interpretation for factorial experiments, the aim of the present study was to analyze p-values from the interaction nearly greater than 0.05 in two distinct
4!(#;&$,'#".)*"'8& /)&"' )*!$ ",'&!#&', &#"8'"-$!' & !'.&!#&#"8'"-$!' 0&N/)& )# ).&/(+, /)#"#&4!#& /! & $,'#".)*"'8& #2$/& +56!%2)#& !#& #"8'"-$!' & "'.2$)#&
more realistic data interpretation.
MATERIAL AND METHODS
Two restorative dentistry experiments with the p-value from the interaction nearly greater than
/)& #"8'"7"$!'$)& %)6)%& FGH<0<I?& 4)*)& #)%)$ ).0&
Two approaches were investigated: assuming no interaction, and presupposing a significant interaction.
!"#$%&#'()*+,#-%.'
L'& /)&-*# &# 2.(B&=<&*)# ,*! ",'#&,'&3,6"')& )) /&
were used as experimental units. The main effects tested were: bonding system [3 levels of variation:
O"'8%)&P,'.&FQ9&ROSRB&O 0&S!2%B&9TB&UOD?B&V%)!*-%&
SE Bond (Kuraray, Tokyo, Japan), OptiBond Solo Plus (Kerr Corp., Orange, CA, USA)] and aging procedure (2 levels of variation: mechanical and mechanical-thermal). This study represented a 3 x
2 factorial design. The dependent variable was the tensile bond strength (TBS) in MPa.
The experimental units of the second study were 60 composite resin blocks. The main effects were: composite resin (3 levels of variation: hybrid,
:"$*,/(3*".B&:"$*,-%%).?&!'.&$2*"'8& ":)&FW&%)6)%#&,7&
variation – 20 s and 60 s) – a 3x2 factorial design. The dependent variable was the Knoop hardness number (KHN).
Results from both experiments were evaluated
7,*&# ! "# "$!%&#"8'"-$!'$)&2#"'8& 4,54!(&DTXYD&!'.&
Tukey’s test for multiple comparisons. All statistical analyses were conducted using SAS 8.0 software (SAS Institute, Cary, NC, USA).
RESULTS
In the TBS experiment, the p-value of the interaction was 0.053. When this interaction was
$,'#".)*).&', &#"8'"-$!' B&,'%(& /)&7!$ ,*&3,'."'8& #(# ):&+*)#)' ).&!&# ! "# "$!%&#"8'"-$!'$)B&!'.& /)& V%)!*-%&OR&P,'.&#(# ):&+*)#)' ).&3,'.&# *)'8 /& :)!'#&#"8'"-$!' %(&%,4)*& /!'& /)&, /)*&#(# ):#0&
Even though the effect of the aging procedure on restorations bond strength seemed clear when Single Bond means were observed, this effect was
', &# ! "# "$!%%(&#"8'"-$!' &FN!3%)&Z?0&
On the other hand, results changed considerably
4/)'& /"#&"' )*!$ ",'&4!#&"' )*+*) ).&!#&#"8'"-$!' 0&
In this ultimate analysis, differences were observed between bonding systems and also between aging conditions (Table 2). The mean bond strength of
V%)!*-%&OR&P,'.&#(# ):&*):!"').&%,4)*& /!'& /,#)&
of the other systems. In addition, the effect of
Aging Procedure Bonding systems
Single Bond AB!5+4B'CD'E37% OptiBond Solo
Mechanical 32.61 (6.84) 24.21 (6.78) 27.63 (4.63) a Mechanical + Thermal 25.86 (7.39) 20.08 (5.39) 25.87 (5.36) a
A B A
Table 1- Mean (standard deviation) obtained in experiment 1. Statistical analysis considering the p-value of the interaction
!""#$#%&' (#&&#$)' $#*$#)#%&' )&+&!)&!,+((-' )!.%!/,+%&' 0!""#$#%,#)' 123453+-' 67896' :' 2;<#-' &#)&=' >?@ABC' D**#$,+)#' (#&&#$)' ,4E*+$#'+0F#)!G#')-)&#E)'+%0'(43#$,+)#'(#&&#$)',4E*+$#'+.!%.'*$4,#0;$#)C
Aging Procedure Bonding systems
Single Bond AB!5+4B'CD'E37% OptiBond Solo
Mechanical 32.61 (6.84) Aa 24.21 (6.78) Ab 27.63 (4.63) Aa a Mechanical + Thermal 25.86 (7.39) Ba 20.08 (5.39) Ab 25.87 (5.36) Aa a
Table 2- Mean (standard deviation) obtained in experiment 1. Statistical analysis considering the p-value of the interaction
!""#$#%&' (#&&#$)' $#*$#)#%&' )&+&!)&!,+((-' )!.%!/,+%&' 0!""#$#%,#)' 123453+-' 67896' :' 2;<#-' &#)&=' >?@ABC' D**#$,+)#' (#&&#$)' ,4E*+$#'+.!%.'*$4,#0;$#)'+%0'(43#$,+)#'(#&&#$)',4E*+$#'+0F#)!G#')-)&#E)C
Statistical results on restorative dentistry experiments: effect of the interaction between main variables
J Appl Oral Sci.
257
the aging procedure on Single Bond system bond strength that was not detected in the previous analysis was then considered as statistically
#"8'"-$!' 0
In the hardness experiment, the p-value of the interaction was 0.068. When this interaction was
$,'#".)*).& ', & #"8'"-$!' B& /)& /(3*".& $,:+,#" )& +*)#)' ).& #"8'"-$!' %(& /"8/)*& [ET& $,:+!*).& ,&
the other composites (Table 3). However, the levels of the factor curing time were statistically similar, meaning that composites presented the same behavior at the two curing times.
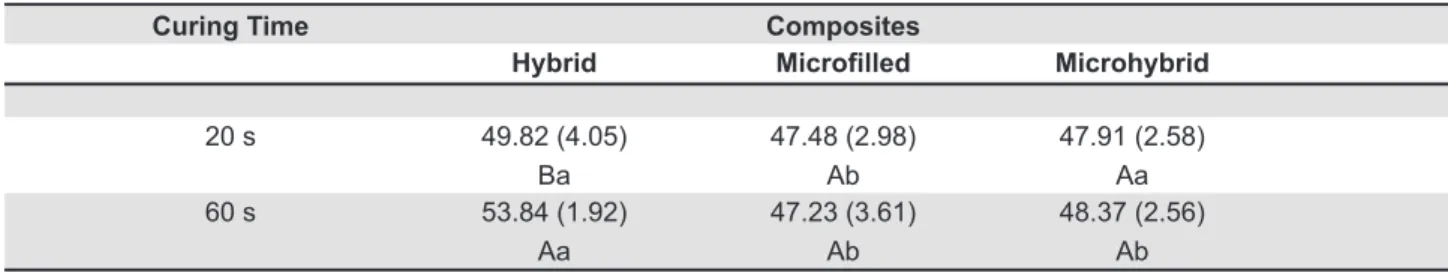
In the second analysis, considering the
"' )*!$ ",'&!#&#"8'"-$!' \&."77)*)'$)#&4)*)&,3#)*6).&
among composite resins and between curing times (Table 4). When cured for 20 s, the hybrid and the microhybrid composites presented similar
[ETB&!'.&3, /&4)*)&."77)*)' &7*,:& /)&:"$*,-%%).&
composite. When cured for 60 s, the hybrid composite presented significantly higher KHN compared to the other composites. The curing time
4!#&# ! "# "$!%%(&#"8'"-$!' &7,*& /)&/(3*".&$,:+,#" )B&
which presented higher mean after being cured for 60 s. The other composites were not affected by the curing time.
DISCUSSION
Research validity depends on the proper analysis and interpretation of collected data. However, there are some controversial issues regarding statistical analysis that can dramatically change study’s
conclusions, for example, the interpretation of the interaction between main variables. Usually, if a factorial design is selected for data assessment, researchers are probably expecting to find a dependent relationship between main variables. When this relationship is not an important issue, however, other statistical designs can be selected, for example, one-way ANOVA. This is why the p-value of the interaction becomes so important in a factorial analysis. Nevertheless, when this p-value is nearly greater than 0.05, researchers can doubt if
/"#&6!%2)&$!'&3)&$,'#".)*).&# ! "# "$!%%(&#"8'"-$!' 0
A common approach in the analysis of factorial trials is to assume p-values higher than the level
,7& #"8'"-$!'$)& !#& ', & #"8'"-$!' 0& N/)*)7,*)B& /)&
interaction analysis is not adjusted for multiple
)# "'80&R6)'&#"8'"-$!' &"' )*!$ ",'#&!*)&7*)M2)' %(&
ignored because some researchers seem to believe that the interpretation of the main effects separately could make data interpretation easier.
According to the findings of the present study, adjusting the interaction for multiple comparisons, even if the p-value is nearly greater than 0.05, provide considerably changes in experiments outcomes. In both experimental studies investigated, the interpretation of the significant interaction was advantageous for
*)#2% #& ."#$2##",'0& R6)'& /,28/& " & "#& ."7-$2% & ,&
interpret the results from a factorial study with an
"']2)' "!%&"' )*!$ ",'B& /)&:!"'&!.6!' !8)&,7$/& # ! "# "$!%&.)#"8'&"#& /)&)7-$")' &!'.&#":2% !'),2#&
investigation of two or more interventions7. In
Curing Time Composites
Hybrid 2#"+34BB!% Microhybrid
20 s 49.82 (4.05) 47.48 (2.98) 47.91 (2.58) a
60 s 53.84 (1.92) 47.23 (3.61) 48.37 (2.56) a
A B B
Table 3- Mean (standard deviation) obtained in experiment 2. Statistical analysis considering the p-value of the interaction
!""#$#%&' (#&&#$)' $#*$#)#%&' )&+&!)&!,+((-' )!.%!/,+%&' 0!""#$#%,#)' 123453+-' 67896' :' 2;<#-' &#)&=' >?@ABC' D**#$,+)#' (#&&#$)' ,4E*+$#',4E*4)!&#)'+%0'(43#$,+)#'(#&&#$)',4E*+$#',;$!%.'&!E#)C
Curing Time Composites
Hybrid 2#"+34BB!% Microhybrid
20 s 49.82 (4.05) Ba
47.48 (2.98) Ab
47.91 (2.58) Aa 60 s 53.84 (1.92)
Aa
47.23 (3.61) Ab
48.37 (2.56) Ab
Table 4- Mean (standard deviation) obtained in experiment 2. Statistical analysis considering the p-value of the interaction
!""#$#%&' (#&&#$)' $#*$#)#%&' )&+&!)&!,+((-' )!.%!/,+%&' 0!""#$#%,#)' 123453+-'67896' :' 2;<#-' &#)&=' >?@ABC' D**#$,+)#' (#&&#$)' ,4E*+$#',;$!%.'&!E#)'+%0'(43#$,+)#'(#&&#$)',4E*+$#',4E*4)!&#)C
CAVALCANTI AN, MARCHI GM, AMBROSANO GMB
J Appl Oral Sci.
258
addition, this problem in interpreting results can be easily solved with continuous experience in similar analysis.
The sample size is an important issue for factorial designs when an interaction is being expected. If a study does not present an adequate power to detect an interaction, its sample size will have to be increased. With no increase in sample size, the interaction would need to be at least twice as large as the main effects to be detected with the same power1,5-7. Thus, researchers should appraise if a
', &#"8'"-$!' &"' )*!$ ",'&4,2%.&+*)#)' &!&."77)*)' &
result if larger sample sizes were used.
Based on the results of this study, it can be suggested that the association between researchers and statisticians is fundamental for the establishment of the most adequate strategy to test experimental hypothesis. While researchers must decide which questions their experiments should answer, statisticians must determine the more adequate statistical method to achieve these objectives. In addition, considering the broad number of relevant information regarding data collection and analysis that can be brought by the p-value, researches should be strongly advised to indicate the exact value obtained rather than the discrimination of p-value greater or lower than 0.05.
CONCLUSION
Within the limitations of this study, it may be concluded that analyses presented more reliable and realistic results when the p-value of interaction
4!#&$,'#".)*).&!#&#"8'"-$!' B&)6)'& /,28/&" &4!#& #%"8/ %(&8*)! )*& /!'& /)&#"8'"-$!'$)&%)6)%0&N/2#B& /)&
hypothesis tested in this investigation was proven to be true.
REFERENCES
1- Brookes ST, Whitley E, Peters TJ, Mulheran PA, Egger M, Davey Smith G. Subgroup analyses in randomised controlled trials: quantifying the risks of false-positives and false-negatives. Health Technol Assess. 2001;5(33):1-56.
2- Cavalcanti AN, Mitsui FH, Ambrosano GM, Marchi GM.
L']2)'$)& ,7& !./)#"6)& #(# ):#& !'.& ],4!3%)& $,:+,#" )& %"'"'8&
on bond strength of class II restorations submitted to thermal and mechanical stresses. J Biomed Mater Res B Appl Biomater. 2007;80(1):52-8.
3- Chaves CAL, Melo RM, Passos SP, Camargo FP, Bottino MA, Balducci I. Bond strength durability of self-etching adhesives and resin cements to dentin. J Appl Oral Sci. 2009;17(3):155-60. 4- Cochran WG, Cox GM. Experimental designs. Indianapolis: John Wiley & Sons; 1992.
5- Edginton AN, Sheridan PM, Boermans HJ, Thompson DG, Holt JD, Stephenson GR. A comparison of two factorial designs, a complete 3 x 3 factorial and a central composite rotatable design, for use in binomial response experiments in aquatic toxicology. Arch Environ Contam Toxicol. 2004;46(2):216-23.
6- Green S, Liu PY, O'Sullivan J. Factorial design considerations. J Clin Oncol. 2002;20(16):3424-30.
7- Hutchins M, Housholder G, Suchina J, Rittman B, Rittman G, Montgomery E. Comparison of acetaminophen, ibuprofen, and nabumetone therapy in rats with pulpal pathosis. J Endod. 1999;25(12):804-6.
8- Lopes MB, Sinhoreti MA, Correr-Sobrinho L, Consani S. Comparative study of the dental substrate used in shear bond strength tests. Braz Oral Res. 2003;17(2):171-5.
9- Mitsui FH, Peris AR, Cavalcanti AN, Marchi GM, Pimenta LA.
L']2)'$)&,7& /)*:!%&!'.&:)$/!'"$!%&%,!.&$($%"'8&,'&:"$*, )'#"%)&
bond strengths of total and self-etching adhesive systems. Oper Dent. 2006;31(2):240-7.
10- Nagamatsu Y, Chen KK, Tajima K, Kakigawa H, Kozono Y. Durability of bactericidal activity in electrolyzed neutral water by storage. Dent Mater J. 2002;21(2):93-104.
11- Reis AF, Giannini M, Kavaguchi A, Soares CJ, Line SR. Comparison of microtensile bond strength to enamel and dentin of human, bovine, and porcine teeth. J Adhes Dent. 2004;6(2):117-21.
12- Ren S, Mee RW, Frymier PD. Using factorial experiments to study the toxicity of metal mixtures. Ecotoxicol Environ Saf. 2004;59(1):38-43.
13- Scheibe KG, Almeida KG, Medeiros IS, Costa JF, Alves CM. Effect of different polishing systems on the surface roughness of microhybrid composites. J Appl Oral Sci. 2009;17(1):21-6. 14- Triola MF. Elementary statistics. Boston: Addison-Wesley; 1998.
15- Uceda-Gómez N, Reis A, Carrilho MRO, Loguercio AD, Rodrigues Filho LE. Effect of sodium hypochlorite on the bond
# *)'8 /&,7&!'&!./)#"6)&#(# ):& ,+)*-$"!%&!'.&.))+&.)' "'0&^&
Appl Oral Sci. 2003;11(3):223-8.
16- Whitley E, Ball J. Statistics review 3: hypothesis testing and P values. Crit Care. 2002;6(3):222-5.
Statistical results on restorative dentistry experiments: effect of the interaction between main variables