Capture Microdissection Study
Laura W. Harris1., Matthew Wayland1., Martin Lan1., Margaret Ryan1., Thomas Giger2
, Helen
Lockstone1, Irene Wuethrich1, Michael Mimmack1, Lan Wang1, Mark Kotter3, Rachel Craddock1, Sabine Bahn1*
1Department of Chemical Engineering and Biotechnology, University of Cambridge, Cambridge, United Kingdom,2Max Planck Institute for Evolutionary Anthropology, Leipzig, Germany,3Cambridge Centre for Brain Repair, Department of Veterinary Medicine, University of Cambridge, Cambridge, United Kingdom
Abstract
Background:Previous studies of brain and peripheral tissues in schizophrenia patients have indicated impaired energy supply to the brain. A number of studies have also demonstrated dysfunction of the microvasculature in schizophrenia patients. Together these findings are consistent with a hypothesis of blood-brain barrier dysfunction in schizophrenia. In this study, we have investigated the cerebral vascular endothelium of schizophrenia patients at the level of transcriptomics.
Methodology/Principal Findings:We used laser capture microdissection to isolate both microvascular endothelial cells and neurons from post mortem brain tissue from schizophrenia patients and healthy controls. RNA was isolated from these cell populations, amplified, and analysed using two independent microarray platforms, Affymetrix HG133plus2.0 GeneChips and CodeLink Whole Human Genome arrays. In the first instance, we used the dataset to compare the neuronal and endothelial data, in order to demonstrate that the predicted differences between cell types could be detected using this methodology. We then compared neuronal and endothelial data separately between schizophrenic subjects and controls. Analysis of the endothelial samples showed differences in gene expression between schizophrenics and controls which were reproducible in a second microarray platform. Functional profiling revealed that these changes were primarily found in genes relating to inflammatory processes.
Conclusions/Significance:This study provides preliminary evidence of molecular alterations of the cerebral microvascu-lature in schizophrenia patients, suggestive of a hypo-inflammatory state in this tissue type. Further investigation of the blood-brain barrier in schizophrenia is warranted.
Citation:Harris LW, Wayland M, Lan M, Ryan M, Giger T, et al. (2008) The Cerebral Microvasculature in Schizophrenia: A Laser Capture Microdissection Study. PLoS ONE 3(12): e3964. doi:10.1371/journal.pone.0003964
Editor:Kenji Hashimoto, Chiba University Center for Forensic Mental Health, Japan ReceivedAugust 27, 2008;AcceptedNovember 17, 2008;PublishedDecember 17, 2008
Copyright:ß2008 Wiseman Harris et al. This is an open-access article distributed under the terms of the Creative Commons Attribution License, which permits unrestricted use, distribution, and reproduction in any medium, provided the original author and source are credited.
Funding:This study was funded as part of the Molecular Evolution of Human Cognition project (EU Sixth Framework Programme grant PKB 140404). The Stanley Medical Research Institute (SMRI) provided centre support. GE Healthcare UK provided CodeLink Human Whole Genome Bioarrays. ML is the recipient of an NIH-Cambridge health scholarship. MR is the recipient of a NARSAD Young Investigator Award. SB holds a NARSAD Essel Independent Investigator Fellowship. The funders had no role in study design, data collection and analysis, decision to publish, or preparation of the manuscript.
Competing Interests:The authors have declared that no competing interests exist. * E-mail: [email protected]
.These authors contributed equally to this work.
Introduction
Despite decades of research and numerous competing hypoth-eses, our understanding of the pathophysiology of schizophrenia remains unclear, with adverse consequences for both diagnosis and treatment. In recent years an increasing body of evidence has pointed towards altered glucose metabolism in schizophrenic patients. In addition to the major findings of hypofrontality in patients obtained using brain imaging methods [1], numerous post mortem studies have shown alterations in the expression of genes and proteins involved in major energy metabolism pathways [2– 6], and studies of peripheral tissues have also detected metabolic alterations in first onset and drug naı¨ve patients [7,8]. Examina-tion of these data suggests an abnormality in glucose utilizaExamina-tion in the brains of patients which may arise from impaired supply of energy substrates such as glucose and lactate [5,7]. Such findings
are consistent with an hypothesis of blood-brain barrier impair-ment in schizophrenia [9]. This hypothesis proposes that disruption in the coupling of cerebral blood flow to neuronal metabolic needs may be upstream of all conceivable functional neuronal abnormalities in schizophrenia.
between schizophrenic and control subjects [19], but the authors reconcile these two apparently conflicting findings by proposing dysfunction of the cerebral microvasculature at a molecular, rather than structural level. However, few if any molecular studies of the cerebral vasculature in schizophrenia have been attempted, and existing quantitative molecular studies based on tissue homogenate or sections are unlikely to include a signal from the relevant cells as vasculature accounts for only 0.1% of whole brain tissue [20].
In this study we have attempted to characterise the cerebral microvasculature of schizophrenia patients by using laser micro-dissection to isolate cells from post mortem prefrontal cortex tissue. Laser microdissection has been widely touted as a major advance in molecular brain research [21], but has rarely [2,22] been applied to the human postmortem brain due to the technical challenges raised by working with small amounts of tissue and the variability that may be introduced at various stages of the analytical process. Thus as a first step to check the integrity of the data, we compared data from endothelial cells to data from neurons in order to demonstrate whether the predicted differences between these two cells types could be detected. We then proceeded to investigate gene expression differences in these cell types in schizophrenia using microarrays. Although microarray technology has been demonstrated to be robust and reproducible in careful hands, validation of the results at the technical level is essential to increase confidence in a study. Quantitative real-time PCR, the most commonly used validation tool, is limited in that only a small number of genes can practically be measured within a single study, and the necessity to normalize to a so-called ‘‘housekeeping’’ gene introduces high levels of experimental noise. Thus in the present study we have taken the approach of using two array platforms, each possessing different probe design, synthesis and attachment strategies and different hybridization kinetics and lab procedure. Using this approach not only can mRNA levels be validated, but also differences in microarray methodology, normalization and data processing methods.
Methods
Tissue collection
Consent: Human brain tissue was obtained from the Array collection of the Stanley Medical Research Institute (Bethesda,
USA). Tissue was collectedpost mortemfrom patients and controls with full informed consent obtained from a first degree relative after death in compliance with the Declaration of Helsinki. The consent was obtained by questionnaires conducted over the phone and signed by two witnesses. All patient data are anonymised. Exemption from IRB approval was granted by the Uniformed Services University of Health Sciences IRB on the grounds that specimens were obtained via informed donation from cadaveric material in accordance with federal and state regulations, the research did not encompass genetic linkage studies, and all samples were de-identified and personal information anonymised. Fresh-frozen gray matter tissue from dorsolateral prefrontal cortex (Brodmann area 9) of 12 schizophrenia patients and 12 matched control individuals was used in the study. The cell type analysis also included 12 subjects with bipolar disorder (see Supplementary Information S1).
Laser capture microdissection
PALM RNA extraction kit (Zeiss) and amplified through 2 rounds using the RiboAmp HS kit (Arcturus). The resulting aRNA was assessed on an Agilent Bioanalyser Nanochip to determine length of RNA transcripts in the samples. aRNA profiles with jagged curves or pronounced skews to the left, indicating degradation of the RNA, were eliminated from the analysis.
Microarray hybridisation
Amplified RNA was converted to cDNA using Round 2 components of the RiboAmp HS kit, labelled by in vitro
transcription in the presence of biotinylated UTP (Codelink Expression Assay kit, GE Healthcare), and purified using YM-30 columns (Microcon).
Labelled RNA was hybridised to both Affymetrix and Codelink chips according to manufacturers’ recommendations. Balanced numbers of patient and control samples were included in each hybridisation batch.
Data analysis
All datasets (endothelial and neuronal, disease and control samples) were subjected to normalisation and quality control measures together, within each array platform. Only samples which passed quality control on both platforms were included in the final dataset, to facilitate cross-platform validation. An outline of the data analysis workflow is shown in Fig 2.
Affymetrix arrays
Data pre-processing. Quality control protocols for Affymetrix microarray data derived from human postmortem brains were applied as previously described [24], and samples which did not pass were removed from the dataset. Expression measures were
computed for each of the probesets on each of the GeneChips in the dataset using the robust multichip average (RMA) method [25], which is implemented in the BioConductor package ‘Affy’ [26]. The ‘Affy’ package was also used to generate RNA digestion plots which allow any 59 to 39 trend to be visualized. A linear regression of expression values on the logarithm (base 2) of slope of the RNA digestion plots for each probeset was performed and the residuals from the regression were assigned as expression values for further analysis. This transformation effectively corrected for any systematic error in the data introduced by 39 signal bias and significantly improved the quality of the data (see Supplementary Information S1). Following transformation, all 54647 probes were included in the analysis. The data have been submitted to GEO (www.ncbi.nlm.nih. gov/geo/), accession numbers GSM318410-GSM318441; series record GSE12679.
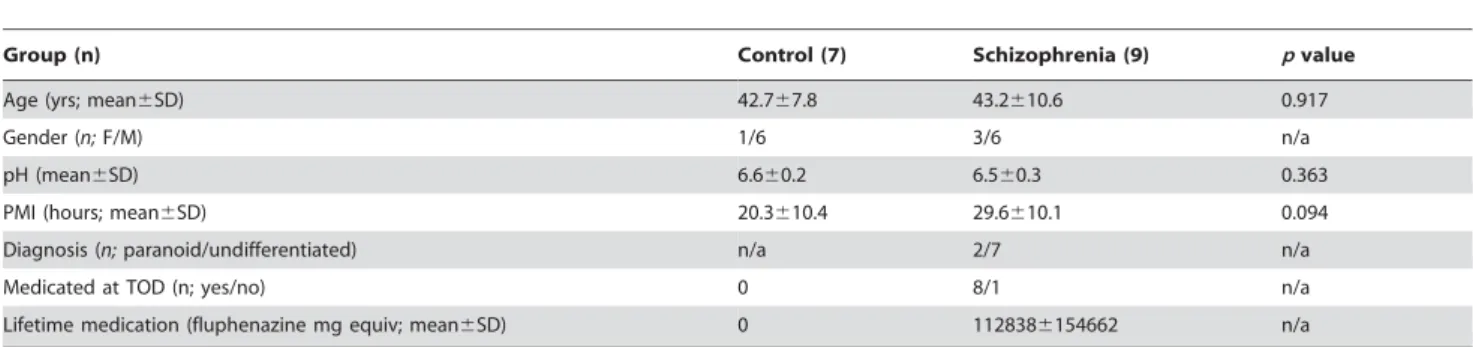
Demographics. Demographic variables for the disease-based analysis are shown in Tables 1 & 2. No significant differences between patients and controls were found for pH, PMI or age in either cell type. The distribution of demographic variables for the cell-type analysis can be found in Supplementary Information S1. LIMMA. A Bayesian moderated t-test was applied to identify differentially expressed genes as implemented in the LIMMA (linear models for microarray analysis) package [27] from Bioconductor. Firstly, pre-processed Affymetrix datasets were collapsed to the probeset with the maximum expression value for each gene using the Gene Set Enrichment Analysis software (details below). Differentially expressed genes were then identified using the LIMMA package and raw p-values were adjusted for multiple hypothesis testing using the false discovery rate (FDR) method of Benjamini and Hochberg [28].
Functional profiling. Two complimentary approaches to gene set analysis were employed. Both methods investigated all Figure 2. Diagram showing overview of experimental workflow.
‘‘biological process’’ categories as defined by the Gene Ontology consortium (GO). The default GSEA significance threshold of
q,0.25 (after controlling the false discovery rate) was used for all functional analyses.
GSEA. The GSEA algorithm examines a ranked list of all genes on the chip, and identifies whether members of a gene category are enriched at either the top or bottom, using a modified Kolmogorov-Smirnov statistic. GSEA was carried out following the recommendations of the authors [29,30]. Pre-processed expression data was inputted to the GSEA software and collapsed to the probe with the maximum expression level for each gene prior to analysis. Genes were ranked by fold change calculated using the ‘‘difference of class means’’ metric implemented in the GSEA software, such that genes ranked towards the top of the list are considered enriched in one sample group and genes ranked at the bottom are considered enriched in the other. Enrichment scores were calculated using the weighted enrichment statistic, and significance levels calculated by permuting phenotype labels 1000 times. Gene set size filters were set to exclude gene sets containing fewer than 25, or greater than 500 members. All other parameters were set to GSEA defaults.
In the schizophrenia versus control analysis the gene sets investigated comprised the complete list of human biological process categories present on the U133 Plus 2.0 array as defined by the GO consortium (subject to filters as described above; around 3000 categories in total). Some categories represent closely related functions and in addition, multifunctional genes may be annotated in more than one category. GSEA examines each gene
set independently and hence multiple categories annotated to the same or similar genes can arise due to the hierarchical nature of the GO database. We therefore used the leading edge analysis tool within GSEA to identify related sets, i.e. those in which the significance is driven by an overlapping subset of genes (the ‘‘leading edge’’).
OntoExpress. The OntoExpress software uses an algorithm which examines a predetermined list of significant genes and identifies categories of genes which are over or under represented in this list relative to their representation on the entire chip. Following LIMMA analysis genes were ranked in order of t statistic. A list of the top 2% of genes most significantly up- and down-regulated (this included 402 genes from the Affymetrix dataset corresponding to a p value cutoff of 0.027 among the upregulated genes and 0.047 among the downregulated genes) were analysed separately using OntoExpress, using default settings (hypergeometric distribution and FDR (Benjamini-Hochberg) correction) and the Affymetrix human HG-U133 Plus 2.0 array as reference. Categories which had at least 3 members were considered in the analysis.
Codelink arrays
Data preprocessing. Image analysis and feature extraction was performed using the proprietary Amersham CodeLink Bioarray software (GE Healthcare). A flag-based noise filter was applied such that probes were retained for further analysis which had a ‘‘good’’ flag in a minimum number of arrays corresponding to the smallest sample group tested (eg where there were 12 control and 12 schizophrenia samples, the filter was set to retain Table 1.Endothelial sample demographics.
Group (n) Control (7) Schizophrenia (9) pvalue
Age (yrs; mean6SD) 42.767.8 43.2610.6 0.917
Gender (n;F/M) 1/6 3/6 n/a
pH (mean6SD) 6.660.2 6.560.3 0.363
PMI (hours; mean6SD) 20.3610.4 29.6610.1 0.094
Diagnosis (n;paranoid/undifferentiated) n/a 2/7 n/a
Medicated at TOD (n; yes/no) 0 8/1 n/a
Lifetime medication (fluphenazine mg equiv; mean6SD) 0 1128386154662 n/a
Demographic variables for endothelial samples included in the disease-based analysis (F: female; M: male; PMI: post mortem interval; SD: standard deviation; TOD: time of death).
doi:10.1371/journal.pone.0003964.t001
Table 2.Neuronal sample demographics.
Group (n) Control (6) Schizophrenia (5) pvalue
Age (yrs; mean6SD) 41.267.2 45.065.4 0.353
Gender (n;F/M) 2/4 2/3 n/a
pH (mean6SD) 6.660.2 6.660.1 0.682
PMI (hours; mean6SD) 30.0618.6 28.467.9 0.862
Diagnosis (n;paranoid/undifferentiated) n/a 1/4 n/a
Medicated at TOD (n;yes/no) 0 4/1 n/a
Lifetime medication (fluphenazine mg equiv; mean6SD) 0 44010635056 n/a
Demographic variables for neuronal samples included in the disease-based analysis (F: female; M: male; PMI: post mortem interval; SD: standard deviation; TOD: time of death).
probes which had a ‘‘good’’ flag in at least 12 samples). This step was carried out independently for the cell-type and disease analyses. The spot mean signal intensities for probes passing the filter were quantile normalized [31] to generate gene expression measures. Outlier removal was carried out based on a correlation matrix generated from all possible pairwise comparisons between arrays using Pearson’s product-moment correlation coefficient as the metric. Poorly correlating arrays were removed from the analysis. After removing outliers, the flag-based noise filter and normalisation process were re-applied. The final dataset for the cell type analysis (all samples) contained 10487 probes. For the disease-based analysis endothelial and neuronal samples were normalised separately and the final dataset contained 8846 probes for the endothelial samples and 14262 probes for the neuronal samples. Due to the much reduced number of probes on the Codelink arrays compared to the Affymetrix arrays, Codelink arrays were used solely for validation purposes and not for the primary analysis.
Cross platform validation
Data were cross-validated between array platforms using GSEA and the method of Cheadle et al (2006) [32]. This method was developed to examine the entire dataset, taking into account the differences in absolute mRNA quantitation which often occur between array platforms. Following one microarray analysis, the most significantly altered genes are used to create a category. Data from an alternative microarray platform are then probed with this category. If the data are reproducible in the second platform, the category should be significantly enriched in the predicted direction. Datasets were collapsed to the maximum probe level per gene using GSEA, filtered to those genes which were present across both platforms and ranked using the GSEA metric ‘‘difference of class means’’. The 200 top and bottom ranking genes from each array platform were each used to create a gene set. We then determined whether the top ranking genes from each platform showed enrichment in the same direction in the other platform, using the GSEA parameters described above.
Results
Cell type analysis
As an initial assessment of the biological validity of the data, we compiled a list of biological processes, as defined by the Gene Ontology Consortium, likely to be specific to one cell type or the other, using the search terms ‘‘neuron’’, ’’neurotransmitter’’ and ‘‘synapse’’ plus ‘‘endothelial’’, and ‘‘angiogenesis’’. Due to the small number of categories found to be endothelial-related, we also included cell proliferation as an endothelial-related category, as there is no published evidence for neurogenesis in the adult prefrontal cortex [33]. These categories were tested for enrich-ment in the Affymetrix data using GSEA. All endothelial categories were found to be significantly enriched in the endothelial data, and all neuronal categories were found to be significantly enriched in the neuronal data (q,0.25; Table 3). Additionally we chose a panel of six genes expected from the literature to be preferentially expressed in one cell type or the other in brain tissue, and investigated whether these were found differentially expressed between cell types using our methods. In the Affymetrix dataset, all six genes considered to differentiate endothelial cells from neurons (fibronectin (FN1), osteonectin (SPARC), integrin alpha5 (ITGAV), vascular endothelial cadherin (CDH5), endothelial PAS domain protein 1 (EPAS1), gap junction protein alpha4 (GJA4)) were significantly upregulated in our endothelial cell samples, and all six of those chosen to be neuronal differentiators (neural cell adhesion molecule L1 (L1CAM), synaptosomal protein 25 (SNAP25), synaptophysin (SYP), voltage gated sodium channel type IIIbeta (SCN3B), vesicular glutamate transporter (SLC17A7), Thy-1 cell surface antigen (THY1)) were significantly upregulated in our neuronal samples (Fig 3, Table 4). Furthermore, we examined the expression of markers of other cell types: GFAP, an astrocyte marker, and CNP, a marker of oligodendrocytes. These genes showed low expression values, and did not show differential expression between cell types. The method of Cheadle et al [32] was used to cross validate the entire dataset between chip platforms. In all cases both platforms reflected similar changes for genes with the greatest differential
Table 3.Results of cell type comparison–gene categories.
GO ID Category Name Cell type NES FDRqvalue
GO:0001525 angiogenesis E 1.49 0.028
GO:0008283 cell proliferation E 1.51 0.037
GO:0045765 regulation of angiogenesis E 1.40 0.046
GO:0048666 neuron development N 21.42 0.055
GO:0030182 neuron differentiation N 21.43 0.060
GO:0019226 transmission of nerve impulse N 21.45 0.061
GO:0048699 generation of neurons N 21.45 0.075
GO:0048667 neuron morphogenesis during differentiation N 21.46 0.092
GO:0007269 neurotransmitter secretion N 21.56 0.093
GO:0007268 synaptic transmission N 21.48 0.118
GO:0042551 neuron maturation N 21.23 0.166
GO:0001505 regulation of neurotransmitter levels N 21.26 0.169
GO:0050808 synapse organization and biogenesis N 21.24 0.173
GO:0006836 neurotransmitter transport N 21.13 0.241
GSEA results for categories characteristic of either endothelial cells (E) or neurons (N). Positive normalized enrichment scores (NES) indicate categories enriched in endothelial samples, negative NES indicate categories enriched in neuronal categories. All endothelial categories showed significant enrichment in the endothelial samples and all neuronal categories showed significant enrichment in the neuronal samples (q,0.25).
Figure 3. Characteristic endothelial and neuronal genes.Boxplots showing the expression levels (arbitrary units, derived from Affymetrix Genechips) in endothelial (red) and neuronal (blue) samples of a panel of genes known to be preferentially expressed in either (a) endothelial cells or (b) neurons in brain tissue, plus (c) two markers known to be expressed in other cell types.
doi:10.1371/journal.pone.0003964.g003
Table 4.Results of cell type comparison–individual genes.
Gene symbol Gene name Cell type Affymetrix Codelink
Fold change qvalue Fold change qvalue
EPAS1 Endothelial PAS domain protein 1 E 3.09 ,0.0001 0.93 0.5568
GJA4 Gap junction protein alpha4 E 1.62 0.0116 1.18 0.0645
ITGAV Integrin alpha5 E 2.95 ,0.0001 Not detected
SPARC Osteonectin E 1.87 0.0012 1.56 0.0003
CDH5 Vascular endothelial cadherin E 1.24 0.0124 Not detected
FN1 Fibronectin E 2.36 ,0.0001 1.99 ,0.0001
L1CAM Neural cell adhesion molecule L1 N 21.84 0.0001 Not detected
THY1 Thy-1 cell surface antigen N 22.94 ,0.0001 21.99 0.0045
SCN3B Voltage gated sodium channel type IIIbeta N 23.04 ,0.0001 Not detected
SLC17A7 Vesicular glutamate transporter N 23.14 ,0.0001 21.32 0.0011
SNAP25 Synaptosomal protein 25 N 22.75 0.0007 21.32 0.0423
SYP Synaptophysin N 21.54 0.0121 21.20 0.0009
GFAP Glial fibrillary acidic protein A 1.22 0.4727 Not detected
CNP 29,39-cyclic nucleotide 39phosphodiesterase O 21.07 0.8321 Not detected
expression between endothelial cells and neurons (Table 5). Furthermore, four of each of the neuronal and endothelial markers were also detected in the Codelink dataset; only one failed to cross validate between datasets (Table 4).
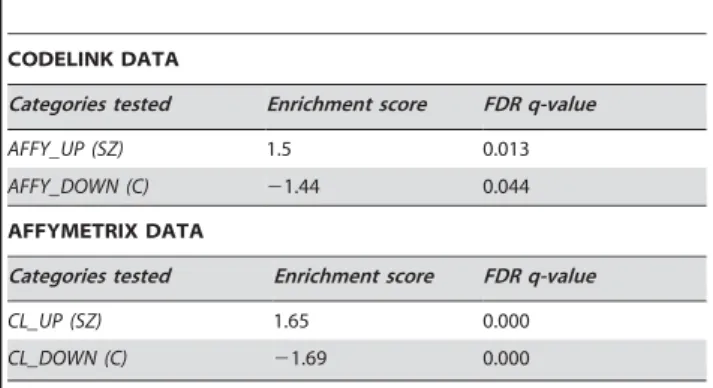
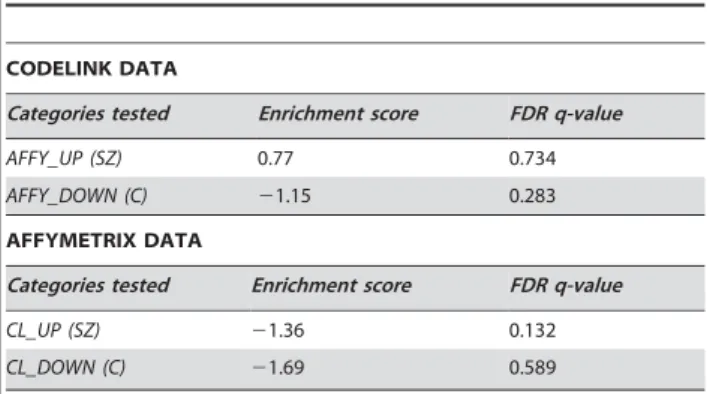
Having established that biologically valid differences between cell types could be detected in the dataset, we moved on to investigate whether differences could be detected between schizophrenia patients and controls in either cell type. LIMMA analysis revealed 1156 genes significantly differentially expressed in endothelial cells and 803 in neurons atp,0.05; however, when correction for multiple hypothesis testing was applied, no genes reached significance. This is likely to be explained by the small sample number and relative subtlety of the expected disease-related changes. In order to determine whether the disease signal could be validated using an alternative methodology, we applied the method of Cheadle et al [32] to validate across chip platforms. In the endothelial dataset, a set of genes whose expression was the most different between schizophrenia and control on one chip platform were found to be significantly enriched in the predicted direction on the other platform (Table 6, Fig 4), suggesting that a reproducible disease signal could be detected in the endothelial samples. However, in the neuronal dataset, alterations in gene expression between schizophrenia and control could not be validated across chip platforms (Table 7). This indicates that using this methodology, no technically robust disease-related alterations could be detected in neurons from the schizophrenia samples, in contrast to the endothelial cells.
In order to further characterise the disease signal in endothelial cells, we investigated alterations in functional categories of genes, a statistically more powerful approach than considering individual gene changes. Numerous approaches to functional profiling of gene expression data exist, which rely on different computational approaches and assumptions. In the present study, we employed two algorithms. The first, GSEA, looks for enrichment of genes in a category at the top or bottom of a ranked list based on a modified Kolmogorov-Smirnov statistic, and has been developed specifically for the detection of biological differences which may be
modest relative to technical noise. The second, OntoExpress, identifies categories of genes which are over or under represented in a list of significant genes relative to their representation on the entire chip. Some differences are expected due to the differences between the algorithms [34], but a truly robust finding should be detectable using either method.
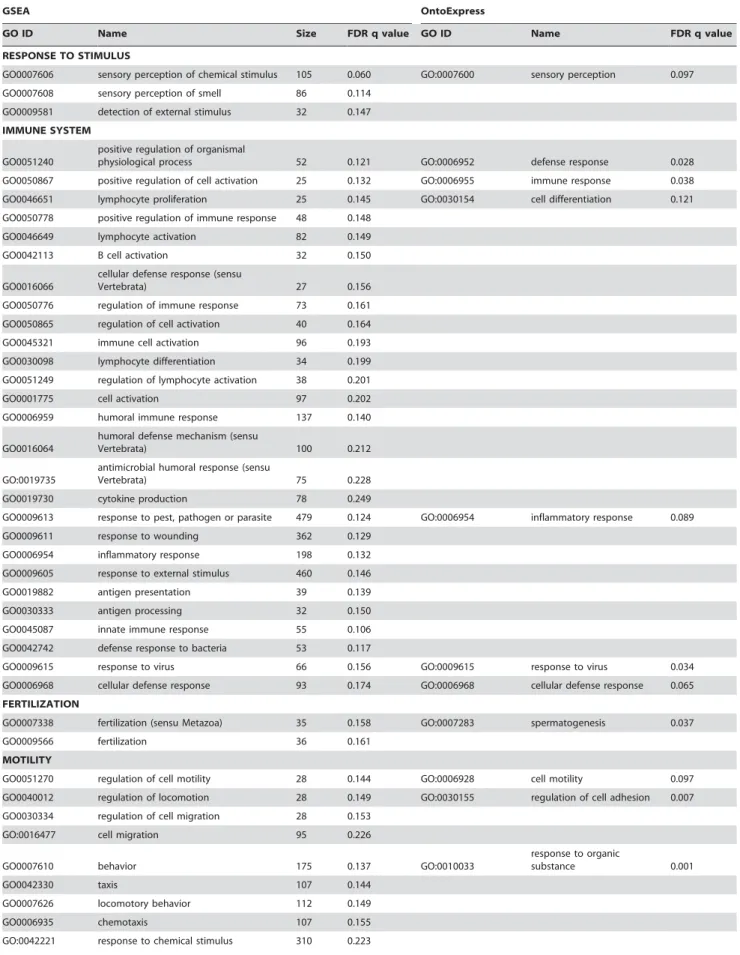
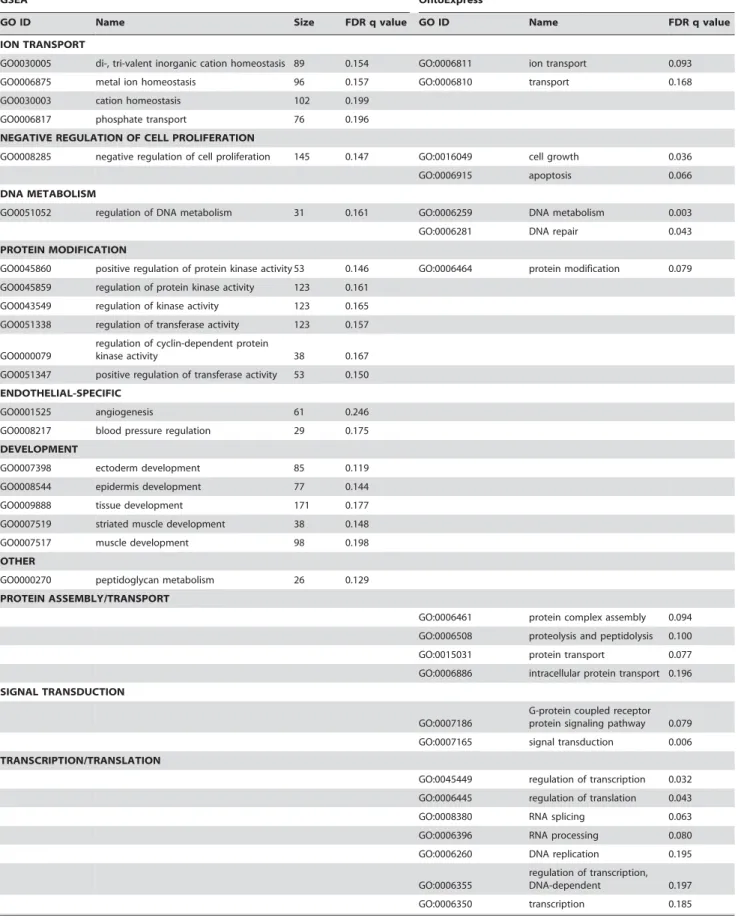
62 categories were downregulated in schizophrenia endothelial samples using GSEA and 33 using OntoExpress. The majority of results were comparable regardless of the algorithm used (Table 8), with a small number of exceptions: endothelial-specific and developmental categories were only found significant with GSEA and not OntoExpress, and categories relating to transcriptional and translational processes were identified with OntoExpress but not GSEA. No categories were significantly upregulated, which reflects the bias towards downregulated genes seen in the data (not shown).
Discussion
In the present study we show molecular alterations in the vasculature of schizophrenia patients. Based on these data alone it is not possible to infer whether alterations in RNA expression reflect a functional impairment in the blood brain barrier. Nonetheless, the results of gene expression profiling indicate a downregulation of genes involved in ion transport, cell prolifer-ation and adhesion, which are consistent with such an impairment. Furthermore, downregulation of genes related to immune system function was identified, including GO:0006954 ‘‘inflammatory response’’ which was identified using both OntoExpress and GSEA. Hanson and Gottesman have proposed inflammation of the cerebral microvasculature as the source of blood-brain barrier dysfunction in schizophrenia, with systemic effects [9]. However the data from this study, and other studies from our laboratory on T cell function in schizophrenia [35], point more towards a hypo-inflammatory state in schizophrenic patients. This is consistent with a growing body of evidence in the field, including the negative association between schizophrenia and rheumatoid arthritis [36– 38], lower antibody reactions to vaccination [39], and decreased Table 5.Results of cross platform validation of the cell type
comparison.
CODELINK DATA
Categories tested Enrichment score FDR q-value
AFFY_ENDO 1.63 0.001
AFFY_NEURON 21.32 0.148 AFFYMETRIX DATA
Categories tested Enrichment score FDR q-value
CL_ENDO 1.76 0.000
CL_NEURON 21.3 0.171
Based on the Affymetrix data, the 200 genes whose expression was the highest in endothelial cells compared to neurons (AFFY_ENDO), and the 200 genes whose expression was the highest in neurons compared to endothelial cells (AFFY_NEURON) were used to create categories. These Affymetrix-derived categories were then investigated in the ranked gene list (endothelial cells vs neurons) generated using the Codelink platform. A positive enrichment score indicates enrichment in endothelial cells, and a negative score indicates enrichment in neurons. The categories were all found to be significantly enriched in the predicted direction in the Codelink data (q,0.25). The converse procedure was carried out testing categories generated from the Codelink data (CL_ENDO, CL_NEURON) on the Affymetrix platform, with comparable results. doi:10.1371/journal.pone.0003964.t005
Table 6.Results of cross platform validation of the schizophrenia vs control comparison for endothelial cells.
CODELINK DATA
Categories tested Enrichment score FDR q-value
AFFY_UP (SZ) 1.5 0.013
AFFY_DOWN (C) 21.44 0.044 AFFYMETRIX DATA
Categories tested Enrichment score FDR q-value
CL_UP (SZ) 1.65 0.000
CL_DOWN (C) 21.69 0.000
Based on the Affymetrix data, the 200 genes whose expression was most upregulated in schizophrenia (AFFY_UP), and the 200 genes whose expression was the most downregulated in schizophrenia (AFFY_DOWN) were used to create categories for analysis in the ranked list (schizophrenia vs control) derived from the Codelink platform. A positive enrichment score indicates enrichment in schizophrenia samples, and a negative enrichment score indicates enrichment in control samples. These were all found to be significantly enriched in the expected direction in the Codelink data (q,0.25). The converse procedure was carried out testing categories generated from the Codelink data (CL_UP, CL_DOWN) on the Affymetrix platform, with comparable results.
skin sensitivity to the type IV antigen test [40]. However, schizophrenia has been positively linked to other auto-immune disorders [41]. At the molecular level, increased levels of acute phase proteins have been reported in schizophrenia pointing towards a pro-inflammatory state [42,43], and conflicting data exists on the role of inflammatory cytokines in the disorder [44]. A potential explanation for these apparently opposing results is overall dysregulation of inflammation, leading to an inappropriate response (either too much or too little inflammation) depending on the stimulus and site. Such a dysfunction in the blood brain barrier is consistent with the broader implications of Hanson & Gottes-man’s hypothesis, and could result in slower response and lower resistance to brain injury/insult, affecting the regulation of supply of substances to the brain. Furthermore, abnormal inflammatory processes may have downstream effects on angiogenesis [45], and thus may further impact vascular abnormalities. However, conclusions cannot be firmly drawn without further in vivo study of the microvasculature in schizophrenia patients.
The blood brain barrier is composed of endothelial cells, pericytes, astrocyte end-feet and neuronal processes. A method for isolating pure vascular endothelium has been developed [46]; however, as this method is specific for endothelial cells and involves numerous steps, its use would preclude comparison of the resulting cell population with neurons and other cell types. Furthermore, cerebral microvascular function arises from the interactions between its various components, therefore global data for the intact microvessel is of greater interest. In this context, our result of downregulation of genes in the GO category ‘‘spermato-genesis’’ is of interest as numerous functional links exist between the blood-brain barrier and the blood-testis barrier, including shared properties of astrocytes and oligodendrocytes and the Sertoli and Leydig cells of the testis [47], [48]. We speculate that this result may indicate altered gene expression in non-endothelial components of the blood-brain barrier. Interestingly, a recent study has found a decreased number of oligodendrocytes per unit length of capillary in post mortem prefrontal cortex from schizophrenia patients [49] which provides a potential explanation
for some of the results seen here. Further investigation of these cell types is clearly warranted.
Laser capture microdissection is a technically challenging method due to the small amounts of tissue and the variability that may be introduced at various stages of the analytical process, compounded by the effects of working with post mortem human tissue, and the present work involved extensive optimization and validation of the methods prior to study commencement. In the present study, although cell-type specific changes could be detected in neurons, no schizophrenia-related alterations could be reliably detected in neurons collected from the same brain region as the endothelial cells (dorsolateral prefrontal cortex). Although we (data not shown) and others [50–52] have found that RNA amplification gives reproducible results, it does result in loss and/or truncation of transcripts, leading to a smaller number of high-quality arrays than would otherwise be expected, and furthermore the final mRNA population analysed will not contain the full range of information found in the original sample [50,53,54]. Thus in this context the neuronal result cannot be considered a true negative. Although no directly comparable study has been carried out, there is much evidence for neuronal alterations in schizophrenia at the molecular and structural level [55], including data derived using similar methods in the same [56,57] and other [2] brain regions. However, as the endothelial data were collected in an identical manner, the results do provide compelling preliminary evidence for molecular alterations in the microvasculature of schizophrenia patients. More targeted and functional studies of the blood-brain barrier, including investiga-tion of its subcomponents, are now required, and further investigation is necessary to determine whether, if proven, blood-brain barrier dysfunction can directly explain the impairment in glucose utilization in the brains of schizophrenic patients. The potential effects of antipsychotic medication on the blood brain barrier should also be assessed. Furthermore, investigation of other cell types such as astrocytes, and further investigation of peripheral tissues, is key to elucidating the role of metabolic abnormalities in the pathophysiology of schizophrenia.
Supporting Information
Supplementary Information S1 A document containing demographics variables for the cell type analysis, and additional details of the microarray data processing
Found at: doi:10.1371/journal.pone.0003964.s001 (0.05 MB DOC)
Figure S1 RNA 59 -39 signal bias. (a) RNA digestion plot showing signal from probes decreases with distance of target sequence from 39end of transcript. Note the inter-chip variability in the gradient of the curves. (b) The degree of RNA 59-39signal bias within a chip, as measured by the slope of RNA digestion curve, displays strong positive correlation with the number of probe-sets on the chip which are flagged as present.
Found at: doi:10.1371/journal.pone.0003964.s002 (7.00 MB TIF)
Figure S2 Detection and removal of RNA 5 -3signal bias from Affymetrix GeneChip data on the expression profiles of endothe-lial cells (E) and neurons (N). (a) PCA of RMA expression data reveals that the major component of the variation in the data Figure 4. Results of cross-platform validation of the schizophrenia vs control analysis for (a) endothelial cells and (b) neurons.The figures were created by the GSEA software and plot the running enrichment score (ES) which reflects the degree to which a gene set is overrepresented at the top or bottom of a ranked list of genes. The score at the peak of the plot (the score furthest from 0.0) is the ES for the gene set. The position of individual members of the gene set in the ranked list is indicated by vertical lines.
doi:10.1371/journal.pone.0003964.g004
Table 7.Results of cross platform validation of the schizophrenia vs control comparison for neurons.
CODELINK DATA
Categories tested Enrichment score FDR q-value
AFFY_UP (SZ) 0.77 0.734
AFFY_DOWN (C) 21.15 0.283 AFFYMETRIX DATA
Categories tested Enrichment score FDR q-value
CL_UP (SZ) 21.36 0.132
CL_DOWN (C) 21.69 0.589
The same procedure as described in Table 6 (endothelial cells) was carried out on data from the neuronal samples. In only one of the four tests was the category derived from one platform significantly enriched in the expected direction on the other platform.
Table 8.Results of functional profiling of the endothelial cell data.
GSEA OntoExpress
GO ID Name Size FDR q value GO ID Name FDR q value
RESPONSE TO STIMULUS
GO0007606 sensory perception of chemical stimulus 105 0.060 GO:0007600 sensory perception 0.097 GO0007608 sensory perception of smell 86 0.114
GO0009581 detection of external stimulus 32 0.147 IMMUNE SYSTEM
GO0051240
positive regulation of organismal
physiological process 52 0.121 GO:0006952 defense response 0.028
GO0050867 positive regulation of cell activation 25 0.132 GO:0006955 immune response 0.038 GO0046651 lymphocyte proliferation 25 0.145 GO:0030154 cell differentiation 0.121 GO0050778 positive regulation of immune response 48 0.148
GO0046649 lymphocyte activation 82 0.149
GO0042113 B cell activation 32 0.150
GO0016066
cellular defense response (sensu
Vertebrata) 27 0.156
GO0050776 regulation of immune response 73 0.161 GO0050865 regulation of cell activation 40 0.164 GO0045321 immune cell activation 96 0.193 GO0030098 lymphocyte differentiation 34 0.199 GO0051249 regulation of lymphocyte activation 38 0.201
GO0001775 cell activation 97 0.202
GO0006959 humoral immune response 137 0.140
GO0016064
humoral defense mechanism (sensu
Vertebrata) 100 0.212
GO:0019735
antimicrobial humoral response (sensu
Vertebrata) 75 0.228
GO0019730 cytokine production 78 0.249
GO0009613 response to pest, pathogen or parasite 479 0.124 GO:0006954 inflammatory response 0.089 GO0009611 response to wounding 362 0.129
GO0006954 inflammatory response 198 0.132 GO0009605 response to external stimulus 460 0.146
GO0019882 antigen presentation 39 0.139
GO0030333 antigen processing 32 0.150
GO0045087 innate immune response 55 0.106 GO0042742 defense response to bacteria 53 0.117
GO0009615 response to virus 66 0.156 GO:0009615 response to virus 0.034
GO0006968 cellular defense response 93 0.174 GO:0006968 cellular defense response 0.065 FERTILIZATION
GO0007338 fertilization (sensu Metazoa) 35 0.158 GO:0007283 spermatogenesis 0.037
GO0009566 fertilization 36 0.161
MOTILITY
GO0051270 regulation of cell motility 28 0.144 GO:0006928 cell motility 0.097 GO0040012 regulation of locomotion 28 0.149 GO:0030155 regulation of cell adhesion 0.007 GO0030334 regulation of cell migration 28 0.153
GO:0016477 cell migration 95 0.226
GO0007610 behavior 175 0.137 GO:0010033
response to organic
substance 0.001
GO0042330 taxis 107 0.144
GO0007626 locomotory behavior 112 0.149
GO0006935 chemotaxis 107 0.155
GSEA OntoExpress
GO ID Name Size FDR q value GO ID Name FDR q value
ION TRANSPORT
GO0030005 di-, tri-valent inorganic cation homeostasis 89 0.154 GO:0006811 ion transport 0.093
GO0006875 metal ion homeostasis 96 0.157 GO:0006810 transport 0.168
GO0030003 cation homeostasis 102 0.199
GO0006817 phosphate transport 76 0.196
NEGATIVE REGULATION OF CELL PROLIFERATION
GO0008285 negative regulation of cell proliferation 145 0.147 GO:0016049 cell growth 0.036
GO:0006915 apoptosis 0.066
DNA METABOLISM
GO0051052 regulation of DNA metabolism 31 0.161 GO:0006259 DNA metabolism 0.003
GO:0006281 DNA repair 0.043
PROTEIN MODIFICATION
GO0045860 positive regulation of protein kinase activity 53 0.146 GO:0006464 protein modification 0.079 GO0045859 regulation of protein kinase activity 123 0.161
GO0043549 regulation of kinase activity 123 0.165 GO0051338 regulation of transferase activity 123 0.157
GO0000079
regulation of cyclin-dependent protein
kinase activity 38 0.167
GO0051347 positive regulation of transferase activity 53 0.150 ENDOTHELIAL-SPECIFIC
GO0001525 angiogenesis 61 0.246
GO0008217 blood pressure regulation 29 0.175 DEVELOPMENT
GO0007398 ectoderm development 85 0.119
GO0008544 epidermis development 77 0.144
GO0009888 tissue development 171 0.177
GO0007519 striated muscle development 38 0.148
GO0007517 muscle development 98 0.198
OTHER
GO0000270 peptidoglycan metabolism 26 0.129 PROTEIN ASSEMBLY/TRANSPORT
GO:0006461 protein complex assembly 0.094 GO:0006508 proteolysis and peptidolysis 0.100 GO:0015031 protein transport 0.077 GO:0006886 intracellular protein transport 0.196 SIGNAL TRANSDUCTION
GO:0007186
G-protein coupled receptor protein signaling pathway 0.079 GO:0007165 signal transduction 0.006 TRANSCRIPTION/TRANSLATION
GO:0045449 regulation of transcription 0.032 GO:0006445 regulation of translation 0.043
GO:0008380 RNA splicing 0.063
GO:0006396 RNA processing 0.080 GO:0006260 DNA replication 0.195
GO:0006355
regulation of transcription, DNA-dependent 0.197 GO:0006350 transcription 0.185
Gene function categories downregulated in endothelial cells from schizophrenia patients using GSEA (left side) and OntoExpress (right side). Related gene sets as defined by GSEA leading edge analysis are grouped together in column 2, and categories are further grouped by theme. Equivalent categories (identical or closely related in the Gene Ontology) identified by OntoExpress, are indicated in columns 5 and 6.
doi:10.1371/journal.pone.0003964.t008
(PC1) is not related to differential expression between endothelial cells and neurons. (b) PC1 of the RMA expression data shows strong correlation with the RNA 5 -3signal bias within each chip. The slope of a chip’s RNA digestion curve was used as the measure of 5 -3signal bias. (c) Following a transformation to remove 5 -3signal bias (see text for details), the major source of variation in the data set is now differential gene expression between the two cell types, which are now clearly separable on PC1. (d) PC1 of transformed data is not correlated with the 5 -3signal bias within a chip.
Found at: doi:10.1371/journal.pone.0003964.s003 (8.23 MB TIF)
Figure S3 Number of probesets on the Affymetrix GeneChip detecting differential ex- pression between endothelial cells and neurons at a range of false discovery rates (FDR), before and after a correction was applied for 59-39 signal bias. For details of systematic bias and correction, see text.
Found at: doi:10.1371/journal.pone.0003964.s004 (6.77 MB TIF)
Acknowledgments
We gratefully acknowledge the donations of the SMRI brain collection, courtesy of Drs. Michael B. Knable, E Fuller Torrey, Maree Webster, Serge Weis and Robert H. Yolken. Also Anita Thorn and Gavin Hardy of GE Healthcare for technical support and Svante Paabo for provision of laboratory resources and helpful comments on the work. We are also grateful to the students of Bildungsinstitut Pscherer gGmbH, Lengenfeld, Germany, for technical assistance, and to Paul Guest, Dave Bailey and Deena Gendoo for comments on the manuscript and bioinformatics support.
Author Contributions
Conceived and designed the experiments: MR SB. Performed the experiments: LWH MJL MR TG IW MLM LW MK. Analyzed the data: LWH MTW MJL MR TG HEL RMC. Contributed reagents/materials/ analysis tools: SB. Wrote the paper: LWH MTW MJL MR.
References
1. Glahn DC, Ragland JD, Abramoff A, Barrett J, Laird AR, et al. (2005) Beyond hypofrontality: a quantitative meta-analysis of functional neuroimaging studies of working memory in schizophrenia. Hum Brain Mapp 25: 60–69. 2. Altar CA, Jurata LW, Charles V, Lemire A, Liu P, et al. (2005) Deficient
hippocampal neuron expression of proteasome, ubiquitin, and mitochondrial genes in multiple schizophrenia cohorts. Biol Psychiatry 58: 85–96. 3. Iwamoto K, Bundo M, Kato T (2005) Altered expression of
mitochondria-related genes in postmortem brains of patients with bipolar disorder or schizophrenia, as revealed by large-scale DNA microarray analysis. Hum Mol Genet 14: 241–253.
4. Middleton FA, Mirnics K, Pierri JN, Lewis DA, Levitt P (2002) Gene expression profiling reveals alterations of specific metabolic pathways in schizophrenia. J Neurosci 22: 2718–2729.
5. Prabakaran S, Swatton JE, Ryan MM, Huffaker SJ, Huang JT, et al. (2004) Mitochondrial dysfunction in schizophrenia: evidence for compromised brain metabolism and oxidative stress. Mol Psychiatry 9: 684–697, 643.
6. Regenold WT, Phatak P, Kling MA, Hauser P (2004) Post-mortem evidence from human brain tissue of disturbed glucose metabolism in mood and psychotic disorders. Mol Psychiatry 9: 731–733.
7. Holmes E, Tsang TM, Huang JT, Leweke FM, Koethe D, et al. (2006) Metabolic profiling of CSF: evidence that early intervention may impact on disease progression and outcome in schizophrenia. PLoS Med 3: e327. 8. Huang JT, Leweke FM, Oxley D, Wang L, Harris N, et al. (2006) Disease
biomarkers in cerebrospinal fluid of patients with first-onset psychosis. PLoS Med 3: e428.
9. Hanson DR, Gottesman II (2005) Theories of schizophrenia: a genetic-inflammatory-vascular synthesis. BMC Med Genet 6: 7.
10. Hudson CJ, Lin A, Cogan S, Cashman F, Warsh JJ (1997) The niacin challenge test: clinical manifestation of altered transmembrane signal transduction in schizophrenia? Biol Psychiatry 41: 507–513.
11. Messamore E, Hoffman WF, Janowsky A (2003) The niacin skin flush abnormality in schizophrenia: a quantitative dose-response study. Schizophr Res 62: 251–258.
12. Puri BK, Easton T, Das I, Kidane L, Richardson AJ (2001) The niacin skin flush test in schizophrenia: a replication study. Int J Clin Pract 55: 368–370. 13. Rybakowski J, Weterle R (1991) Niacin test in schizophrenia and affective illness.
Biol Psychiatry 29: 834–836.
14. Shah SH, Vankar GK, Peet M, Ramchand CN (2000) Unmedicated schizophrenic patients have a reduced skin flush in response to topical niacin. Schizophr Res 43: 163–164.
15. Malaspina D, Harkavy-Friedman J, Corcoran C, Mujica-Parodi L, Printz D, et al. (2004) Resting neural activity distinguishes subgroups of schizophrenia patients. Biol Psychiatry 56: 931–937.
16. Schultz SK, O’Leary DS, Boles Ponto LL, Arndt S, Magnotta V, et al. (2002) Age and regional cerebral blood flow in schizophrenia: age effects in anterior cingulate, frontal, and parietal cortex. J Neuropsychiatry Clin Neurosci 14: 19–24.
17. Brambilla P, Cerini R, Fabene PF, Andreone N, Rambaldelli G, et al. (2007) Assessment of cerebral blood volume in schizophrenia: A magnetic resonance imaging study. J Psychiatr Res 41: 502–510.
18. Cohen BM, Yurgelun-Todd D, English CD, Renshaw PF (1995) Abnormalities of regional distribution of cerebral vasculature in schizophrenia detected by dynamic susceptibility contrast MRI. Am J Psychiatry 152: 1801–1803. 19. Kreczmanski P, Schmidt-Kastner R, Heinsen H, Steinbusch HW, Hof PR, et al.
(2005) Stereological studies of capillary length density in the frontal cortex of schizophrenics. Acta Neuropathol (Berl) 109: 510–518.
20. Shusta EV, Boado RJ, Mathern GW, Pardridge WM (2002) Vascular genomics of the human brain. J Cereb Blood Flow Metab 22: 245–252.
21. Burnet PW, Eastwood SL, Harrison PJ (2004) Laser-assisted microdissection: methods for the molecular analysis of psychiatric disorders at a cellular resolution. Biol Psychiatry 55: 107–111.
22. Hodges A, Strand AD, Aragaki AK, Kuhn A, Sengstag T, et al. (2006) Regional and cellular gene expression changes in human Huntington’s disease brain. Hum Mol Genet 15: 965–977.
23. www.palm-microlaser.com.
24. Jackson ES, Wayland MT, Fitzgerald W, Bahn S (2005) A microarray data analysis framework for postmortem tissues. Methods 37: 247–260.
25. Irizarry RA, Hobbs B, Collin F, Beazer-Barclay YD, Antonellis KJ, et al. (2003) Exploration, normalization, and summaries of high density oligonucleotide array probe level data. Biostatistics 4: 249–264.
26. Irizarry R, Gautier L, Bolstad B, Miller C, Astrand M, et al. (2005) Affy: Methods for Affymetrix Oligonucleotide Arrays.
27. Smyth G (2005) Limma: linear models for microarray data. In: Gentleman R, Carey V, Dudoit S, Irizarry R, Huber W, eds. Bioinformatics and Computational Biology Solutions using R and Bioconductor. New York: Springer. pp 397–420.
28. Benjamini Y, Hochberg Y (1995) Controlling the false discovery rate: A practical and powerful approach to multiple testing. Journal of the Royal Statistical Society B 57: 289–300.
29. Subramanian A, Tamayo P, Mootha VK, Mukherjee S, Ebert BL, et al. (2005) Gene set enrichment analysis: a knowledge-based approach for interpreting genome-wide expression profiles. Proc Natl Acad Sci U S A 102: 15545–15550. 30. GSEA http://www.broad.mit.edu/gsea/.
31. Bolstad BM, Irizarry RA, Astrand M, Speed TP (2003) A comparison of normalization methods for high density oligonucleotide array data based on variance and bias. Bioinformatics 19: 185–193.
32. Cheadle C, Becker KG, Cho-Chung YS, Nesterova M, Watkins T, et al. (2006) A rapid method for microarray cross platform comparisons using gene expression signatures. Mol Cell Probes.
33. Lledo PM, Alonso M, Grubb MS (2006) Adult neurogenesis and functional plasticity in neuronal circuits. Nat Rev Neurosci 7: 179–193.
34. Pavlidis P, Qin J, Arango V, Mann JJ, Sibille E (2004) Using the gene ontology for microarray data mining: a comparison of methods and application to age effects in human prefrontal cortex. Neurochem Res 29: 1213–1222. 35. Craddock RM, Lockstone HE, Rider DA, Wayland MT, Harris LJ, et al. (2007)
Altered T-cell function in schizophrenia: a cellular model to investigate molecular disease mechanisms. PLoS ONE 2: e692.
36. Eaton WW, Hayward C, Ram R (1992) Schizophrenia and rheumatoid arthritis: a review. Schizophr Res 6: 181–192.
37. Gorwood P, Pouchot J, Vinceneux P, Puechal X, Flipo RM, et al. (2004) Rheumatoid arthritis and schizophrenia: a negative association at a dimensional level. Schizophr Res 66: 21–29.
38. Oken RJ, Schulzer M (1999) At issue: schizophrenia and rheumatoid arthritis: the negative association revisited. Schizophr Bull 25: 625–638.
39. Russo R, Ciminale M, Ditommaso S, Siliquini R, Zotti C, et al. (1994) Hepatitis B vaccination in psychiatric patients. Lancet 343: 356.
40. Riedel M, Spellmann I, Schwarz MJ, Strassnig M, Sikorski C, et al. (2007) Decreased T cellular immune response in schizophrenic patients. J Psychiatr Res 41: 3–7.
41. Eaton WW, Byrne M, Ewald H, Mors O, Chen CY, et al. (2006) Association of schizophrenia and autoimmune diseases: linkage of Danish national registers. Am J Psychiatry 163: 521–528.
43. Yang Y, Wan C, Li H, Zhu H, La Y, et al. (2006) Altered levels of acute phase proteins in the plasma of patients with schizophrenia. Anal Chem 78: 3571–3576.
44. Potvin S, Stip E, Sepehry AA, Gendron A, Bah R, et al. (2008) Inflammatory cytokine alterations in schizophrenia: a systematic quantitative review. Biol Psychiatry 63: 801–808.
45. Kirk SL, Karlik SJ (2003) VEGF and vascular changes in chronic neuroinflammation. J Autoimmun 21: 353–363.
46. Kinnecom K, Pachter JS (2005) Selective capture of endothelial and perivascular cells from brain microvessels using laser capture microdissection. Brain Res Brain Res Protoc 16: 1–9.
47. Davidoff MS, Middendorff R, Kofuncu E, Muller D, Jezek D, et al. (2002) Leydig cells of the human testis possess astrocyte and oligodendrocyte marker molecules. Acta Histochem 104: 39–49.
48. Holash JA, Harik SI, Perry G, Stewart PA (1993) Barrier properties of testis microvessels. Proc Natl Acad Sci U S A 90: 11069–11073.
49. Vostrikov V, Orlovskaya D, Uranova N (2008) Deficit of pericapillary oligodendrocytes in the prefrontal cortex in schizophrenia. World J Biol Psychiatry 9: 34–42.
50. Baugh LR, Hill AA, Brown EL, Hunter CP (2001) Quantitative analysis of mRNA amplification by in vitro transcription. Nucleic Acids Res 29: E29.
51. Kaposi-Novak P, Lee JS, Mikaelyan A, Patel V, Thorgeirsson SS (2004) Oligonucleotide microarray analysis of aminoallyl-labeled cDNA targets from linear RNA amplification. Biotechniques 37: 580, 582–586, 588.
52. Luzzi V, Mahadevappa M, Raja R, Warrington JA, Watson MA (2003) Accurate and reproducible gene expression profiles from laser capture microdissection, transcript amplification, and high density oligonucleotide microarray analysis. J Mol Diagn 5: 9–14.
53. Boelens MC, te Meerman GJ, Gibcus JH, Blokzijl T, Boezen HM, et al. (2007) Microarray amplification bias: loss of 30% differentially expressed genes due to long probe - poly(A)-tail distances. BMC Genomics 8: 277.
54. McClintick JN, Jerome RE, Nicholson CR, Crabb DW, Edenberg HJ (2003) Reproducibility of oligonucleotide arrays using small samples. BMC Genomics 4: 4.
55. Harrison PJ (1999) The neuropathology of schizophrenia. A critical review of the data and their interpretation. Brain 122(Pt 4): 593–624.
56. O’Connor JA, Hemby SE (2007) Elevated GRIA1 mRNA expression in Layer II/III and V pyramidal cells of the DLPFC in schizophrenia. Schizophr Res 97: 277–288.