www.ocean-sci.net/8/183/2012/ doi:10.5194/os-8-183-2012
© Author(s) 2012. CC Attribution 3.0 License.
Ocean Science
Black Sea coastal forecasting system
A. I. Kubryakov1, G. K. Korotaev1, V. L. Dorofeev1, Y. B. Ratner1, A. Palazov2, N. Valchev2, V. Malciu3, R. Matescu3, and T. Oguz4
1Marine Hydrophysical Institute (MHI), 2, Kapitanskaya Street, 99011, Sevastopol, Crimea, Ukraine 2Institute of Oceanology (IO), First May Street 40, P.O. Box 152, Varna 9000, Bulgaria
3National Institute for Marine Research and Development “Grigore Antipa”(NIMRD), 300 Blvd. Mamaia, 900581, Constanta 3, Romania
4Middle East Technical University, Institute of Marine Sciences (IMS), P.O. Box 28, 33731, Erdemli-Mersin, Turkey
Correspondence to:A. I. Kubryakov ([email protected])
Received: 15 March 2011 – Published in Ocean Sci. Discuss.: 10 May 2011
Revised: 24 January 2012 – Accepted: 10 February 2012 – Published: 14 March 2012
Abstract.The Black Sea coastal nowcasting and forecasting system was built within the framework of EU FP6 ECOOP (European COastalshelf sea OPerational observing and fore-casting system) project for five regions: the south-western basin along the coasts of Bulgaria and Turkey, the north-western shelf along the Romanian and Ukrainian coasts, coastal zone around of the Crimea peninsula, the north-eastern Russian coastal zone and the coastal zone of Geor-gia. The system operates in the real-time mode during the ECOOP project and afterwards. The forecasts include tem-perature, salinity and current velocity fields. Ecosystem model operates in the off-line mode near the Crimea coast.
1 Introduction
Coastal waters have always been an area of high social in-terest. Increasing human migration to coastal regions raises complex public-policy issues concerning the quality of life of people and their impact on the marine environment. Con-tinuing concerns about sustainable utilization of natural re-sources and preservation of environmental quality attract more and more attention of society. An effective manage-ment and sustainable use of coastal areas and resources de-mands realistic multidisciplinary information about the state of marine environment and its changes. Marine nowcasting and forecasting systems are proper tools capable of satisfying such needs.
Nowcasting and forecasting of coastal dynamics in the Black Sea has several specific features.
The main hydrological and hydrodynamics features of the Black Sea are defined by its inland location and high iso-lation from the World Ocean and are formed by the impact of external factors, such as wind stress, heat and moisture fluxes and river runoff. (Blatov et al., 1984; Korotaev et al., 2011; Kostianoy and Kosarev, 2008). The Black Sea, with a surface area of 423 000 km2, is an elongated basin situated between 40◦56′and 46◦33′N with its maximum dimension
transport of the upper flow (near 0.02 Sv) exceeds twice the lower one. Correspondingly, the salinity of the Marmara Sea is approximately twice higher than that on the surface of the Black Sea. Inflow of the salt water through the Bosphorus Strait determines the density stratification of the sea. The deep-sea salinity is near 22.5 ppt against 18–18.5 ppt on the surface. A well-pronounced permanent pycnocline is situ-ated at a depth of 150–300 m. Monthly-mean atmospheric circulation is of a cyclonic character above the Black Sea during the whole year. The prevailing cyclones provide a positive wind stress curl for the whole year, with maximum in winter and minimum in summer. The positive wind stress curl and the buoyancy contrast between the fresh river inflow and salt water supply through the Bosphorus Strait induce cyclonic circulation in the sea. A permanent feature of the upper layer circulation is the Rim Current, encircling the en-tire Black Sea and forming a large scale cyclonic gyre. The Rim Current is located above the continental slope and has a width of 40–80 km. Direct observations of current veloc-ity from surface buoys show that the maximum speed of the stream is usually 40–50 cm s−1, increasing sometimes up to 80–100 cm s−1. The Rim Current is concentrated above the shallow pycnocline and the volume transport by the current is estimated at 3–4 Sv. A general opinion is that shallow and sharp pycnocline restricts propagation of seasonal sig-nal from the surface and seasosig-nal variability is concentrated in the upper 100 m. Permanent and transient mesoscale an-ticyclones are observed at the right side from the jet. The most prominent feature is the anticyclonic eddy in the south-eastern corner of the basin. Strong meanders of the Rim Current and mesoscale eddies are formed near the Bosporus Strait and along the Anatolian coast. The area of the bottom slope between the north-western shelf and the deep part of the sea is also the region of the increased mesoscale variabil-ity resulted from the Rim Current meandering. The inter-nal Rossby radius, which is equal to 25 km, defines a typical length scale of mesoscale features. The mesoscale variability of the sea level may have the amplitude of 10–15 cm as the velocity of surface mesoscale currents achieves 50 cm s−1. The Rim Current is the most intense in the winter-spring sea-sons. Summer circulation attenuates significantly and in the autumn season, the Rim Current usually brakes on the set of mesoscale eddies. The overall circulation system possesses a set of quasipersistent anticyclonic eddies on the coastal side of the Rim Current zone (Korotaev et al., 2003).
Therefore, the sea is distinguished by a high degree of vari-ability in the hydrological conditions, especially in coastal areas. At the same time, in different parts of the Black Sea, the influence of outer factors is very unequal. Consequently, these factors exert a different impact on the formation of hydrological fields and a vertical thermohaline structure in the sea. Coastal areas have a number of specific features, namely: relatively shallow depths; most irregularity bottom topography; freshening caused by river runoff; significant role of bottom friction; coastal upwelling; storm surges; and
mesoscale fronts and eddies. All this determines the neces-sity of a more detailed description of the hydrodynamic pro-cesses affecting the forecast of the state of coastal Black Sea areas.
The basin-scale nowcasting and forecasting system op-erating in real-time provides simulation on the rectangular Cartesian grid with 5×5 km resolution. Such resolution is
relevant to resolve mesoscale variability in the deep basin where the Rossby radius is greater than 20 km. Diminishing of the basin depth in the coastal area significantly reduces the value of the internal Rossby radius and, thus, curtails the characteristic temporal and spatial scales of major dynamical processes. Rapid changes in the atmospheric pressure often produce a shocking effect upon the sea surface in the coastal regions that results in occurrence of small scale fronts and filaments. The features of the coastal dynamics can be ade-quately reproduced by the general circulation models only if the grid size is substantially shorter than that in the open part of the basin.
The peculiarities of the coastal dynamics can be taken into account in various ways. The method of the nested grids is one of them that is used in the ECOOP project. The essence of this method consists of higher spatial resolution in a se-lected region adjoining the coast compatible with the char-acteristic spatial scales of the phenomena taking place in the coastal area of the sea. The liquid boundaries of the selected region should coincide with the boundaries of the boxes of the large-scale model. The liquid boundary conditions for the nested grid model are taken from the simulations of the basin-scale model. In the models, a passive, off-line, one way interaction nesting method has been used, which means that the boundary conditions of the fine grid model are pre-scribed in some way by external data taken from the coarse resolution model, while the solution of the latter is not mod-ified by the solution of the fine grid model in their common overlapping area. The nesting method provides flow of infor-mation through the open boundaries from the coarse resolu-tion basin-scale model to the coastal high-resoluresolu-tion models. An integral constraint is applied to ensure that the net mass flux across the open boundaries is identical to the net flux in the basin scale model.
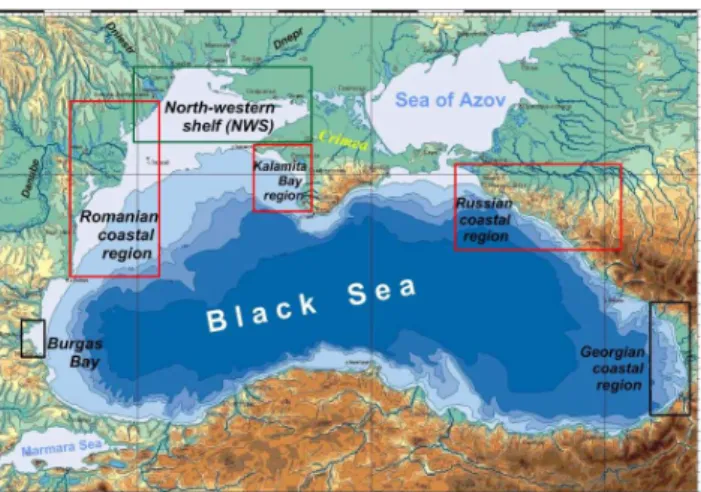
Fig. 1.Nested grid simulation regions of pilot version of the Black Sea coastal forecasting system.
the Russian coastal zone of the Black Sea. The full system operated during five days in July 2005 in the manual mode.
A further improvement of the coastal zone nowcasting and forecasting in the Black Sea was carried out within the framework of EU FP6 ECOOP project (Kubryakov et al., 2008b). Five sub-regions were selected for the nesting of coastal models to the basin scale one. The sub-regions were selected to cover areas of potential pollutions and intense traffic. They include the Bulgarian coast-Bosphorus Strait region (area BB) with intense shipping and two large ports (Burgas and Varna), Romanian coast and north-western shelf (area NWS) of the Black Sea where major rivers transport potentially polluted freshwater and three big ports are situ-ated (Constanta, Odessa and Il’ichevsk); South of Crimea until the Kerch Strait mouth (area C), significant recreation area; Russian coast near Novorossiysk port (area R) and Georgian coast (area G) near ports Poti and Batumi (Fig. 2). The first three regions were part of the basic ECOOP coastal nowcasting and forecasting system. The regions in the Rus-sian and Georgian coastal waters are parts of the Black Sea GOOS (Global Ocean Observing System) initiative sup-ported by the ECOOP partnership.
2 The Black Sea coastal forecasting system
2.1 Hydrodynamic models for all coastal regions
An initial requirement for the high resolution regional mod-els was that they should be capable of resolving scales as-sociated with mesoscale phenomena, such as fronts and ed-dies. The spatial resolution of 1×1 km was selected for all
five coastal regions. All of these models have 18 sigma-surfaces in the vertical. The POM-version has been adopted to the selected coastal regions of the Black Sea in Marine Hydrophysical Institute (Sevastopol, Crimea) (Kubryakov, 2004; Stefanescu et al., 2004). The models operated during
Fig. 2. The coastal regions implemented for the nested grid simu-lations. The numbers in the boxes indicate the grid points along the longitudinal and latitudinal directions, respectively.
ECOOP have been carefully calibrated to the Black Sea con-ditions against observations. The later the domestic model developed by the Institute of Geophysics in Georgia was in-stalled for the Georgian coastal zone (Kordzadze and Deme-terashvili, 2011) The basin-scale Black Sea nowcasting and forecasting system forms a basis for the initial and boundary conditions of the coastal models. It provides initial fields of temperature, salinity and current velocity on a regular grid with 5 km resolution and 33 vertical z-levels. Initialisation of the coastal models started a day before the current date to ensure adjustment of coastal models to the new spatial res-olution. Boundary conditions on the open boundaries of the coastal region are provided by the basin-scale model every three hours for one day of hindcast and three days of fore-cast. Atmospheric forcing of the coastal model is the same as for the basin-scale one. Meteorological forecast of the wind stress field, evaporation, precipitation and heat flux compo-nents are provided by the National Meteorological Adminis-tration of Romania. Atmospheric forcing, initial and bound-ary conditions were interpolated onto the horizontal grid of the coastal models.
2.2 Ecosystem model of the South Coast of Crimea and North East Black Sea
Fig. 3.Season-mean distribution (upper row – winter, then spring, summer and autumn) of surface nitrate (left), phytoplankton (central) and zooplankton (write).
for regions deeper than 200 m. Conditions on the lateral liquid boundaries for state variables of the biogeochemical model are provided by basin-wide model.
As an example for the coastal ecosystem model out-put, Fig. 3 demonstrates season-mean distribution of surface nitrate (left), phytoplankton (central) and zooplank-ton (right) concentrations. In summer and autumn seasons, there are increased values of surface nitrate concentration near the southern Crimea coast due to strong upwelling; as
3 System architecture and system products
3.1 System architecture
The real-time basin-scale nowcasting and forecasting sys-tem of the Black Sea provides atmospheric forcing, ini-tial and boundary conditions for the coastal forecasting for all five regions. The Black Sea circulation model uses at-mospheric forcing of the regional atat-mospheric model of ALADIN family simulated by the Romanian Meteorologi-cal Agency (NMA) and assimilates space altimetry, sea sur-face temperature (SST), climatic temperature and salinity profiles. A detailed description of the basin-scale Black Sea nowcasting and forecasting system is presented by Korotaev et al. (2011).
The regional models run in the oceanographic institutes of the corresponding riparian countries. Special training of responsible oceanographer-users was carried out to install the regional models (Kubryakov et al., 2008a). This train-ing included: (i) preparation of atmospheric forctrain-ing, initial and boundary conditions; (ii) setting of models parameters and run of models in nowcasting or forecasting modes; and (iii) installation of software for visualisation and analysis of input and output model products.
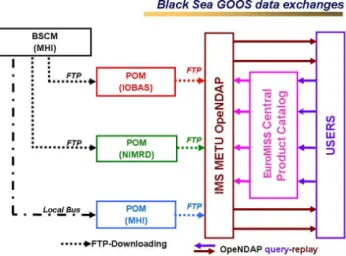
The basin-scale nowcast and forecast are usually ready at 11 a.m. every day. Then atmospheric forcing, initial and boundary conditions are automatically prepared for each coastal region and uploaded into the FTP-server at MHI. Ini-tial conditions are uploaded for the day before the present. Atmospheric forcing and boundary conditions are provided for all four days, including one day of hindcast and three days of forecast. The regional operators then download these atmospheric forcing, initial and boundary conditions and au-tomatically run their models, providing analysis and three days forecast of the three-dimensional fields of temperature, salinity and current velocity. Operational data of the regional ECOOP nowcast and forecast is then collected on the Open-DAP (Open-source Project for a Network Data Access Proto-col) server of IMS-METU and transmitted to the EuroMISS (EUROpean Marine Information System of Systems) server of the ECOOP project. Any user was able to select some section of the simulated fields or even to build a cartoon us-ing EuroMISS facilities. The scheme of the data exchange in the Black Sea coastal nowcasting and forecasting system is shown in Fig. 4.
3.2 System products
Full three-dimensional arrays of temperature, salinity and current velocity data as well as static and dynamic previews of temperature and salinity fields on different depths were made available via EuroMISS server. Figure 5 shows the distribution of SST and surface salinity in the south-western corner of the basin. The structure of Rim Current transport-ing patches of warm water along the shore is well presented
Fig. 4. The scheme of the data exchange in the Black Sea coastal nowcasting and forecasting system.
on the salinity map as a boundary between red and yellow colours. The cold and low salinity water associated with the Danube runoff is also seen along the coast. This narrow jet of cold water along the western coast of the Black Sea is of-ten observed on the satellite infrared imagery in winter time (Shapiro at el., 2010).
The results of the three days forecast of SST on the north-western shelf of the Black Sea and near the Crimea coast are presented in Fig. 6a, b. The formation of cold water near the northern boundary of the shelf is evident in the left panel of Fig. 6a. Four days calculation demonstrates complex mixing of warm and cold water on the shelf by means of intrusions. The set of maps in Fig. 6a shows also the beginning of pro-cess of anticyclonic eddy formation near the Danube mouth where the cooler water propagates to the south-west along the right edge of the eddy and warmer water moves to the north-east along the coast.
Fig. 5.SST (left) and surface salinity (right) analysis in the region near the Bosphorus Strait and Bulgarian coast (area BB) on 25 February 2008.
Table 1.Period of observations and number of hydrographical pro-files obtained near the southern coast of Crimea.
Year Date Number of stations
2005 24.07 4 2005 28.07 6 2006 14.12–15.12 17 2007 16.05–19.05 26 2007 18.07–21.07 38 2007 22.09 8 Total 2005–2007 99
4 Validation of the system products
Validation of the coastal system products was essential part of the ECOOP project (Korotaev at el., 2011). Both off-line and on-line validations were considered during the project development. On-line validation of SST was carried out according to the common standards by means of the com-parison of simulations with temperature field derived from NOAA AVHRR (National Oceanic and Atmospheric Admin-istration Advanced Very High Resolution Radiometer) data. Off-line validation was based on the use of archived data, non-operational or any other set of observations. Off-line validation of the three-dimensional temperature and salinity fields was fulfilled based on the cruise data.
In situ temperature and salinity profiles which are used for validation the models of the Crimean coastal region and the north-western shelf region were obtained during oceano-graphic surveys, carried out by R/VEksperimentfrom July 2005 to October 2007. Some information about sampling locations is presented in Tables 1 and 2.
Table 2. Period of observations and number of hydrographic pro-files obtained on the north-western shelf.
Year Date Number of stations
2007 17.05–18.05 19 2007 15.09–20.09 8 2007 15.10–18.10 34 Total 2007 61
The hydrodynamic model set up for the western part of the Black Sea was validated using in situ measurements of database which consists of CTD casts performed in this area mainly during regular monitoring cruises with R/V
Akademik in a 4-year period (2004–2007). Monitoring scheme implemented by the Institute of Oceanology of Bul-garian Academy of Sciences (IO-BAS), shown in Fig. 7, cov-ers the Bulgarian economic zone and sampling is carried out at least 4 times per year. The total number of cruises included in the database is 19, which are performed mainly in summer and autumn. There are 3 winter and 2 spring cruises present. The average number of sampling stations is 28 per cruise and the maximum – 80 stations during June 2006 cruise. Stations sampled during 2004–2007 are shown in Fig. 8. Exact cruise duration and number of stations are listed in Table 3.
Table 3.Duration and number of sampled stations presented in the IO-BAS database.
Year Date Number of stations 2004 2004 2004 2004 31.05.–04.06. 27.07.–01.08. 17.09.–21.09. 21.12.–22.12. 50 3 30 5 2005 2005 2005 2005 2005 2005 07.03.–12.03. 20.04.–21.04. 07.06.–11.06. 17.06.–20.06. 29.08.–03.09. 21.11.–27.11. 24 11 39 6 40 30 2006 2006 2006 2006 2006 2006 27.03.–14.04. 01.06.–18.06. 05.07.–07.07. 11.07.–17.07. 28.08.–04.09. 09.11.–13.11. 11 80 17 37 19 25 2007 2007 2007 20.02.–23.02. 20.08.–25.08. 04.10.–08.10. 24 68 8
Fig. 7.Monitoring scheme of IO-BAS.
4.1 Validation of the Black Sea temperature and salinity profiles
4.1.1 Off-line validations
The 329 temperature profiles were used for the comparison of simulations and observations near the South Coast region of Crimea and 240 for north-west shelf collected in different dates, times and geographical locations. Figure 9 presents
Fig. 8. Geographical coverage of sampling stations present in the 2004–2007 database.
some examples of the comparison when the prediction time is than 13.5 h. The temperature profiles, derived from the basin-scale (red, “BAS”), sub-regional (blue, “LOC”) model simulations and in situ data (black, “InS”), are presented in the left panel. Deviations between basin-scale model and in situ profiles (red, “BAS–InS”), sub-regional model and in situ profiles (blue, “LOC–InS”), basin-scale and sub-regional models (black, “LOC-BAS”) are presented in the right panel. The difference between observations and sim-ulations is within 0.5◦ for most of the depths. The
maxi-mal deviation is observed in the seasonal thermocline (10– 30 m) where vertical gradient of temperature is largest and even small distortion of the isotherm position provides sig-nificant difference of the temperature value. Good consis-tency between simulations and observations is typical for the beginning of the upper layer heating in May, and at the be-ginning of upper layer cooling in September–October. The temperature profiles predicted by the sub-regional models in this case better resemble the in situ profiles with respect to those simulated by the basin-scale model.
Fig. 9.The temperature profiles (left) derived from coastal model (blue), basin-scale model (red) and in-situ measurements (black) and the deviations of the local (blue) and basin-scale (red) models from observations and the difference between local and basin-scale models (right).
Fig. 11.The same as in Fig. 9, but for the station on the north-western shelf.
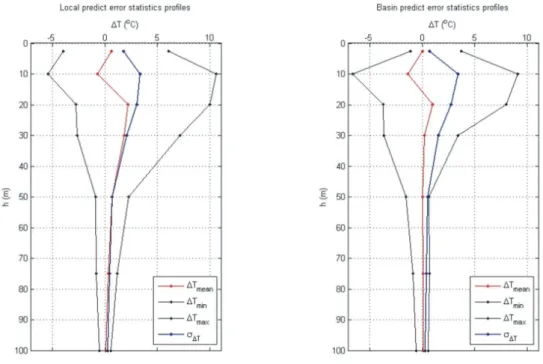
four times, due to intersection of the time intervals for differ-ent prediction cycles. Then, the bias and standard deviation between simulations and observations were estimated by av-eraging on every z-level over all stations for each group. We observe that the error statistics have common features for all groups. Bias, standard deviation, minimal and maximal devi-ations have maximum value in the seasonal thermocline with standard deviations up to 3◦C, whereas it may be as high
as 1.5◦C in the upper homogeneous layer. They slightly
in-crease as the time of prediction grows from the first group to the third one. Generally, error statistics for the sub-regional models and the basin-scale one are rather close in spite of the sub-regional model reproduce better small-scale features.
Profiles of biases (µ) and standard deviations (σ) for the surveys near the Crimea coast are shown in Fig. 10 as an example. Common information about stations, observation time, local prediction time (PredTime), and number stations (nObs) is presented in the figure caption. We note that the number of the comparisons decreases with depth because most of the observations were collected in the coastal and shelf zones with limited depths. Figure 10 shows that the temperature profiles, predicted by the sub-regional model, have slightly higher bias and standard deviation than that simulated by the basin-scale model. The most significant difference between observations and model prediction is
con-centrated in the upper mixed layer and seasonal thermocline. Very similar results are obtained for the north-west shelf area (Fig. 11).
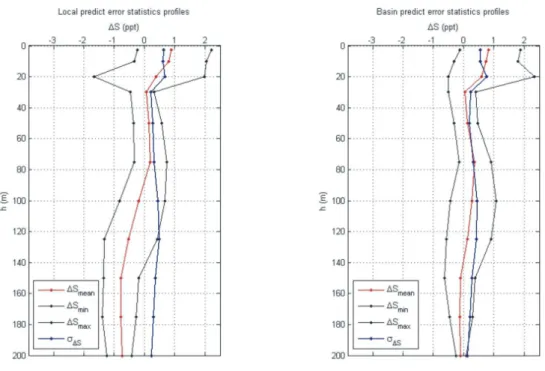
Comparison of individual salinity profiles are presented in Fig. 12 for the prediction time of roughly 2.5 days. The sub-regional models demonstrate a bad skill, especially in the permanent pycnocline depth range of 150–300 m. How-ever, both model predictions are in the range of about 0.2 ppt within the upper 100 m layer.
Fig. 12. The salinity profiles (left) derived from coastal model (blue), basin-scale model (red) and in-situ measurements (black) and the deviations of the local (blue) and basin-scale (red) models from observations and the difference between local and basin-scale models (right).
Fig. 14.Model forecast of SST for 72 h (upper left), NOAA AVHRR SST observations (upper right) and difference between simulated and observed fields (bottom) maps (dark blue – cloud occupied areas). Some statistic is shown on the third panel.
Fig. 15.Difference of simulated and observed SST fields on the north-western shelf of the Black Sea 3 June 2009. The nowcast is shown on the left panel and the 48 h forecast is on the right one (dark blue – cloud occupied areas).
4.1.2 On-line validation of SST
The standard on-line validation of all the ECOOP regional and coastal systems was carried out during the operational phase of the project. The goal of the on-line validation was to control the forecasting systems in operation and assess the consistency of simulations and observations evaluating accu-racy of model outputs. SST as the simplest common variable was selected for the on-line validation. High resolution SST data sets were available for every ECOOP area through the EuroMISS catalogue and so it was easy to compare observed and simulated SST in real time. The ECOOP coastal fore-casting systems including the Black Sea operate daily. Fore-casted SST for the current date, one and two days before was compared with the AVHRR-SST observed for today. Three figures were prepared and displayed on the ECOOP web to present validation results. Every figure contained maps of SST observation, prediction or analysis and differences be-tween observed and simulates values (where observations were available). Simple statistical information such as bias, standard deviation, and number of pixels available for the comparison was presented on the third map. Common pe-riod of on-line validation was selected from 1 February 2009 to 31 July 2009. However, most ECOOP systems have ex-tended the on-line validation until 30 May 2010, i.e. the end of the project.
The on-line validation of SST was carried out for the south-western corner, north-western shelf and Crimean coastal forecasting systems. SST data retrieved from NOAA/AVHRR observations are used for the evaluation of the accuracy of nowcast/forecast. Among all the NOAA SST maps obtained during a day, the one which is the most cloud free is selected to be compared with the closest in time SST nowcast and one-, two- or three-day forecasts.
An example of the on-line validation of the 72 h forecast of SST near the South Coast of Crimea is shown in Fig. 14 for 13 December 2009. There is some qualitative correspon-dence between simulated and observed maps. The patch of warmer water is situated near the mouth of the Kerch Strait on both maps. Offshore cold water area and small pool in the bay presented by simulations are consistent with the observa-tions. The standard deviation of 0.41◦C is considered to be
quite good. The bias is equal−033◦C. Low standard
devia-tion and relatively large bias is typical for the winter season when the SST field is rather uniform.
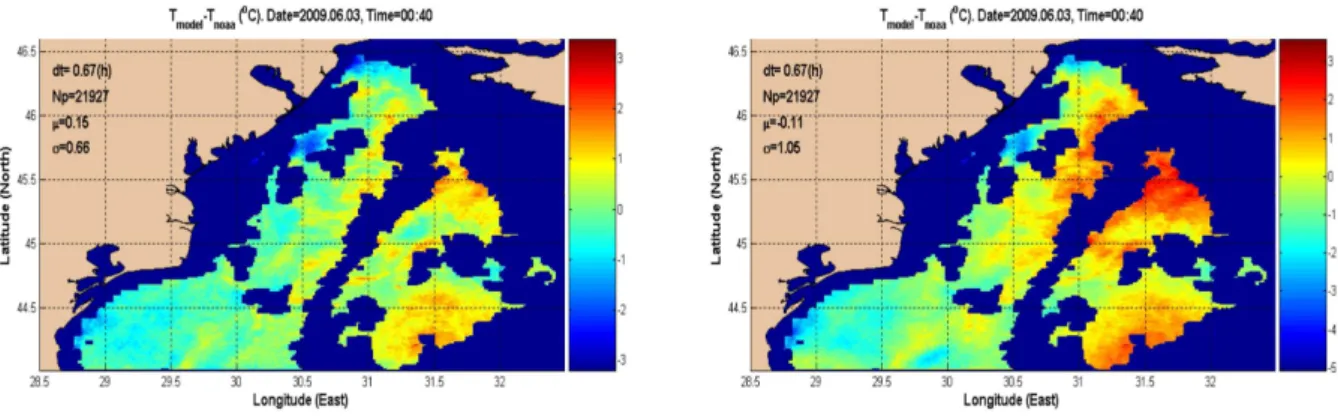
The validation of the model operated on the north-western shelf is presented in Fig. 15. Only the difference between nowcast/forecast and observations is shown. The bias of simulated fields against the observed one is rather low and almost the same for the nowcast (−0.15◦C) and forecast
(−0.11◦C). The standard deviation is equal 0.66◦C for the
nowcast but grows with the time of prediction up to 1.05◦C
after two days of forecast.
Similar results are obtained for the south-western corner of the basin (Fig. 16). The nowcasted SST field is characterised
by the bias equal 0.14◦C and standard deviation of 0.6◦C.
The standard deviation and the bias increase to 0.79◦C and
0.54◦C, respectively, after two days forecast. On the average
based on almost one year SST validation, the standard devi-ation is evolved from 0.67◦C for the nowcast up to 0.92◦C
for one day forecast, then to 1.1◦C for two days forecast and
finally to 1.27◦C for three days forecast. It is interesting to
note that the model nowcast corresponds better to the SST derived from the satellite measurements than the in situ data, as shown in Fig. 10. The most probable explanation is re-lated with the difference in the discrete surface sampling at sea vs. by the model and satellites.
5 Conclusions
The Black Sea coastal forecasting system was efficiently developed by the consortium of the riparian countries. Six groups involved in this operational work are Insti-tute of Oceanology (Bulgaria), InstiInsti-tute Geophysics (Geor-gia), National Institute of Marine Research (Romania), State Oceanographic Institute (Russia), Institute of Marine Sciences-Middle East Technical University (Turkey) and Marine Hydrophysical Institute (Ukraine). The system of coastal forecasts developed demonstrates its efficiency and relevance to the end user needs as assessed by the Black Sea GOOS that further considered continuation of the real-time operation of these coastal forecasting systems. Environmen-tal ministries and hydrometeorological services are among customers of the coastal forecasting. The Black Sea coastal forecasting system forms a basis for the operations of the Black Sea Marine Forecasting Centre of the EU FP7 My-Ocean project.
Acknowledgements. The work presented here was granted by European Commission FP6 Grants through the projects “European COastal-shelf sea Operational Observing and forecasting system Integrated Project” ECOOP (Contract No. 036355). We wish to thank the anonymous reviewers for their constructive comments.
Edited by: M. D. Skogen
References
Blatov, A. S., Bulgakov, N. P., Ivanov, A. N., Kosarev, A. N., and Tujilkin, V.: Variability of the hydrodynamical fields in the Black Sea, Gidrometeoizdat, St. Petersburg, 240 pp., 1984 (in Russion). Blumberg, A. F. and Mellor, G. L.: A description of a three-dimensional coastal ocean circulation model, in: Three Dimen-sional Coastal Ocean Models, edited by: Heaps, N. S., American Geophysical Union, Washington, D.C., 1–16, 1987.
Hunter, J. R.: OzPOM: A Version of the Princeton Ocean Model, http://staff.acecrc.org.au/∼johunter/ozpom.html 2002.
within the ECOOP, Ocean Sci., 7, 793–803, doi:10.5194/os-7-793-2011, 2011.
Korotaev, G. K., Oguz, T., Nikiforov, A. A., and Koblinsky, C. J.: Seasonal, interannual and mesoscale variability of the Black Sea upper layer circulation derived from altimeter data, J. Geoph. Res., 108, 3122, doi:10.1029/2002JC001508, 2003.
Korotaev, G. K., Oguz, T., Dorofeyev, V. L., Demyshev, S. G., Kubryakov, A. I., and Ratner, Yu. B.: Development of Black Sea nowcasting and forecasting system, Ocean Sci., 7, 629–649, doi:10.5194/os-7-629-2011, 2011.
Kostianoy, A. G., Kosarev, A. N.: The Black Sea Environment, Springer-Verlag Berlin Heidelberg, Hdb Env Chem Vol. 5, Part Q: XIV, 457 pp., 2008.
Kubryakov, A. I.: Application of nested grid technology at the de-velopment of the monitoring system of hydrophysical fields in the Black Sea coastal areas, Ecological safety of coastal and shelf zones and complex use of shelf resources, NAS of the Ukraine, edited by: Korotaev, G. K. and Kubryakov, A. I., Sevastopol, 11, 31–50, 2004 (in Russian).
Kubryakov, A., Grigoriev, A., Kordzadze, A., Korotaev, G., Stefanescu, S., Trukhchev, D., and Fomin, V.: Nowcast-ing/Forecasting subsystem of the circulation in the Black Sea nearshore regions, in: European Operational Oceanography: Present and Future, edited by: Dahlin, H., Flemming, N. C., Marshand, P., and Petersson, S. E., Proceedings of the Fourth EuroGOOS International Conference on EuroGOOS, 6-9 June 2005, Brest, France, ISBN 92-894-9788-2, 605–610, 2006.
Kubryakov, A., Korotaev, G., Dorofeyev, V., and Oguz, T.: The Black Sea Training System, in: Coastal to Global Operational Oceanography: Achievements and Challenges, 5th EuroGOOS Conference/ 20-22 May, Exeter, UK, 165, 2008a.
Kubryakov, A., Korotaev, G., Ratner, Y., Grigoriev, A., Kordzadze, A., Stefanescu, S., Valchev, N., and Matescu, R.: The Black Sea Nearshore Regions Forecasting System: operational implemen-tation, Coastal to Global Operational Oceanography: Achieve-ments and Challenges, edited by: Dahlin. H., Bell, M. J., Flem-ming, N. C., and Petersson, S. E., Proceedings of the Fifth In-ternational Conference on EuroGOOS. 20-22 May, Exeter, UK, 293–296, 2008b.
Shapiro, G. I., Stanichny, S. V., and Stanychna, R. R.: Anatomy of shelf–deep sea exchanges by a mesoscale eddy in the North West Black Sea as derived from remotely sensed data, Remote Sensing of Environment, 114, 867–875, 2010.