Overexpression in Ovarian Cancer
Brigitte L. The´riault1, Halesha D. Basavarajappa2, Harvey Lim1,3, Sanja Pajovic1, Brenda L. Gallie1,3,4,5*, Timothy W. Corson2,6*
1Campbell Family Cancer Research Institute, Princess Margaret Cancer Centre, Toronto, Ontario, Canada,2Eugene and Marilyn Glick Eye Institute, Department of Ophthalmology, and Department of Biochemistry and Molecular Biology, Indiana University School of Medicine, Indianapolis, Indiana, United States of America, 3Department of Medical Biophysics, University of Toronto, Toronto, Ontario, Canada,4Division of Visual Science, Toronto Western Hospital Research Institute, Toronto, Ontario, Canada,5Departments of Molecular Genetics and Ophthalmology, University of Toronto, Toronto, Ontario, Canada,6Indiana University Melvin and Bren Simon Cancer Center, Indianapolis, Indiana, United States of America
Abstract
KIF14(kinesin family member 14) is a mitotic kinesin and an important oncogene in several cancers. TumorKIF14expression levels are independently predictive of poor outcome, and in cancer cells KIF14 can modulate metastatic behavior by maintaining appropriate levels of cell adhesion and migration proteins at the cell membrane. Thus KIF14 is an exciting potential therapeutic target. Understanding KIF14’s regulation in cancer cells is crucial to the development of effective and selective therapies to block its tumorigenic function(s). We previously determined that close to 30% of serous ovarian cancers (OvCa tumors) exhibit low-level genomic gain, indicating one mechanism ofKIF14overexpression in tumors. We now report on transcriptional and epigenetic regulation ofKIF14. Through promoter deletion analyses, we identified onecis -regulatory region containing binding sites for Sp1, HSF1 and YY1. siRNA-mediated knockdown of these transcription factors demonstrated endogenous regulation ofKIF14overexpression bySp1andYY1, but notHSF1. ChIP experiments confirmed an enrichment of both Sp1 and YY1 binding to the endogenous KIF14 promoter in OvCa cell lines with high KIF14 expression. A strong correlation was seen in primary serous OvCa tumors betweenSp1,YY1andKIF14expression, further evidence that these transcription factors are important players inKIF14 overexpression. Hypomethylation patterns were observed in primary serous OvCa tumors, suggesting a minor role for promoter methylation in the control ofKIF14gene expression. miRNA expression analysis determined that miR-93, miR-144 and miR-382 had significantly lower levels of expression in primary serous OvCa tumors than normal tissues; treatment of an OvCa cell line with miRNA mimics and inhibitors specifically modulatedKIF14 mRNA levels, pointing to potential novel mechanisms ofKIF14 overexpression in primary tumors. Our findings reveal multiple mechanisms of KIF14 upregulation in cancer cells, offering new targets for therapeutic interventions to reduce KIF14 in tumors, aiming at improved prognosis.
Citation:The´riault BL, Basavarajappa HD, Lim H, Pajovic S, Gallie BL, et al. (2014) Transcriptional and Epigenetic Regulation ofKIF14Overexpression in Ovarian Cancer. PLoS ONE 9(3): e91540. doi:10.1371/journal.pone.0091540
Editor:Jean-Marc Vanacker, Institut de Ge´nomique Fonctionnelle de Lyon, France
ReceivedJune 21, 2013;AcceptedFebruary 13, 2014;PublishedMarch 13, 2014
Copyright:ß2014 The´riault et al. This is an open-access article distributed under the terms of the Creative Commons Attribution License, which permits unrestricted use, distribution, and reproduction in any medium, provided the original author and source are credited.
Funding:This work was funded by the U.S. Department of Defence Career Development Award; grant#OC080083, and the Marsha Rivkin Ovarian Cancer Center Scientific Scholar Award. This work was also supported in part by the Indiana Clinical and Translational Sciences Institute funded, in part by the United States National Institutes of Health, National Center for Advancing Translational Sciences, Clinical and Translational Sciences Award (TR000163; TWC). The funders had no role in study design, data collection and analysis, decision to publish, or preparation of the manuscript.
Competing Interests:The authors have declared that no competing interests exist. * E-mail: brenda@gallie.ca (BLG); tcorson@iupui.edu (TWC)
Introduction
KIF14was first identified as an oncogene and a contributor to malignant transformation in the childhood cancer retinoblastoma [1]. Located on chromosome 1q32.1, genomic gain of KIF14 occurs in up to 50% of retinoblastomas [1–3]. Our group and others have previously shown that KIF14 protein and mRNA are overexpressed in multiple cancers including ovarian cancers (OvCa tumors) [4–10]. We also reported that overall outcome of serous OvCa patients can be predicted based onKIF14 mRNA expression levels in their primary tumors. Further analysis of these samples showed that expression of KIF14 mRNA and protein exceed the levels expected based on the copy number gain alone, suggesting an up-regulation in the transcriptional control in cancer cells versus their respective normal counterparts.
Whereas the structure and function of other kinesins are fairly well understood, much less is known about their regulation at the DNA level. One study described roles of the transcription factors Sp1 and E2F1 in respectively activating and repressing the transcription of the human mitotic centromere-associated kinesin (MCAK) promoter [15]. No studies have yet been reported on KIF14. Understanding the mechanism of its gene regulation is crucial asKIF14emerges as an important target in cancer therapy. We now report identification of a putativecis-regulatory region of theKIF14promoter harbouring binding sites for the transcrip-tion factorsSp1,YY1andHSF1. Through siRNA knockdown and ChIP assays, we show that Sp1 and YY1, but not HSF1 directly bind to theKIF14promoter and control endogenousKIF14levels in OvCa cell lines. Furthermore, both Sp1and YY1expression levels correlate with KIF14mRNA expression in primary serous OvCa tumors, demonstrating their potential role in maintaining high KIF14 levels in OvCa tumor cells. Methylation analysis revealed that the human KIF14promoter is largely hypomethy-lated in OvCa primary tumors, normal ovary tissues, and cell lines, indicating that methylation is unlikely to regulateKIF14 overex-pression within OvCa tumors. However, a differential methylation pattern may exist in OvCa tumors expressing very high KIF14.
miRNA expression analysis of primary OvCa tumors and cell lines revealed three putative regulators (miR-93, miR-144 and miR-382) of KIF14 expression that have documented roles in tumorigenesis in cancer cells. We determined that these candidate miRNAs could directly modulate KIF14 mRNA expression, indicating their importance in maintaining elevated KIF14 tumor levels. Our results unveil a complexity of regulatory mechanisms drivingKIF14overexpression in OvCa tumors, and underscore the importance of understandingKIF14regulation to ultimately target this gene for therapeutic benefit.
Materials and Methods
Construction of Luciferase Reporter Plasmids
Sixteen different lengths of the KIF14 promoter (548 bp, 966 bp, 1514 bp, 1666 bp, 1787 bp, 1898 bp, 2032 bp, 2150 bp, 2245 bp, 2327 bp, 2366 bp, 2401 bp, 2466 bp, 2536 bp, 2898 bp, 4555 bp) all sharing common sequences at their proximal end were amplified by polymerase chain reaction (PCR) from genomic DNA of healthy retina using KOD Hot Start DNA Polymerase (Novagen) (Table S1). Promoter fragments were subcloned into StrataCloneTMBlunt PCR Cloning Vector pSC-B (Stratagene) and verified for correct insertion and orientation by restriction digest. PCR product was excised out using Kpn1/Sma1 restriction sites and inserted into pGL3-Basic vector (Promega) at complementary sites upstream of the luciferase gene generating the reporter constructs 548, 966, 1514, 1666, 1787, 1898, 2032, 2150, 2245, 2327, 2366, 2401, 2466, pGL3-2536, pGL3-2898, and pGL3-4555. Sequences of all 16 constructs aligned with the reference sequences from the NCBI website. The pRSV-Luciferase reporter plasmid was kindly provided by Dr. A. Schimmer, Ontario Cancer Institute.
Cell Culture
SKOV3 (a kind gift from Dr. Mark Nachtigal, University of Manitoba) [16] and HeLa cells (ATCC) were cultured in Dulbecco’s Modified Eagle’s Medium (DMEM) containing 10% fetal bovine serum (FBS) and penicillin/streptomycin/L-glutamine (P/S/G) (Invitrogen). OvCa 429 cells (Dr. Mark Nachtigal) [16] were cultured in alpha-MEM containing 10% FBS and P/S/G. WERI-Rb1 retinoblastoma cells (positive control for Sp1 binding)
were cultured in Iscove’s modified Dulbecco’s medium (IMDM) containing 10% FBS (PAA laboratories), P/S/G, 10mg/mL insulin, and 55mM b-mercaptoethanol. Cell cultures were maintained at 5% CO2with humidity in a 37uC incubator. Cell line identity was confirmed by short tandem repeat profiling.
Transfection of Reporter Constructs and siRNA
Trypsinized cells were seeded at a density of 56104cells/mL. 24 hours after seeding, equal amounts (0.5mg) of both reporter and cytomegalovirus-b-galactosidase (pCMV-b-gal, Promega) constructs were cotransfected into triplicate 12-well plates using Gene Juice (Novagen). To evaluate the endogenous effect of transcription factor knockdown onKIF14levels, a set of 3 siRNAs (Sigma Aldrich) forHSF1, Sp1, and YY1were transfected at an amount of 0.5 nmol into 60 mm dishes. Target sequences for each siRNA are listed in Table S2. Transfections were carried out in triplicate according to the manufacturers’ instructions and repeated at least three times.
Luciferase andb-galactosidase Assay
Cells that were cotransfected with reporter and pCMV-b-gal constructs were harvested 24 hours after transfection. Cell lysates were prepared and assayed for luciferase activity using the Luciferase Assay System (Promega) in accordance to its protocol. Luciferase activity was normalized to b-galactosidase activity (measured by hydrolysis of the colorimetric substrate ONPG [O -nitrophenyl b-d-galactopyranoside], Sigma) and expressed as a relative percentage of pRSV-Luc control.
Clinical Samples
Twenty-six fresh frozen OvCa tumor samples, ten fresh frozen normal non-neoplastic ovaries from patients undergoing oopho-rectomy for non-oncological conditions and four normal tubal epithelium tissues were obtained from the University Health Network (UHN) Biobank. The UHN Research Ethics Board approved the study of tissue samples and associated clinical data (#08-0884-TE), and all tissues were banked with written informed consent. Clinical data associated with the UHN Biobank samples were reviewed by a gynecological oncologist and gynecologic pathologist to ensure data integrity and quality, and all UHN Biobank tissues (adjacent H&E stained slides) were reviewed by a gynecologic pathologist to ensure samples contained.80% tumor cells.
Real-time PCR
conducted for each gene and each sample, and PCR performed using the SDS 7900HT system (ABI) as described [8]. SDS 2.1 software (ABI) was used to calculate theDDCt relative expression values, normalized to endogenous control genes and relative to either vector control (for cell line siRNA transfections) or expression of normal ovary and tubal epithelial tissue samples (for tissue measurements).
Western Blot Analysis
Seventy-two hours after transfecting siRNA, cells were harvest-ed and lysharvest-ed with buffer containing 20 mM Tris HCl pH 7.6, 150 mM NaCl, 1 mM ethylenediaminetetraacetic acid (EDTA), 1% Triton X-100, and the protease inhibitors aprotinin, leupeptin, and phenylmethanesulphonylfluoride (PMSF). Total cellular protein was quantified by Bradford assay (BioRad). 30mg was loaded onto a 4–12% gradient SDS-PAGE precast gel (Lonza) and transferred onto a polyvinylidene difluoride (PVDF) membrane and blocked with 5% BLOTTO (BioRad) in Tris-Buffered Saline-0.05% Tween-20 (TBST). Primary antibodies against KIF14 (Bethyl), Sp1, YY1 and HSF1 (Abcam) andb-tubulin (Sigma) were employed to detect endogenous protein expression. Horseradish peroxidase-labeled secondary antibodies (Chemicon) were detect-ed using a chemiluminescence reagent (Denville) and incubatdetect-ed with photographic film (Denville). Signal intensity measurements were calculated using Photoshop CS3.
Chromatin Immunoprecipitation (ChIP) Assay
ChIP assays were conducted with the ImprintH Chromatin Immunoprecipitation Kit (Sigma) according to manufacturer instructions. Briefly, 16105 cells were cultured, and the protein-DNA complexes cross-linked with 1% formaldehyde (final concentration), followed by nuclear fractionation and DNA shearing via sonication. Immunoprecipitations were carried out for 90 minutes at RT with antibodies against Sp1, YY1, HSF1 (Abcam), RNA polymerase II (positive control) and IgG (negative control). The cross-links were reversed, DNA was extracted and was used for both endpoint and real time PCR. Endpoint PCR was performed in 25mL reactions with KOD Hot Start DNA Polymerase (Novagen) and the appropriately designed primer pair (target promoter sequence: Forward: tta caa tgt gaa gtc ttc gat gta; Reverse: ctc tac tcc, cac ccc gc; RNA Pol II target sequence: hGAPDH-Forward: caa ttc ccc atc tca gtc gt; hGAPDH-Reverse: tag tag ccg ggc cct act tt, 246 bp). The PCR conditions were as follows: 95uC for 2 min followed by 40 cycles of denaturation at 95uC for 30 sec, annealing at 58uC for 30 sec, and extension at 72uC for 30 sec, and then a final extension period of 72uC for 10 min. Products were visualized using agarose gel electrophoresis. Signal intensity measurements were calculated using Photoshop CS3. Real time PCR was performed in triplicate using 1mL of ChIP DNA per reaction, along with 1X TaqMan Master Mix (ABI), 500 nM each primer and 250 nM probe. Primers were Forward: tga cac cca ctt caa cga gg and Reverse: tct ctg aat gct gga ctc gc, and the probe was cac gct tta gca gaa ccc gag gag, labeled with FAM and ZEN quencher (Integrated DNA Technologies, Coralville, IA, USA). Reactions were run using standard parameters on a ViiA7 instrument (Life Technologies). Ct values were normalized to IgG samples and relative quantity (RQ) calculated according to RQ = 22DCt
.
miRNA cDNA synthesis and quantitative real-time PCR
Total RNA extraction was performed as described above. A commercially available miRNA cDNA synthesis kit (TaqManH
MicroRNA Reverse Transcription Kit, Applied Biosystems) was used to reverse transcribe the candidate miRNAs with specific RT
primers (TaqManH miRNA Assays, Applied Biosystems). Se-quence-specific assays (TaqManH real-time PCR assays, Applied Biosystems, Table S3) were used to detect mature candidate miRNAs from primary tumor tissue extracts.RNU44, a small non-coding RNA with wide and constant tissue distribution (Applied Biosystems), was used as the endogenous control. Triplicate reactions were conducted for each gene and each sample, and PCR performed using the SDS 7900HT system (ABI) as described [8]. SDS 2.1 software (ABI) was used to calculate the DDCt relative expression values, normalized to endogenous control (RNU44) and relative to expression of normal ovary and tubal epithelial tissue samples (for tumor tissue measurements) or IOSE cells (for OvCa cell lines).
miRNA mimics and inhibitors
SKOV3 cells in 12-well plates were transfected with 50 nM of miR93, miR144 and miR382 mimics or inhibitors or correspond-ing non-codcorrespond-ing control mimic or inhibitor (Applied Biosystems) using 3mL of Lipofectamine 2000 (Invitrogen) reagent as per the manufacturer’s instructions. After 72 hours of transfection, total RNA was isolated and cDNA synthesized as described above. Expression levels of KIF14 and miRNAs of interest were analyzed as above, with qPCR performed using an Applied Biosystems ViiATM 7 real time PCR system. The relative expression values (RQ) of KIF14 or miRNAs normalized to endogenous control genes and relative to control treatment were calculated using ViiATM7 version 1.2 software.
Methylation analysis
Genomic DNA was isolated from primary OvCa tumor tissues and normal ovary controls as previously described [8]. Genomic DNA (200 ng) was modified and purified using a commercially available bisulphite modification kit (ImprintHDNA Modification Kit, Sigma) according to manufacturer’s instructions. A CpG island was identified (http://cpgislands.usc.edu/) within the 4500 bp KIF14 promoter region (22371 to 21129) (Figure S1A), and methylation-specific primers (,120 bp) against the largest CpG island within the KIF14 promoter using the online software Methprimer were designed (http://www.urogene.org/ methprimer/) (Figure S1B). Primer sequences were as follows: Methylated-specific: Forward: att taa agg ggg tta agt ttt acgt; Reverse: gat aat taa act ccg ata acc gtc; Unmethylated-specific: Forward: att taa agg ggg gtt agt ttt atgt; Reverse: caa taa tta aac tcc aat aac catc. One quarter of the purified bisulphite-treated DNA (5
mL of a 20mL eluate) was used in the methylation PCR reaction. End-point PCR reactions were conducted in 25mL final volume with Maxima Hot Start Taq Polymerase (Fermentas). The PCR conditions were as follows: 94uC for 3 min followed by 40 cycles of denaturation at 94uC for 30 sec, annealing at 60uC for 30 sec, and extension at 72uC for 30 sec, and then a final extension period of 72uC for 10 min. Products (,120 bp) were visualized using agarose gel electrophoresis. Densitometry was performed on grayscale images using Image J. Verification of bisulphite conversion of the DNA was conducted with unmodified calponin-specific primers (Figure S2) as described [17].
Statistical Analysis
KIF14 no gain categories and Sp1, YY1 and HSF1 mRNA expression were analyzed using Pearson’s Correlation Coefficient (r).
Results
Identification of aKIF14cis regulatory region in ovarian cancer cell lines
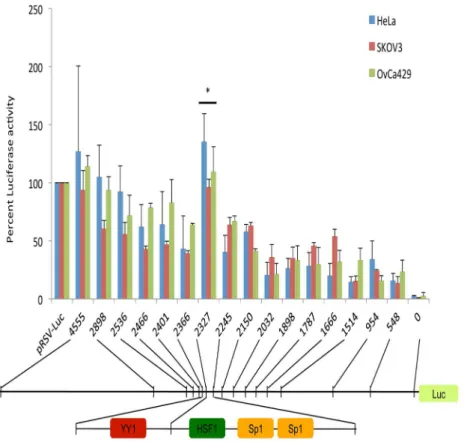
A 4500 bp region of genomic DNA immediately upstream of the human KIF14 transcriptional start site was amplified from normal human DNA, and deletional reporter analyses were conducted by cloning sequentially smaller regions of the KIF14 promoter into the pRSV-Luc promoter region. Luciferase activity was measured in OvCa429, SKOV3 and HeLa cells, and promoter activity was calculated in relation to pRSV-Luc expression (set at 100%). The entire promoter region construct (pGL3-4555) showed luciferase activity close to that of the positive control (pRSV-Luc). One highly active region was identified between -2366 and -2245 bp, demonstrating similar activity to the full promoter construct, but significantly more luciferase activity compared to all other deletion constructs for all three cell lines (P,0.05, Figure 1). Bioinformatic analysis of this active region through online analysis software (Genomatix) identified putative transcription factor binding sites forSp1,YY1andHSF1(Figure 1),
suggesting the presence of a potentialcisregulatory region within theKIF14promoter.
Sp1 and YY1 endogenously regulate KIF14 expression in OvCa cell lines
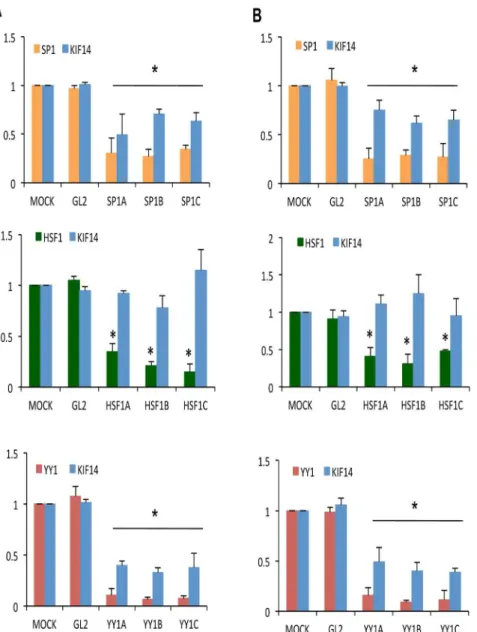
We tested whether these transcription factors affected KIF14 mRNA expression by siRNA-mediated knockdown of endogenous Sp1, HSF1 and YY1 in SKOV3 and OvCa429 cells. Transient knockdown resulted in a significant reduction of transcription factor (Sp1,HSF1,YY1) mRNA (Figure 2A, B). While knockdown ofHSF1had no significant effect on KIF14gene expression,Sp1 and YY1 knockdown resulted in significantly decreased KIF14 mRNA, suggesting that both Sp1 and YY1 act as enhancers of KIF14 transcription. In response toSp1and YY1knockdown, a decrease in transcription factor protein expression and associated KIF14 protein was confirmed via immunoblots (Figure 3) in SKOV3 cells. While HSF1 protein levels decreased in response to knockdown, no significant change in KIF14 protein expression was seen. Similar results were seen for OvCa429 cells (data not shown), indicating thatSp1andYY1may control the expression of KIF14in OvCa cell lines. The reduction in KIF14 mRNA and protein expression in response to Sp1 knockdown was less than with YY1 knockdown, and could likely be related to the efficiency of transcription factor knockdown (Figure 2A, B and Figure 3A, B). The reduction in KIF14 mRNA and protein was more
Figure 1. KIF14 promoter activity.Promoter deletion constructs fused to Luciferase were tested for activity in HeLa, SKOV3 and OvCa429 cells. pRSV-Luc, positive control, 0, empty vector control. Numbers are base pairs relative to the transcriptional start site (0). Bioinformatic analysis (Genomatix) of the most active region within theKIF14promoter (22366 to22245) identified putative binding sites for transcription factors YY1, HSF1 and Sp1. Specific transcription factor recognition sites are underlined, and space within sequence denotes location of deletion constructs. N = 3, * Significance atP,0.05, unpaired t-test.P= 0.01 (HeLa);P= 0.01 (SKOV3);P= 0.03 (OvCa429).
pronounced in response toYY1knockdown, suggesting that YY1 may be a major player in the regulation ofKIF14overexpression in these cells.
To verify whether Sp1 and YY1 could associate directly with theKIF14promoter, chromatin immunoprecipiation (ChIP) assays were conducted in SKOV3, OvCa429 and HeLa cells. We found that both Sp1 and YY1, but not HSF1 exhibited a much higher binding affinity to theKIF14promoter region than the IgG control (higher relative expression values; Figure 4). OvCa429 cells showed the greatest enrichment of binding for both Sp1 and
YY1 (over 10-fold; Figure 4A, B), while SKOV3 and HeLa cells showed more modest enrichment (on average 4-fold; Figure 4A, B). Binding of HSF1 to the KIF14 promoter was much less pronounced (on average 2-fold for all cell lines; Figure 4C). Enrichment in Sp1 and YY1 binding was also shown via endpoint PCR (Figure S3). These results confirm our mRNA and protein expression results by showing that both Sp1 and YY1 can bind directly to the KIF14 promoter. Combined, these data indicate that Sp1 and YY1 can endogenously regulateKIF14expression in OvCa cell lines.
Figure 2. Knockdown of endogenous SP1 and YY1 mRNA inhibits KIF14 transcription.siRNA knockdown of endogenousSp1(orange), HSF1(green), andYY1(red) transcription factors, and measurement of their mRNA expression along with correspondingKIF14mRNA levels (blue) via real-time PCR inASKOV3 andBOvCa429 cells. Y-axes: normalized mRNA expression relative to MOCK. GL2, control siRNA; N = 3, * Significance at P,0.05, unpaired t-test. Three different siRNA molecules (A, B, C) were used to knock down each gene. P values for panel A (SKOV3 cells):P= 0.02 for Sp1 expression (orange) with Sp1 siRNAs A, B, and C;P= 0.03 (siRNA-A),P= 0.047 (siRNA–B),P= 0.04 (siRNA–C) for KIF14 expression (blue).P= 0.001 for HSF1 expression (green) with HSF1 siRNAs A, B, and C;P= 0.23 (siRNA-A),P= 0.12 (siRNA-B),P= 0.4 (siRNA-C) for KIF14 expression (blue).P= 0.01 for YY1 expression (red) with YY1 siRNAs A, B and C;P= 0.006 for KIF14 expression (blue) with YY1 siRNAs A, B, and C. P values for panel B (OvCa429 cells):P= 0.03 for Sp1 expression (orange) with Sp1 siRNAs A, B, and C;P= 0.05 (siRNA-A),P= 0.04 (siRNA-B),P= 0.045 (siRNA-C) for KIF14 expression (blue).P= 0.003 for HSF1 expression (green) with HSF1 siRNAs A, B, and C;P= 0.31 (siRNA-A),P= 0.45 (siRNA-B),P= 0.39 (siRNA-C) for KIF14 expression (blue).P= 0.02 (siRNA-A),P= 0.01 (siRNA-B),P= 0.01 for YY1 expression (red);P= 0.02 (siRNA-A),P= 0.001 (siRNA-B),P= 0.006 (siRNA-C) for KIF14 expression (blue).
Sp1 and YY1 overexpression correlates with KIF14 overexpression
We have previously documented genomic gain ofKIF14in up to 30% of primary OvCa tumors that correlates with very high overexpression of KIF14 mRNA (KIF14HIGH) [8]. These data suggest that genomic gain is one mechanism through whichKIF14 is overexpressed in these tumors. To determine whether KIF14 overexpression in OvCa tumors could also be linked to transcriptional regulation, we measured mRNA expression of Sp1,YY1and HSF1 in a subset of OvCa tumor tissues with (15 samples) and without (50 samples)KIF14genomic gain. In OvCa tumors without genomic gain (50), we dichotomized the samples into two groups based on median expression, into either KIF14HIGHorKIF14LOWgroups, as we have previously reported [8]. Many of the 19 KIF14HIGH
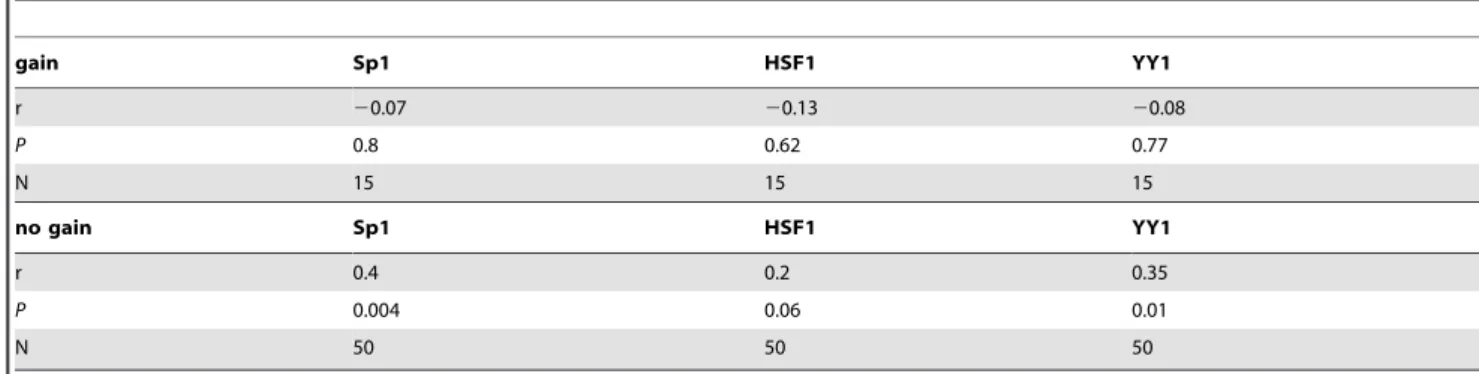
OvCa tumors expressed significantly higher levels ofSp1andYY1mRNA (Figure 5) than those with KIF14LOW overexpression (31), indicating potential roles for Sp1 and YY1 to maintain highKIF14levels in tumors. HSF1 mRNA levels were similar in all OvCa tumors, thus less likely to be important in regulatingKIF14mRNA. The meanYY1 expression level in primary OvCa tumors is much higher than the meanSp1expression level; together with theYY1knockdown data in cell lines (Figures 2 and 3), these results suggest that YY1 is an important regulator of KIF14 overexpression in OvCa tumors. In support of this, a strong correlation was seen betweenKIF14and Sp1orYY1expression, whereas none existed forHSF1 (Table 1 and Figure S4D–F). Tumors with KIF14 genomic gain demon-strated no transcription factor correlation (Table 1 and Figure
S4A–C), confirming that genomic gain is the mechanism controlling KIF14 overexpression in these tumors. Interestingly, a proportion (approximately 40%) ofKIF14HIGHtumors showed Sp1and YY1expression close to normal tissue levels (Figure 5), further implicating other biological mechanisms to potentially controlKIF14overexpression in OvCa tumors.
TheKIF14promoter is differentially hypomethylated in primary serous OvCa tumors and cell lines
Epigenetic mechanisms of gene regulation, such as aberrant DNA methylation have been identified to upregulate oncogene expression and silence tumor suppressors in many cancers [18]. In OvCa tumors, DNA methylation patterns have been investigated as potential biomarkers for tumor progression and response to therapy [19–25]. To study KIF14 promoter methylation, we documented theKIF14promoter region using the online software CpG Island Searcher (http://www.cpgislands.com). We identified a CpG island within the 4500 bpKIF14promoter region (22371 to21129) (Figure S1A), and designed methylation-specific primers (,120 bp) against the largest CpG island using the online software Methprimer (Figure S1B). Interestingly the location of this major CpG island coincides with the above-analyzed Sp1 and YY1 binding sites (Figure S1A). In support of our findings, it is well known that Sp1 recognition sites are commonly located within CpG islands [26]. Bisulphite conversion of tumor DNA from 20 serous OvCa tumors (10KIF14HIGHand 10KIF14LOW), 7 normal ovary tissues, and 4 OvCa cell lines (including 2 IOSE samples) was performed, followed by PCR using primers directed against
Figure 3. Knockdown of endogenous SP1 and YY1 protein inhibits KIF14 protein expression.A siRNA knockdown of endogenous Sp1 (orange), HSF1 (green), and YY1 (red) transcription factors, and measurement of their protein expression along with corresponding KIF14 protein levels (blue) via immunoblot in SKOV3 cells. x-axis: normalized protein expression relative to MOCK. B Representative immunoblot of KIF14 and transcription factor expression. Numbers represent normalized expression values for the experiment shown. Similar results were seen with OvCa429 cells. GL2, control siRNA; N = 3; *,P,0.05 for transcription factor expression;#,P,0.05 for KIF14 expression, unpaired t-test.Pvalues for panel A (SKOV3 cells): P= 0.009 (siRNA-A), P= 0.003 (siRNA-B), P= 0.006 (siRNA-C) for Sp1 expression (orange); P= 0.005 (siRNA-A), P= 0.007 (siRNA-B), P= 0.004 (siRNA-C) for KIF14 expression (blue).P= 0.01 for HSF1 expression (green) with HSF1 siRNAs A, B, and C;P= 0.54 (siRNA-A),P= 0.65 (siRNA-B), P= 0.41 (siRNA-C) for KIF14 expression (blue).P= 0.001 for YY1 expression (red) with YY1 siRNAs A, B and C;P= 0.01 (siRNA-A),P= 0.02 (siRNA-B), P= 0.005 (siRNA-C) for KIF14 expression (blue).
methylated/unmethylated residues. Complete bisulphite conver-sion of the DNA was verified with the use of unmodified calponin-specific primers (Figure S2). Most tissue and cell line samples tested, including normal ovary controls, demonstrated higher abundance of unmethylated product than methylated product (Figure 6), as evidenced by the unmethylated/methylated (U/M) ratios above 1 (Table S4). Interestingly, analysis of the U/M ratios betweenKIF14HIGHandKIF14LOWsamples revealed a statistically significant difference, wherein KIF14HIGH tumors demonstrated on average less unmethylated product (lower U/M means more methylated product) thanKIF14LOW(higher U/M ratio means less methylated product; P= 0.009; Table S4). The methylation patterns in normal ovary were much more variable, and not statistically different from KIF14LOW tumors (P= 0.27) but approaching significance for KIF14HIGH tumors (P= 0.054). A marked difference was also seen in U/M ratios between OvCa cell lines and IOSE cells, following the same trend as for the KIF14HIGH vs KIF14LOW tumors; however sample size (n = 2) precluded statistical analysis. These results indicate that differential
methylation patterns exist between OvCa tumors. Although in need of further investigation, the fact that unmethylated product is present in all normal and tumor tissues suggests a minor role for promoter methylation (of the particular region studied) in the control ofKIF14overexpression in OvCa tumor cells.
miR93, miR144 and miR382 expression are associated with KIF14 expression in primary OvCa tumors
MicroRNAs (miRNAs) are a large, extensively studied group of small non-coding RNAs that downregulate protein expression by targeting mRNA translation and/or stability [27]. miRNAs have been implicated in the control of expression of many crucial cellular gene expression pathways in normal and cancer cells, and have demonstrated roles in ovarian cancer pathogenesis and progression [28]. To determine whetherKIF14expression may be under miRNA control, we analyzed theKIF14gene region using 7 online miRNA binding site prediction tools (Table S5) that revealed multiple potential candidate miRNAs binding to the KIF14gene. The expression of 16 candidate miRNAs presenting
Figure 4. SP1 and YY1 bind endogenously to the human KIF14 promoter in cancer cell lines.ChIP assays of endogenous YY1, Sp1 and HSF1 followed by real time PCR with theKIF14promoter region (22300 to22133) in cell lines SKOV3, OvCa429, and HeLa compared to IgG (negative control). Values represent average quantity of promoter region product relative to IgG control. Error bars represent standard deviation of triplicate assays.
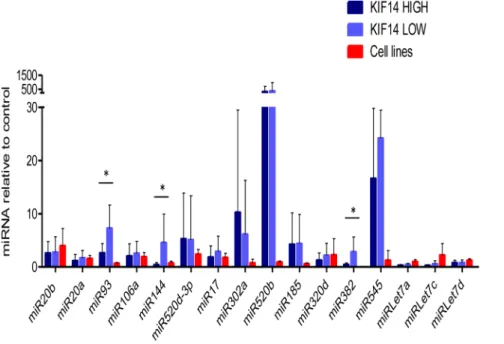
one or more hits was studied on 6 OvCa cell lines (including 2 immortalized ovarian surface epithelium (OSE) controls) and 26 primary serous OvCa tumors; half (13) with low KIF14 overex-pression (KIF14LOW), and half with high KIF14 overexpression (KIF14HIGH) [8]. Table S6 depicts miRNA expression of the 16 selected miRNAs for KIF14HIGH and KIF14LOW (depicted by sample number, followed by H for HIGH, L for LOW) serous OvCa tumors, and OvCa cell lines. miRNA expression was normalized to the endogenous control gene RNU44, and fold change was calculated in relation to mean expression of normal tissues (a mix of normal ovary and tubal epithelial tissues) for primary OvCa tumors, and mean expression of IOSE cells for OvCa cell lines. Three of the 16 selected miRNAs emerged as potential regulatory candidates, displaying significantly lower expression inKIF14HIGHOvCa tumors in relation toKIF14LOW OvCa tumors (highlighted in yellow): miR93, miR144, and miR382. Two-tailed, unpaired t-test analysis revealed that all three candidates displayed significantly lower miRNA expression inKIF14HIGHvs. KIF14LOW OvCa tumors (Table S6,P,0.01). Mean miRNA expression in KIF14HIGH and KIF14LOW tumors and OvCa cell lines with standard deviation is presented in
Figure 7. Pearson correlation analysis comparing miRNA expression levels of miR93, miR144 and miR382 with KIF14 mRNA expression in these same tumors revealed a significant negative correlation between miRNA andKIF14expression levels, indicating that highKIF14overexpression in OvCa tumors might be a consequence of the relatively low abundance of these candidate miRNAs (Table S6,P,0.04). The expression profile of the candidate miRNAs was also confirmed in OvCa cell lines in comparison to IOSE cells (Figure 7 and Table S6).
miR93, miR144 and miR382 modulateKIF14mRNA expression in an OvCa cell line
To determine whether the identified candidate miRNAs could modulateKIF14mRNA expression, we treated SKOV3 cells with either the candidate miRNA mimic or inhibitor, and measured KIF14mRNA expression via real time PCR. miR93 and miR144 mimics caused a modest but reproducible decrease in KIF14 mRNA expression that did not achieve statistical significance, while treatment with miR382 mimic resulted in a significant inhibition ofKIF14mRNA expression (Figure 8). Corresponding-ly, treatment with miR93 inhibitor resulted in a modest increase in KIF14 mRNA expression (Figure 8), while treatment with a miR382 inhibitor produced a substantial increase inKIF14mRNA expression (Figure 8). These results point to the potential that these candidate miRNAs (especially miR382) are modulators ofKIF14 mRNA levels in OvCas that could contribute to the overexpres-sion ofKIF14mRNA in OvCa tumors.
Discussion
We and others identified KIF14 as an important oncogene, prognostic indicator, biomarker and therapeutic target in the progression of multiple cancers, including retinoblastoma, glioma, breast, lung, renal, hepatocellular and ovarian cancers [1,4–
9,14,29–32].KIF14mRNA is highly overexpressed in the majority of OvCa tumors [8], and has recently been identified as a marker for taxane resistance in a small cohort of OvCa tumors [33]. Thus insight into the regulation of its overexpression is crucial for developing therapeutic approaches to reduceKIF14expression in OvCa cells. We have previously shown that a proportion of OvCa tumors demonstrate genomic gain of KIF14 (up to 30%, depending on histological subtype) that correlates with high mRNA overexpression, indicating genomic gain as one mecha-nism of KIF14 overexpression. Since over 90% of OvCas overexpressKIF14 mRNA, other mechanisms of overexpression are likely to exist within these tumors. The goal of this study was to characterize additional mechanisms of KIF14 overexpression in
Figure 5. KIF14HIGHOvCa tumors overexpress Sp1 and YY1.
Quantitative mRNA expression analysis of primary OvCa tumors with KIF14HIGH(red) andKIF14LOW(green) mRNA expression (but no KIF14 genomic gain) for Sp1 (circle), YY1 (triangle), and HSF1 (diamond) normalized to normal ovary expression (set as 1, black dashed line). Mean, black line. Individual tumors represented by symbols. * Significance at P,0.05, paired t-test. P= 0.03 (Sp1), P= 0.01 (YY1), P= 0.32 (HSF1).
doi:10.1371/journal.pone.0091540.g005
Table 1.Pearson correlation betweenKIF14gain/no gain tumors andSp1,HSF1andYY1mRNA.
gain Sp1 HSF1 YY1
r 20.07 20.13 20.08
P 0.8 0.62 0.77
N 15 15 15
no gain Sp1 HSF1 YY1
r 0.4 0.2 0.35
P 0.004 0.06 0.01
N 50 50 50
OvCa cells. This type of comprehensive gene regulation analysis is important prior to development of new therapeutic strategies.
We first characterized the regulation of theKIF14 promoter region in OvCa cell lines. We identified via luciferase reporter activity a cis-regulatory region within the ,4500 bp promoter region to harbour putative binding sites for the transcription factorsSp1,HSF1, andYY1. Through transient siRNA knockdown of these transcription factors in OvCa cell lines, we determined that inhibition of Sp1 and YY1, but not HSF1, significantly decreasedKIF14 mRNA expression. Furthermore, we show that both endogenous Sp1 and YY1 can bind to theKIF14promoter in OvCa cell lines, indicating their potential importance in OvCa progression. The consensus binding site for the Sp1 family of transcription factors is GGGGCGGGG. In our analysis of the KIF14 promoter region, only two partial Sp1 binding sites were found within the putativecisregulatory region; the siRNA, ChIP and expression data confirm a regulatory role for Sp1 in enhancing KIF14 expression, similar to previous data showing Sp1 regulation of theMCAKpromoter [15]. Sp1 is a ubiquitously expressed transcription factor that is involved in modulating normal and tumorigenic gene expression in multiple cancers. It is overexpressed in breast, thyroid, hepatocellular, prostate, pancre-atic, gastric, lung and ovarian cancers [34–37], and small molecule inhibitors of Sp1 have been tested in pre-clinical models with successful reduction in tumor burden [38,39]. Our data
demon-strate not only that Sp1 can enhanceKIF14expression in OvCa cell lines, but that Sp1 is overexpressed and correlates with high KIF14 overexpression in primary OvCa tumors. Targeting Sp1 expression may reduce KIF14 levels in tumor cells, and could contribute to a therapeutic strategy against OvCa progression.
YY1 is a transcription factor that also has documented roles in either enhancing or repressing gene expression in multiple cancers [40–42], however its tumorigenic overexpression and prognostic value have been the subject of debate due to conflicting reports for multiple cancers, including in breast, colon, prostate, osteosarco-ma, cervical and ovarian cancers [42]. Interestingly, YY1 has been shown to interact with general transcription factors such as Sp1 [43–47] to enhance gene expression. YY1 can bind to DNA and directly modulate transcriptional activity, and also act as a cofactor to recruit into an active transcriptional complex other factors, including Sp1 [42]. Based on our data, one can easily envision YY1 and Sp1 cooperating to enhance KIF14 overexpression in OvCa tumors. Detailed mechanisms of their interaction remain to be investigated.
HSF1 is a heat-shock response transcription factor that plays a tumorigenic role in multiple cancers [48]. Although we found HSF1 binding sites within the identifiedcisregulatory region of the KIF14 promoter, our data demonstrate no effect of HSF1 knockdown on KIF14 gene or protein expression, and very weak
Figure 6. The KIF14 promoter is hypomethylated in primary OvCas, OvCa cell lines and normal tissues.Methylation-specific PCR of primary OvCa tumors and cell lines. L, molecular weight ladder;+, methylated primers; -, unmethylated primers; n, normal ovary tissue; H,KIF14HIGH tumor; L,KIF14LOWtumor; red, tumors withKIF14gain; U/M ratio, ratio of unmethylated product to methylated product (bold); white star, 100 bp molecular weight maker.
endogenous binding of HSF1 to theKIF14promoter in OvCa cell lines.
Methylation analysis of the largest CpG island within the human KIF14 promoter revealed that the KIF14 promoter is largely hypomethylated in OvCa primary tumors, normal ovary tissues, and cell lines, indicating that methylation may not be a mechanism regulatingKIF14overexpression within OvCa tumors.
This result is not surprising, as theKIF14gene is crucial in normal and tumor cells to control the last stages of cytokinesis [12,13], and thus there is most likely a need for some expression (albeit low in normal tissues) to maintain normal proliferation and viability. However, the presence of more methylated product inKIF14HIGH tumors than KIF14LOW tumors indicates that a differential methylation pattern may exist between low and high KIF14
Figure 7. Candidate miRNA expression in primary OvCa tumors and OvCa cell lines.Mean miRNA expression inKIF14HIGH(dark blue) and KIF14LOW(light blue) primary serous OvCas, and established OvCa cell lines (red). Expression normalized to the endogenous control geneRNU44, relative to normal ovary tissues (primary OvCas) or IOSE (OvCa cell lines). * Significance,P,0.05, unpaired t-test.P= 0.002 (miR-93),P= 0.01 (miR-144), P= 0.006).
doi:10.1371/journal.pone.0091540.g007
Figure 8. Candidate miRNAs modulateKIF14mRNA expression in an OvCa cell line.SKOV3 cells were treated with either candidate miRNA mimics that increased miRNA expression 200–6000-fold, or miRNA inhibitors that decreased expression by 70–100%.KIF14mRNA expression was measured using real time PCR. Graph represents KIF14expression relative to negative control transfections. Average6 SD of three separate experiments shown. Significance: *,P,0.05; **,P,0.01 compared with control, one-way ANOVA with Dunnett’s post hoc tests.
tumors. Although warranting further investigation given that promoter methylation is generally seen as a mechanism of transcriptional repression [18], these results raise the intriguing possibility of a feedback mechanism, attempting, but inadequate to reduce KIF14 levels in tumors with high KIF14 expression. Although the other minor CpG islands were not tested, our results indicate that other mechanisms of gene regulation, such as genomic gain, transcriptional activation, or miRNA regulation are more likely to control KIF14 overexpression in serous OvCa tumors.
The knockdown of YY1produced a much larger decrease in KIF14 protein than mRNA, which prompted us to investigate the possibility that KIF14 could be regulated by miRNAs. Through miRNA binding site prediction software, we identified 16 putative miRNAs to bind to the KIF14 promoter region. Expression analysis of these miRNAs in OvCa cell lines and primary OvCa tumors in comparison to normal ovary tissues and IOSE cells revealed that miR93, miR144 and miR382 were expressed significantly lower inKIF14HIGH
primary OvCa tumors than in KIF14LOWtumors. These miRNAs were also expressed lower in established OvCa cell lines compared to IOSE cells, suggesting that these miRNAs are interesting potential regulators of KIF14 levels in the promotion of OvCa tumor progression worthy of further characterization. We determined that treatment of SKOV3 cells with candidate miRNA inhibitors specifically increased KIF14 mRNA expression. Although the role of these candidate miRNAs in the modulation ofKIF14protein levels has yet to be assessed, our results clearly implicate these miRNAs in the maintenance of KIF14 mRNA levels, and potential KIF14 overexpression in OvCa tumors. Interestingly, the largest increase in KIF14 mRNA expression resulted from miR382 inhibitor treatment; this candidate miRNA also showed the strongest inverse correlation with KIF14 mRNA expression in primary OvCa tumors, the lowest level of KIF14 mRNA expression in OvCa cell lines, and the greatest decrease in KIF14 mRNA expression when overexpressed. Our results thus highlight the potential importance of miR382 in the progression of OvCa tumors.
miR93 has been recently shown to have a role modulating cisplatin resistance in OvCa cell lines by targeting the PTEN tumor suppressor [49]. This study was conducted in established OvCa cell lines treated with chemotherapy, as opposed to the chemo-naı¨ve primary OvCa tumors for miRNA expression analysis in our study. Whether miR93 plays a role in modulating cisplatin resistance in primary OvCa tumors remains to be determined, however our results suggest that loss of miR93 may modulateKIF14mRNA overexpression in primary OvCa tumor cells to promote poor outcome. To date, miR144 has no documented role in OvCa tumors, but low miR144 levels are independently prognostic of poor outcome in primary colorectal cancers [50]. Decrease in miR382 expression has been correlated with poor outcomes in osteosarcomas [51]. miR382 is located at the 14q32 locus, which has been shown to be lost in primary OvCa tumors [52]; our results are the first evidence confirming miR382 as a novel oncogenic regulator within that region.
Only serous OvCa tumors were selected for methylation and miRNA analysis because i) serous OvCa tumors represent the most common histological subtype, and ii) KIF14 mRNA expression was predictive of poor outcome only in the serous subtype [8]. The number of samples (10 for methylation, 13 for miRNA analyses within each expression group) was studied because i) ample genetic material (both DNA and RNA) was available, and ii) these tumors had complete clinical outcome datasets (including progression-free and overall survival data). As
controls, two samples withKIF14genomic gain (224H and 332H) were included in both the methylation and miRNA analyses. 332H showed very low miRNA expression despite genomic gain, suggesting that multiple mechanisms (genomic gain and high KIF14 transcriptional activity) may be at play within the same tumor to ensureKIF14overexpression.
We have identified genomic, transcriptional and miRNA regulation as potential mechanisms of KIF14 overexpression in OvCa cell lines and primary tumor tissues. To our knowledge, this is the first report documenting the regulation of KIF14 overex-pression in primary tumors. However, the functional implication of these regulators in tumorigenesis needs more investigation. The limited number of samples employed in our studies did not allow for any predictive analysis of transcription factor or candidate miRNA expression with respect to patient outcome. Nonetheless, our data identify multiple mechanisms of KIF14 regulation in OvCa tumors, and provide insight into potentially novel avenues of therapeutic intervention to regulateKIF14expression in tumor cells. These results do not preclude the possibility that the overexpression ofKIF14 in OvCa tumors may be regulated via additional mechanisms (i.e., histone modifications and expression of histone modifying enzymes) [53], or that multiple mechanisms may be at play to drive KIF14 overexpression within the same tumor.
The dismal prognosis associated with many solid tumors arises from poorly effective therapies for treatment of recurrent disease. The identification of potential regulatory transcription factors and miRNAs will open the door for development of more precise, less invasive methods to predict outcome, as miRNAs especially are known to be stably detected in serum [54]; these candidate tumor miRNAs could be developed into non-invasive detection and/or prognostic markers. With further validation, these putative transcriptional regulators may be targets for selective anti-KIF14 therapy.
Supporting Information
Figure S1 Methylation specific PCR. ACpG island analysis of the KIF14 promoter identified one CpG island between22371 to21129 (1243 bp). Blue line delineates the CpG island, while red lines represent potential methylated CpG residues. B Design of methylation-specific primers for the KIF14 promoter.
(TIF)
Figure S2 Calponin PCR. Calponin PCR of primary OvCa tumors and cell lines. L, molecular weight ladder; n, normal ovary tissue; H,KIF14HIGHtumor; L,KIF14LOWtumor; red, tumors with KIF14gain.
(TIF)
Figure S3 SP1 and YY1 bind endogenously to the human KIF14 promoter in OvCa cell lines. ChIP assays of endogenous YY1, Sp1 and HSF1 with theKIF14promoter region (22150 to 22366 = 216 bp amplicon, black arrow) in cell lines SKOV3, OvCa429, and WERI-Rb1 (positive control for Sp1 binding), compared to IgG (negative control and RNA pol II (positive control for ChIP, 250 bp amplicon). Numbers represent relative expression values (normalized to RNA pol II, relative to IgG) Black asterisk, 200 bp marker.
(TIF)
YY1 (C, F) mRNA expression. r = correlation coefficient; P significance at,0.05; N = number of samples.
(TIF)
Table S1 Primer sequences for PCR of KIF14 promoter fragment.
(TIF)
Table S2 Target sequences for siRNAs.
(TIF)
Table S3 Sequences for miRNA specific assays.
(TIF)
Table S4 Unmethylated/Methylated DNA ratios.
(TIF)
Table S5 miRNA database predictions for miRNA candidates binding to the KIF14 promoter.
(TIF)
Table S6 miRNA expression analyses of primary OvCas and OvCa cell lines.Highlighted miRNAs represent significant
difference in expression betweenKIF14HIGH(H) and KIF14LOW (L) OvCas. AVG, average, STDEV, standard deviation. t-test, comparison of miRNA expression between KIF14HIGH and KIF14LOW groups. Pearson correlation, comparison of miRNA expression to KIF14 expression in the entire tumor cohort. P,0.05, significant difference.
(TIF)
Acknowledgments
We thank Dr. Patricia Shaw and Dr. Marcus Bernardini for pathology review of the tumor tissues.
Author Contributions
Conceived and designed the experiments: BT HB HL SP BG TC. Performed the experiments: BT HB HL. Analyzed the data: BT HB HL SP BG TC. Contributed reagents/materials/analysis tools: BT HB HL SP BG TC. Wrote the paper: BT TC. Editing of manuscript: BT HB HL SP BG TC.
References
1. Corson TW, Huang A, Tsao MS, Gallie BL (2005) KIF14 is a candidate oncogene in the 1q minimal region of genomic gain in multiple cancers. Oncogene 24: 4741–4753.
2. Bowles E, Corson TW, Bayani J, Squire JA, Wong N, et al. (2007) Profiling genomic copy number changes in retinoblastoma beyond loss of RB1. Genes Chromosomes Cancer 46: 118–129.
3. Theriault BL, Corson T.W. (2012) Kinesin Family Member 14 (KIF14). Atlas of Genetics and Cytogenetics in Oncology and Haematology.
4. Corson TW, Gallie BL (2006) KIF14 mRNA expression is a predictor of grade and outcome in breast cancer. Int J Cancer 119: 1088–1094.
5. Corson TW, Zhu CQ, Lau SK, Shepherd FA, Tsao MS, et al. (2007) KIF14 messenger RNA expression is independently prognostic for outcome in lung cancer. Clin Cancer Res 13: 3229–3234.
6. Markowski J, Oczko-Wojciechowska M, Gierek T, Jarzab M, Paluch J, et al. (2009) Gene expression profile analysis in laryngeal cancer by high-density oligonucleotide microarrays. J Physiol Pharmacol 60 Suppl 1: 57–63. 7. Markowski J, Tyszkiewicz T, Jarzab M, Oczko-Wojciechowska M, Gierek T, et
al. (2009) Metal-proteinase ADAM12, kinesin 14 and checkpoint suppressor 1 as new molecular markers of laryngeal carcinoma. Eur Arch Otorhinolaryngol 266: 1501–1507.
8. Theriault BL, Pajovic S, Bernardini MQ, Shaw PA, Gallie BL (2012) Kinesin family member 14: an independent prognostic marker and potential therapeutic target for ovarian cancer. Int J Cancer 130: 1844–1854.
9. Wang Q, Wang L, Li D, Deng J, Zhao Z, et al. (2013) Kinesin family member 14 is a candidate prognostic marker for outcome of glioma patients. Cancer Epidemiol 37: 79–84.
10. Yang T, Zhang XB, Zheng ZM (2013) Suppression of KIF14 expression inhibits hepatocellular carcinoma progression and predicts favorable outcome. Cancer Sci 104: 552–557.
11. Filges I, Nosova E, Bruder E, Tercanli S, Townsend K, et al. (2013) Exome sequencing identifies mutations in KIF14 as a novel cause of an autosomal recessive lethal fetal ciliopathy phenotype. Clin Genet.
12. Carleton M, Mao M, Biery M, Warrener P, Kim S, et al. (2006) RNA interference-mediated silencing of mitotic kinesin KIF14 disrupts cell cycle progression and induces cytokinesis failure. Mol Cell Biol 26: 3853–3863. 13. Gruneberg U, Neef R, Li X, Chan EH, Chalamalasetty RB, et al. (2006) KIF14
and citron kinase act together to promote efficient cytokinesis. J Cell Biol 172: 363–372.
14. Ahmed SM, Theriault BL, Uppalapati M, Chiu CW, Gallie BL, et al. (2012) KIF14 negatively regulates Rap1a-Radil signaling during breast cancer progression. J Cell Biol 199: 951–967.
15. Jun DY, Park HS, Lee JY, Kim YH (2008) Regulation of the human mitotic centromere-associated kinesin (MCAK) promoter by the transcription factors Sp1 and E2F1. Biochim Biophys Acta 1779: 356–361.
16. Shepherd TG, Theriault BL, Campbell EJ, Nachtigal MW (2006) Primary culture of ovarian surface epithelial cells and ascites-derived ovarian cancer cells from patients. Nat Protoc 1: 2643–2649.
17. Sriraksa R, Chaopatchayakul P, Jearanaikoon P, Leelayuwat C, Limpaiboon T (2010) Verification of complete bisulfite modification using Calponin-specific primer sets. Clin Biochem 43: 528–530.
18. Suva ML, Riggi N, Bernstein BE (2013) Epigenetic reprogramming in cancer. Science 339: 1567–1570.
19. Bijron JG, Bol GM, Verheijen RH, van Diest PJ (2012) Epigenetic biomarkers in the diagnosis of ovarian cancer. Expert Opin Med Diagn 6: 421–438.
20. Chiang YC, Chang MC, Chen PJ, Wu MM, Hsieh CY, et al. (2013) Epigenetic silencing of BLU through interfering apoptosis results in chemoresistance and poor prognosis of ovarian serous carcinoma patients. Endocr Relat Cancer 20: 213–227.
21. Heichman KA, Warren JD (2012) DNA methylation biomarkers and their utility for solid cancer diagnostics. Clin Chem Lab Med 50: 1707–1721.
22. Ho CM, Huang CJ, Huang CY, Wu YY, Chang SF, et al. (2012) Promoter methylation status of HIN-1 associated with outcomes of ovarian clear cell adenocarcinoma. Mol Cancer 11: 53.
23. Joung JG, Kim D, Kim KH, Kim JH (2013) Extracting coordinated patterns of DNA methylation and gene expression in ovarian cancer. J Am Med Inform Assoc.
24. Stefansson OA, Villanueva A, Vidal A, Marti L, Esteller M (2012) BRCA1 epigenetic inactivation predicts sensitivity to platinum-based chemotherapy in breast and ovarian cancer. Epigenetics 7: 1225–1229.
25. Wang YQ, Yan Q, Zhang JR, Li SD, Yang YX, et al. (2013) Epigenetic inactivation of BRCA1 through promoter hypermethylation in ovarian cancer progression. J Obstet Gynaecol Res 39: 549–554.
26. Deaton AM, Bird A (2011) CpG islands and the regulation of transcription. Genes Dev 25: 1010–1022.
27. Thorsen SB, Obad S, Jensen NF, Stenvang J, Kauppinen S (2012) The therapeutic potential of microRNAs in cancer. Cancer J 18: 275–284. 28. Zaman MS, Maher DM, Khan S, Jaggi M, Chauhan SC (2012) Current status
and implications of microRNAs in ovarian cancer diagnosis and therapy. J Ovarian Res 5: 44.
29. Dimaras H, Khetan V, Halliday W, Orlic M, Prigoda NL, et al. (2008) Loss of RB1 induces non-proliferative retinoma: increasing genomic instability corre-lates with progression to retinoblastoma. Hum Mol Genet 17: 1363–1372. 30. Kim TM, Yim SH, Shin SH, Xu HD, Jung YC, et al. (2008) Clinical implication
of recurrent copy number alterations in hepatocellular carcinoma and putative oncogenes in recurrent gains on 1q. Int J Cancer 123: 2808–2815.
31. Madhavan J, Mitra M, Mallikarjuna K, Pranav O, Srinivasan R, et al. (2009) KIF14 and E2F3 mRNA expression in human retinoblastoma and its phenotype association. Mol Vis 15: 235–240.
32. Szponar A, Zubakov D, Pawlak J, Jauch A, Kovacs G (2009) Three genetic developmental stages of papillary renal cell tumors: duplication of chromosome 1q marks fatal progression. Int J Cancer 124: 2071–2076.
33. Ehrlichova M, Mohelnikova-Duchonova B, Hrdy J, Brynychova V, Mrhalova M, et al. (2013) The association of taxane resistance genes with the clinical course of ovarian carcinoma. Genomics 102: 96–101.
34. Chuang JY, Wu CH, Lai MD, Chang WC, Hung JJ (2009) Overexpression of Sp1 leads to p53-dependent apoptosis in cancer cells. Int J Cancer 125: 2066– 2076.
35. Davie JR, He S, Li L, Sekhavat A, Espino P, et al. (2008) Nuclear organization and chromatin dynamics—Sp1, Sp3 and histone deacetylases. Adv Enzyme Regul 48: 189–208.
36. Kong LM, Liao CG, Fei F, Guo X, Xing JL, et al. (2010) Transcription factor Sp1 regulates expression of cancer-associated molecule CD147 in human lung cancer. Cancer Sci 101: 1463–1470.
37. Li L, Davie JR (2010) The role of Sp1 and Sp3 in normal and cancer cell biology. Ann Anat 192: 275–283.
39. Previdi S, Malek A, Albertini V, Riva C, Capella C, et al. (2010) Inhibition of Sp1-dependent transcription and antitumor activity of the new aureolic acid analogues mithramycin SDK and SK in human ovarian cancer xenografts. Gynecol Oncol 118: 182–188.
40. Simon JA, Lange CA (2008) Roles of the EZH2 histone methyltransferase in cancer epigenetics. Mutat Res 647: 21–29.
41. Yu H, Mashtalir N, Daou S, Hammond-Martel I, Ross J, et al. (2010) The ubiquitin carboxyl hydrolase BAP1 forms a ternary complex with YY1 and HCF-1 and is a critical regulator of gene expression. Mol Cell Biol 30: 5071– 5085.
42. Zhang Q, Stovall DB, Inoue K, Sui G (2011) The oncogenic role of Yin Yang 1. Crit Rev Oncog 16: 163–197.
43. Zhou Q, Gedrich RW, Engel DA (1995) Transcriptional repression of the c-fos gene by YY1 is mediated by a direct interaction with ATF/CREB. J Virol 69: 4323–4330.
44. Usheva A, Shenk T (1996) YY1 transcriptional initiator: protein interactions and association with a DNA site containing unpaired strands. Proc Natl Acad Sci U S A 93: 13571–13576.
45. Seto E, Lewis B, Shenk T (1993) Interaction between transcription factors Sp1 and YY1. Nature 365: 462–464.
46. Austen M, Luscher B, Luscher-Firzlaff JM (1997) Characterization of the transcriptional regulator YY1. The bipartite transactivation domain is independent of interaction with the TATA box-binding protein, transcription factor IIB, TAFII55, or cAMP-responsive element-binding protein (CPB)-binding protein. J Biol Chem 272: 1709–1717.
47. Renna M, Caporaso MG, Bonatti S, Kaufman RJ, Remondelli P (2007) Regulation of ERGIC-53 gene transcription in response to endoplasmic reticulum stress. J Biol Chem 282: 22499–22512.
48. Ciocca DR, Arrigo AP, Calderwood SK (2013) Heat shock proteins and heat shock factor 1 in carcinogenesis and tumor development: an update. Arch Toxicol 87: 19–48.
49. Fu X, Tian J, Zhang L, Chen Y, Hao Q (2012) Involvement of microRNA-93, a new regulator of PTEN/Akt signaling pathway, in regulation of chemothera-peutic drug cisplatin chemosensitivity in ovarian cancer cells. FEBS Lett 586: 1279–1286.
50. Iwaya T, Yokobori T, Nishida N, Kogo R, Sudo T, et al. (2012) Downregulation of miR-144 is associated with colorectal cancer progression via activation of mTOR signaling pathway. Carcinogenesis 33: 2391–2397.
51. Sarver AL, Thayanithy V, Scott MC, Cleton-Jansen AM, Hogendoorn PC, et al. (2013) MicroRNAs at the human 14q32 locus have prognostic significance in osteosarcoma. Orphanet J Rare Dis 8: 7.
52. Kim SW, Kim JW, Kim YT, Kim JH, Kim S, et al. (2007) Analysis of chromosomal changes in serous ovarian carcinoma using high-resolution array comparative genomic hybridization: Potential predictive markers of chemore-sistant disease. Genes Chromosomes Cancer 46: 1–9.
53. Campbell MJ, Turner BM (2013) Altered histone modifications in cancer. Adv Exp Med Biol 754: 81–107.