ISSN 0104-6632 Printed in Brazil
www.abeq.org.br/bjche
Vol. 33, No. 02, pp. 271 - 277, April - June, 2016 dx.doi.org/10.1590/0104-6632.20160332s00003588
Brazilian Journal
of Chemical
Engineering
BATTERY RECYCLING: EFFECT OF CURRENT
DENSITY ON MANGANESE RECOVERY
THROUGH ELECTROLYTIC PROCESS
E. R. R. Roriz
1, D. C. R. Espinosa
2and J. A. S. Tenório
2*1Instituto Federal do Espírito Santo, Av. Vitória 1729, CEP: 29040-780, Vitória - ES, Brazil. 2
Escola Politécnica, University of São Paulo, Department of Chemical Engineering, Av. Prof. Lineu Prestes 580, Bloco 18, Conjunto das Químicas, CEP: 05508-000, São Paulo - SP, Brazil.
E-mail: [email protected]
(Submitted: June 19, 2014 ; Revised: December 24, 2014 ; Accepted: February 19, 2015)
Abstract - This work aims to verify the possibility of using depleted batteries as a source of manganese dioxide applying the electrolytic process. An electrolyte solution containing the following metal ions was used: Ca (270 mgL-1), Ni (3.000 mgL-1), Co (630 mgL-1), Mn (115.3 mgL-1), Ti (400 mgL-1) and Pb (20 mgL-1). The production of electrolytic manganese dioxide (EMD) was performed through electrolysis at 98 °C (± 2 °C) applying different current densities (ranging from 0.61 A.dm-2 to 2.51 A.dm-2). The materials obtained were analyzed through X-ray fluorescence spectrometry, X-ray diffraction, specific surface area (BET) and scanning electron microscopy (SEM). The best results regarding the current efficiency, purity grade and specific surface area were obtained with a current density ranging between 1.02 A.dm-2 and 1.39 A.dm-2. The allotropic ε-MnO2 variety was found in all tests.
Keywords: Batteries; Recycling; Manganese dioxide.
INTRODUCTION
Electrolytic manganese dioxide (EMD) is the main active component present in the cathodes of several cell systems. The most common system among those using manganese dioxide is the system of primary alkaline batteries Zn/MnO2. This component is also
found in the aqueous system of zinc-carbon batteries and in some lithium batteries. Currently, manganese dioxide has been investigated as a precursor in the production of spinel (LiMn2O4), one of the main
components to be used as cathodic material for re-chargeable lithium batteries (Strobel et al., 2003; Komaba et al., 2005). Recycling of batteries has been studied in recent years, but the recovery of materials present remains a challenge (Espinosa, et al., 2004; Bernardes et al., 2004; Espinosa and Tenório, 2004; Espinosa and Tenório, 2006).
The use of electrolytic manganese dioxide in the alkaline battery industry exceeded 23.000 t/year in 2.002 (Zhang and Cheng, 2007). The high consump-tion of this substance is because of the growing de-mand for batteries in the market worldwide, gener-ated by the mass production and consumption of portable electronic devices such as digital cameras, telephones, computers and high-tech toys, whose power supplies are almost exclusively batteries based on a Zn/MnO2 system. These cells represent a
sig-nificant percentage of the total number of batteries available in the market, mainly due to the charac-teristics of the manganese dioxide cathode perform-ance (Browning and Donne, 2005) and its low cost.
low-grade manganese ores (lower than 40%), of ocean manganese nodules and manganese-containing materials such as steel scrap, spent electrodes, used catalysts, and spent batteries (Zhang and Cheng, 2007).
Considering these studies, this work focuses on the recovery of manganese from spent batteries, which is feasible due to the high content of manga-nese dioxide (28 to 38 wt.%) present in the composi-tion of cells produced with this material.
The hydrometallurgical process has been widely used for separation of the metals contained in batter-ies (Sayilgan et al., 2009; Li et al., 2009; Vatistas et al., 2001; Provazi et al., 2011).The solution from the hydrometallurgical treatment process for battery recycling can be a potentially important source of manganese.
The objective of this work focuses on the electro-lytic process for recovering the manganese present in the sulfuric leaching liquor of exhausted batteries.
MATERIALS AND METHODS
The purpose of this study was to obtain electro-lytic manganese dioxide from the synthetic solution prepared, taking into consideration results obtained elsewhere (Provazi et al., 2011). Provazi et al. (2011) studied the sulfuric acid leaching of a mixture of household batteries from a municipal collection box.
ElectrolyticSolution Preparation
The reagents used in the solution preparation were cobalt sulfate heptahydrate (Merck PA), man-ganous sulfate monohydrate (Proquimios PA), cal-cium sulfate dehydrate (Carlo Erba PA), nickel sulfate hexahydrate (Vetec PA), lead sulfate (Aldrich PA), titanium (IV) oxide (Vetec) and sulfuric acid (Vetec).
The solution was prepared by adding the following reagents: MnSO4.H2O, CoSO4.7H2O, CaSO4.2H2O,
NiSO4.6H2O, PbSO4, concentrated H2SO4, solution
of titanium and enough Mili-Q water (a water purifi-cation system that involves steps of filtration and deionization)to complete a liter of the solution. The amount of each reagent added was calculated to pro-vide the ions and the pH value corresponding to the solution found in a previous study (Provazi et al.,
2011).
Table 1 provides the values of concentrations in mgL-1 of metal ions and the final pH of the electro-lytic solution.
Table 1: Composition of electrolyte solution.
Reactant Metallic íon Ion conc. (mg/L)
pH
MnSO4.H2O Mn2+ 115, 300
0.3
CoSO4.7H2O Co2+ 630
CaSO4.2H2O Ca2+ 270
NiSO4.6 H2O Ni2+ 3000
PbSO4 Pb2+ 20
TiO2 Acid solution TiO2+ 400
Electrolysis Tests
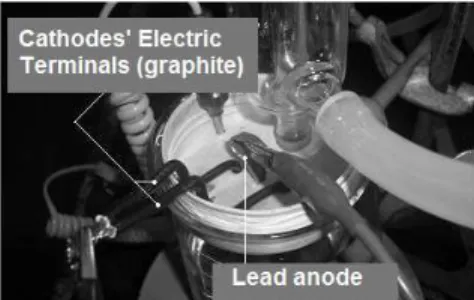
The cell used during the electrolytic process con-sisted of a 250 mL beaker, for which a special round plastic lid was created. The lid contains openings to hold: two counter electrodes, a working electrode, a thermometer and a condenser, as shown in Figure 1 and Figure 2. A lead plate 5.0 cm high, 2.0 cm wide and 0.1 cm thick was used as the working electrode (anode) and two graphite plates 2.5 cm high, 1.0 cm wide, and 0.5 cm thick as counter electrode (cathode).
Condenser
Beaker Thermometer
Electrodes
Heating Plate
Figure 1: Electrochemical cell developed for pro-duction of EMD.
Five samples of electrolyte solution with pH 0.30, containing 150 mL each, were anodically electrolyzed during 4 hours, at a temperature of 98 °C (± 2 °C). For each sample, a different range of current density was used, varying from 0.61 to 2.51A.dm-2. After each test, the anode was removed from the electrolytic cell and washed with Mili-Q water and dried at 100 °C. EMD deposits were mechanically removed from the anode and were repeatedly washed with Mili-Q water. Afterwards, the EMD was dried at a temperature of 100 °C. Table 2 contains a summary of the tests performed.
Table 2: Tests and parameters used in the electroly-sis tests performed at different current densities.
Tests J (A.dm-2) Temp. (°C) Time (h)
DMEJ 0.61 0.61
98 4
DMEJ 1.02 1.02
DMEJ 1.39 1.39
DMEJ 1.93 1.93
DMEJ 2.51 2.51
Characterization
The characterization of the EMD deposits, col-lected from the anodes was performed to identify the characteristics of the product obtained.
The following techniques were used: X-ray fluo-rescence spectrometry, X-ray diffraction, determina-tion of specific surface area by the BET method and scanning electron microscopy (SEM).
As samples were composed of oxides, it was neces-sary to sputter all samples with gold. Consequently, this element appeared in the spectrum when EDS analysis was carried out.
RESULTS AND DISCUSSION
Current Efficiency
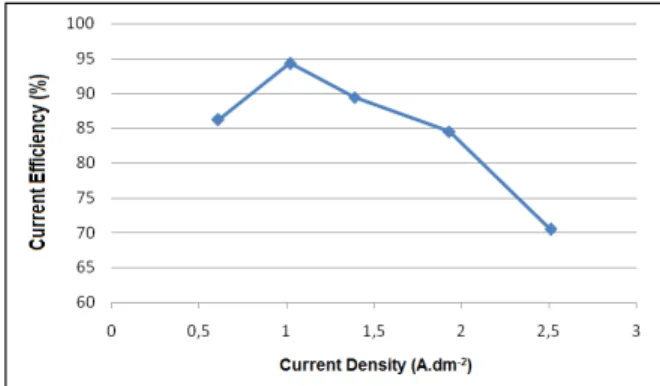
The anodic current efficiency behavior during the electrolytic process was analyzed varying the current density. Figure 3 shows the anodic current efficiency for tests performed at different current densities.
The current efficiency in the process for obtaining manganese dioxide initially rose with increasing current density, achieving a maximum (94.3%), and then decreased. The maximum efficiency was noted at the current density of 1.02A.dm-2, which is the value usually adopted in the industrial process for obtaining EMD. A sharp decrease of current effi-ciency (70.5%) with increasing current density (2.51A.dm-2) was noticed. This variation of current
efficiency takes place because, under high current density, the electrolysis of water occurs and the evo-lution of oxygen can become a competitive reaction in place of the deposition of manganese dioxide, reducing the current efficiency (Ghaemi and Binder, 2002).
Figure 3: Effect of current density on the anodic current efficiency in tests for the production of EMD.
Another aspect that should be considered is the fact that, under high current density, the rate of depo-sition is higher than the transport of ions to the elec-trode and the concentration of metal ions near the anode is reduced (Ghaemi and Binder, 2002).
These results are close to those found by Ghaemi and Binder (2002), who verified that efficiencies higher than 90% (from 91 to 99%) can be obtained at a current density of around 1 A.dm-2. A current effi-ciency of 80% was obtained in the range of 1.35 A.dm-2 to 1.39 A.dm-2 and at a very high density such as 3.75 A.dm-2, the current efficiency decreased to 36%.
Specific Surface Area
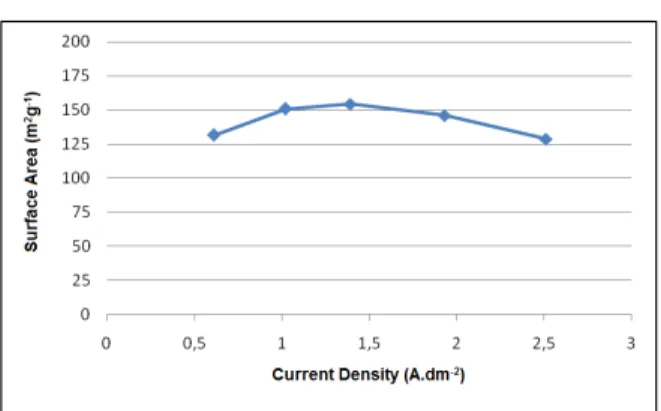
The values of specific surface area obtained through the BET method in the EMD samples pro-duced at different current densities, are shown in Figure 4.
Figure 4: Effect of current density on the surface area of electrolytic manganese dioxide.
Davis et al. (2001) state that the EMD is a dense solid with significant internal porosity, which leads to a large BET surface area (20 – 100 m2g-1).
The increase in the specific surface area with the current density is presumably due to a high nuclea-tion rate with high current density, which results in many small primary particles (Tamura et al., 1997).
Chemical Analysis
The chemical composition of EMD samples pro-duced at different current densities is shown in Table 3.
The range used for the variation of current den-sity (0.61 A.dm-2 to 2.51 A.dm-2) does not signifi-cantly affect the content of MnO2 present in the final
products, which showed levels above 90%.
Table 3: Results of chemical analysis by X-ray fluorescence spectrometry of the EMD samples obtained at different current densities (in mass percentage).
Composition J=0.61 A.dm-2
J=1.02 A.dm-2
J=1.39 A.dm-2
J=1.93 A.dm-2
J=2.51 A.dm-2
F 1.89 1.73 1.73 nd 1.38
Na nd nd nd nd nd
Al nd 0.01 0.01 0.01 0.01
Si 0.01 0.03 0.07 0.02 0.03
P << << << << 0.01
S 1.33 0.64 0.78 0.94 0.57
K 0.14 0.15 0.18 0.22 0.20
Ca 0.01 0.01 nd 0.01 nd
Ti 0.67 0.63 0.52 0.52 0.84
MnO2 94.98 95.44 95.83 97.35 96.00
Fe 0.13 0.16 0.12 0.13 0.14
Co 0.20 0.15 0.08 0.14 0.11
Ni 0.14 0.09 0.12 0.10 0.09
Zn nd nd nd 0.02 nd
Pb 0.50 0.96 0.56 0.54 0.62
Comparing these results with the specifications of commercial electrolytic manganese dioxide, in regard
to the concentration of MnO2, the results obtained
were in accordance with the specifications required for use in battery production where 91% MnO2 (dry
basis) is the minimum concentration of MnO2
al-lowed.
Analyzing the impurities present in the results, there was contamination in the materials obtained by the electrolytic process. Such contamination is due to the impurities in the chemicals used for the solution preparation.
X-Ray Diffraction
Figure 5 shows a typical X-ray diffractogram ob-tained in the tests performed at current densities of 0.61 A.dm-2, 1.02 A.dm-2, 1.93 A.dm-2, 1.39 A.dm-2, and 2.51 A.dm-2 after a 4-hour period, at a temperature of 98 °C. The X-ray diffraction analyses of all samples presented consistent results for the crystallographic file JCPDS 30-0820, referring to the ε-MnO2
allo-tropic form. The ε-MnO2 phase is the desirable
allo-tropic form of EMD usually used in batteries.
Figure 5: X-ray diffraction pattern of EMD obtained at 98 °C after 4h of test (* - MnO2).
Scanning Electron Microscopy
Figure 6 shows features of the surfaces of parti-cles deposited on the lead electrode at different an-odic current densities after a 4 hour period.
The surfaces of EMD samples were covered with fine cracks that appeared when the deposits were cooled after the removal from the hot solution. A greater number of cracks in the deposits were espe-cially observed (Figure 6e) at higher current density (2.51A.dm-2). The increase in the current density caused an increase in the thickness of the deposit. The observed cracks on the surface of the deposit should be a consequence of the handling of a thicker material.
Figure 6 (d and e). The deposits obtained at lower current density presented a smoother surface aspect, as shown in Figure 6a and 6b; however, the deposit obtained at a current density of 1.02 A.dm-2 showed a structure with fairly smooth appearance (Figure 6b).
Figure 7 shows a typical EDS spectra of the sur-face of EMD produced at different anodic current densities.
The EDS spectra were similar. Manganese was indicated as the predominant element in the com-position of the electroplated material obtained. This fact is compatible with the chemical analysis carried
out earlier.
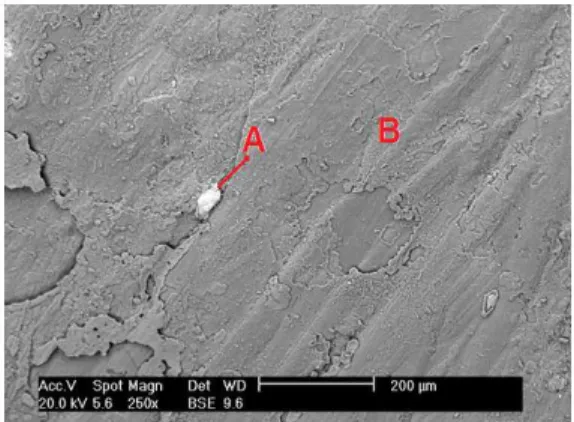
The spectra also present peaks of lead and tita-nium as contaminants in the EMD. This result indi-cates that Ti oxide is carried to the deposit during the electrolysis. In all samples, the presence of lead was greater than that of titanium. Lead contamina-tion in the EMD could occur when the deposit is removed. This can be seen in Figure 8, which shows the face of the deposited material that is in contact with the electrode. In this image, the white area (A) is predominantly composed of lead, and a dark area can be seen (B), which is predominantly composed of manganese.
Figure 6: Back-scattered electron image. Morphology of MnO2 electrodeposited on the lead
Figure 7: EDS spectra of the material deposited on the lead electrode at a current density of 2.51 A.dm-2.
Figure 8: Back–scattered electron image. Morphology of DME produced using 2.51 A.dm-2.
The industrial production of EMD involves the sulfuric acid leaching of manganese dioxide ores followed by the electrowinning of the solution, pro-ducing 92% purity manganese dioxide in the cath-odes. The process is basically the same studied in this paper to produce EMD.
The main difference is the material of the leach-ing process. In the industrial process a primary source is used and, in this approach, a secondary source material produces the same product. Conse-quently, the main purpose is to reduce the use of primary raw materials. As the process is essentially the same, e.g., the same reactants and the same proc-essing conditions in the electrowinning step, the overall cost of EMD production using batteries in-stead of manganese ores should be the same.
CONCLUSIONS
1. The best values of current efficiency (94.3% and 89.4%) and of specific surface area (150.9 m2.g-1 and 131.5 m2.g-1) were obtained by applying current densities from 1.02 A.dm-2 to 1.39 A.dm-2.
2. The EMD samples, obtained with current den-sity ranging from 0.61 A.dm-2 to 2.51 A.dm-2, pre-sented more than 90 wt.% of - MnO2.
3. The best results regarding the concentration of MnO2 (97.4%) were obtained in the samples
pro-duced with a current density of 1.93 A.dm-2.
4. Variation of the current density from 0.61 A.dm-2 to 2.51 A.dm-2 did not affect the structure of the EMD obtained. In all samples, there was a pre-dominance of -MnO2.
REFERENCES
Bernardes, A. M., Espinosa, D. C. R., Tenório, J. A. S., Recycling of batteries: A review of current processes and technologies. Journal of Power Sources, 130(1-2), 291-298 (2004).
Browning, J. G., Donne, W. S., Electrochemical ki-netic behaviour of the aqueous manganese diox-ide electrode. Journal of Applied Electrochemis-try, 35, 437-443 (2005).
Davis, S. M., Bowden, W. L., Richards, T. C., Defin-ing high power EMD through porosimetry. Jour-nal of Power Sources, 139, 342-350 (2005). Espinosa, D. C. R., Tenório, J. A. S., Recycling of
nickel-cadmium batteries using coal as reducing. Journal of Power Sources, 157, 600-604 (2006). Espinosa, D. C. R., Bernardes, A. M., Tenório, J. A.
S., An overview on the current processes for the recycling of batteries. Journal of Power Sources, 135(1-2), 311-319 (2004).
Espinosa, D. C. R., Tenório, J. A. S., Fundamental aspects of the recycling of nickel-cadmium bat-teries through vacuum distillation. Journal of Power Sources, 135(1-2), 320-326 (2004).
Ghaem, M., Binder, L., Effects of direct and pulse current on electrodeposition of manganese dioxide. Journal of Power Sources, 111, 248-254 (2002). Komaba, S., Sasaki, T., Kumagai, N., Preparation
and electrochemical performance of composite oxide of alpha manganese dioxide and Li–Mn–O spinel. Eletrochimica Acta, 50, 2297-2305 (2005). Li, J., Li, X., Hu, Q., Wang, Z., Zheng, J., Wu, L., Zhang, L., Study of extractionand purification of Ni, Co and Mn from spent battery material. Hydrometallurgy, 99, 7-12 (2009).
Provazi, K., Campos, B. A., Espinosa, D. C. R., Tenório, J. A. S., Metal separation from mixed types of batteries using selective precipitation and liquid liquid extraction techniques. Waste Mange-ment, 31, 59-64 (2011).
from spent alkaline and zinc–carbon batteries in acidic media. Hydrometallurgy, 97, 73-79 (2009). Strobel, P., Ibarra-Palos, A., Anne, M., Poinsignon, C.,
Crisci, A., Cation ordering in Li2Mn3MO8 spinels:
Structural and vibration spectroscopy studies. Solid State Sciences, 5, 1009-1018 (2003).
Vatistas, N., Bartolozzi, M., Arras, S., The disman-tling of the spent alkaline zinc manganese dioxide batteries and the recovery of the zinc from the an-odic material. Journal of Power Sources, 101,
182-187 (2001).
Tamura, H., Ishizeki, K., Nagayama, M., Furuichi, R., Incorporation of impurity metal ions in elec-trolytic manganese dioxide. Journal of Electro-chemistry Society, 8, 141-147 (1994).