Nanostructured Polyaniline/Titanium
Dioxide Composite Anode for Microbial
Fuel Cells
Yan Qiao,†,‡Shu-Juan Bao,†,‡Chang Ming Li,†,‡,* Xiao-Qiang Cui,†,‡Zhi-Song Lu,†,‡and Jun Guo§
†School of Chemical and Biomedical Engineering,‡Center for Advanced Bionanosystems, and§School of Materials Science and Engineering, Nanyang Technological University, 70 Nanyang Drive, Singapore 637457
M
icrobial fuel cells (MFCs) as one type of “green” energy source have attracted great interest among researchers. In MFCs, the use of en-tire microorganisms as microreactors elimi-nates the need for isolation of individual en-zymes and allows active biomaterials under conditions close to their natural environ-ment to convert organic compounds, from simple carbohydrates to waste organic mat-ter, into electricity at a high efficiency. Thus, the use of MFCs has great potential for broad applications, particularly in home electrical generators, electronic power sources for space shuttles, and self-feeding robots.1However, the low power density and poor long-term stability limit its practi-cal applications.2,3Although a number of factors can affect a MFC’s performance,3–5 the anode electrode associated with micro-bial inoculums has the greatest impact on its power density. In the past few years, some scientists have improved the MFC an-ode material by impregnating it with differ-ent chemical catalysts.6–8Optimization of the porous structure of the electrode with higher specific surface area increases the apparent power density, but it is observed that the pores are clogged by the entering bacteria, resulting in cell death and signifi-cant reduction of the electrochemical reac-tion surface.9Conventional carbon-based anodes, such as carbon felts and porous car-bon papers, suffer too from this very chal-lenging problem.9Polyaniline (PANI) is a popular conduct-ing polymer due to its simple synthesis pro-cess, good electrical conductivity, and envi-ronmental stability,10and it has been studied for use as a MFC anode through modifications. Recently, Schröderet al. em-ployed PANI to modify a platinum anode for MFC11and achieved a current density 1
or-der of magnitude higher than the previ-ously reported value. PANI/inorganic com-posites are also reported to have better conductivity.12,13Our previous work14has demonstrated that a favorable nanostruc-ture of a carbon nanotube/PANI composite anode improves the MFC performance, es-pecially the power density.
It is a great challenge to develop a new anode material to further increase the power density of a MFC. The nature of the catalytic mechanism of a MFC anode in-volves not only a bio- but also an electrocat-alytic process. An optimal nanostructure with high specific surface area favorable for both catalytic processes could play a criti-cal role in improving the MFC power den-sity; such a structure needs to host the bac-teria with high bioactivity while enhancing the electron-transfer rate. Mesoporous structured inorganic materials have a large specific surface area and uniform pore dis-tribution. Among these materials, TiO2is biocompatible, stable, and environmentally friendly,15and its electronic, optical, and di-electric properties can be enhanced by sur-face modifications16–19to allow it to be
*Address correspondence to [email protected].
Received for review July 16, 2007 and accepted November 29, 2007.
Published online December 14, 2007.
10.1021/nn700102s CCC: $40.75
© 2008 American Chemical Society
ABSTRACT A unique nanostructured polyaniline (PANI)/mesoporous TiO2composite was synthesized and explored as an anode inEscherichia colimicrobial fuel cells (MFCs). The results of X-ray diffraction, morphology,
and nitrogen adsorption– desorption studies demonstrate a networked nanostructure with uniform nanopore
distribution and high specific surface area of the composite. The composite MFC anode was fabricated and its
catalytic behavior investigated. Optimization of the anode shows that the composite with 30 wt % PANI gives the
best bio- and electrocatalytic performance. A possible mechanism to explain the excellent performance is
proposed. In comparison to previously reported work withE. coliMFCs, the composite anode delivers 2-fold higher
power density (1495 mW/m2). Thus, it has great potential to be used as the anode for a high-power MFC and
may also provide a new universal approach for improving different types of MFCs.
KEYWORDS:polyaniline · mesoporous titanium dioxide ·Escherichia coli· microbial fuel cells · electrocatalysis
ARTICLE
used for a MFC anode. However, TiO2has low electric conductivity that limits its use for high power output. We have recently synthesized a new mesoporous TiO2electrode material with uniform nanopore distribu-tion and high specific surface area.20In this work, we use this material to fabricate a unique nanostructured PANI/TiO2composite for the MFC anode. Both biocata-lytic and electrocatabiocata-lytic properties of the composite are optimized by tailoring the composition ratio. The optimal composite is employed in anEscherichia coli MFC, and the power density is examined. To the best of our knowledge, this new hybrid polymer/inorganic porous composite is for the first time fabricated and ap-plied to MFCs.
RESULTS AND DISCUSSION
Characterization of PANI/TiO2Composites.The phases of
both TiO2and the PANI/TiO2composite were
deter-mined by X-ray diffraction (XRD, Figure 1). Curve a dis-plays the characteristic patterns of TiO2, and the main peaks can be indexed to the anatase TiO2phase (JCPDS, card no. 21-1272). Curve f shows that the plain PANI has a certain degree of crystallinity. The broad peak can be ascribed to the scattering from polyaniline chains at interplanar spacing. The patterns of the four compos-ites indicate that PANI deposited on the surface of TiO2has no effect on the crystallization characteristics of TiO2. With increasing PANI percentage in the com-posite, the intensity of the broad peak of PANI is en-hanced. This may suggest that the crystalline behavior of PANI is not hampered by the restrictive effect of the surface of TiO2as reported in the literature.16However, the intensity of the characteristic peaks of TiO2is damp-ened by the increase in the thickness of the polymer layer.
The morphologies (Figure 2) of both TiO2and the PANI/TiO2composite were examined by field emission scanning electron microscopy (FESEM) and transmis-sion electron microscopy (TEM). Figure 2a demonstrates that TiO2agglomerates to form a loose nanostructure with uniform nanopore distribution. The SEM micro-graph with high magnification (inset of Figure 2a) clearly shows that the TiO2cluster consists of flakes that cross-link with each other to form a porous net-work. The composite structure (Figure 2b) is more com-pact than TiO2, and the graph with high magnification (inset of Figure 2b) reveals that the porous flake-cross-linked structure of the mesoporous TiO2is retained af-ter PANI modification. The TEM micrographs (Figure 2c,d) also illustrate the nanoflake structure for the com-posite, not significantly different from that of TiO2.
The results of specific surface area and average pore diameter are shown in Figure 3; the inset shows the N2 adsorption– desorption isotherm and the pore distribu-tion of the PANI/TiO2nanocomposite with 30 wt % PANI. The composite (Figure 3) has a high specific sur-face area above 150 m2/g, which is larger by 300 times
Figure 1. X-ray diffraction of (a) TiO2, (b) 10 wt % PANI/TiO2,
(c) 20 wt % PANI/TiO2, (d) 30 wt % PANI/TiO2, (e) 50 wt %
PANI/TiO2, and (f) PANI.
Figure 2. SEM (a,b) and TEM (c,d) micrographs of TiO2(a,c) and PANI/
TiO2composite (b,d) with 30 wt % PANI. The insets are the
high-magnification graphs.
Figure 3. Specific surface area and average pore diameter of PANI/TiO2nanocomposites. The insets are the N2
adsorp-tion– desorption isotherm (big) and BJH pore size distribu-tion (small) of the composites containing 30 wt % PANI.
ARTICLE
VOL. 2 NO. 1 QIAOET AL. www.acsnano.org
than that of woven graphite felt (about 0.5 m2/g),6,21a widely used anode material in MFCs. The specific sur-face area decreases with increasing PANI content in the composite. This could possibly be attributed to the lower specific surface area of PANI than TiO2, deposi-tion of which could reduce the specific surface area of the composite. The isotherm has a hysteretic loop, which is a characteristic of the adsorption– desorption of a porous material. The inset of Figure 3 also shows a narrow and uniform pore size distribution of the com-posite, with an average pore diameter over in the range of 6 – 8 nm, which is much smaller than the diameter of the bacteria (about 0.5–2m). Thus, the bacteria can-not enter into and clog the pores, causing their death from lack of nutrients9and reduction of the reaction surface area as well. The results obtained for TiO2and other composites with different percentages of PANI are similar to those shown in Figure 3 and are not pre-sented here.
Catalytic Behavior of PANI/TiO2
Composite Electrodes.The com-plex impedance (Z)vs fre-quency, known as a Nyquist plot, was measured with TiO2 and four composite electrodes in an anaerobic culture ofE. coli K-12 with 55 mM glucose and 5 mM 2-hydroxy-1,4-naphthoquinone (HNQ) (Fig-ure 4); the inset in Fig(Fig-ure 4 illus-trates the high-frequency part of the result. The Nyquist plots of all four composite electrodes represent well-defined frequency-dependent semi-circle impedance curves over high frequencies followed by straight lines, but the TiO2
elec-trode has no defined semicircle. A Randle equivalent cir-cuit21is often used to model the complex impedance in an electrochemical cell, in which the charge-transfer resistance (Rct) at the electrode/electrolyte interface is equal to the diameter of the semicircle. SmallerRct indi-cates a faster electron-transfer rate. The result in Fig-ure 4 indicates thatRctis remarkably reduced after PANI deposits on TiO2and is further decreased with increas-ing PANI content in the composite electrode. However, after 20 wt % PANI is deposited on TiO2, further increas-ing the PANI content has no significant effect on reduc-ingRct. The results here reveal that TiO2has no electro-catalysis on glucose oxidation, and its catalytic performance can be significantly improved by PANI deposition on its surface. This can possibly be ascribed to the fact that addition of PANI forms a nanostructured network (Figure 2), which could enhance the electron-transfer rate. At low frequencies, the inclined line with a slope higher than 45° and close to 90° demonstrates a capacitive-like behavior, characteristic of a porous con-ducting film.22–24
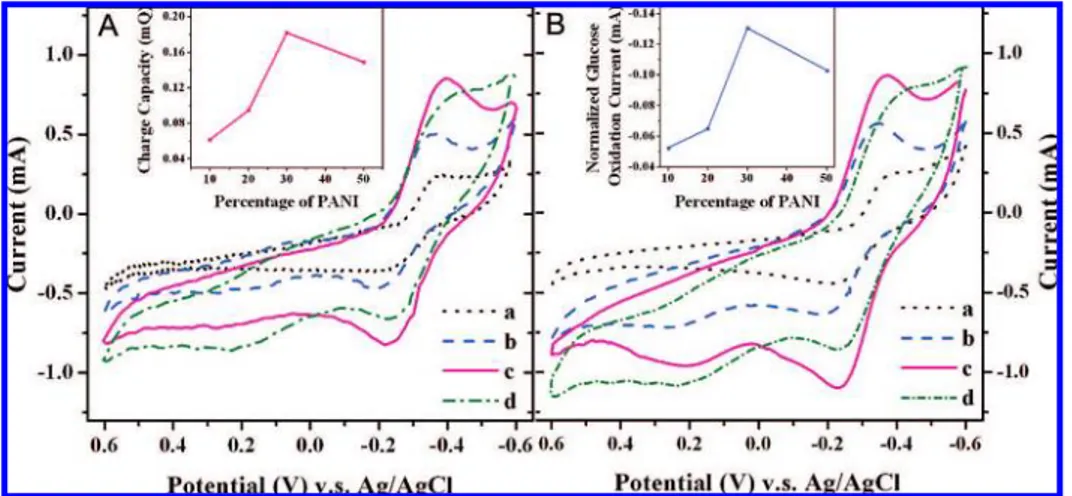
The cyclic voltammograms (CVs) shown in Figure 5A were measured in 0.1 M phosphate buffer⬎ ⫹E. colicells⫹5 mM HNQ, and they all have a pair of well-defined redox waves, obviously due to redox reaction of HNQ. The charge capacities calculated from the CVs (inset of Figure 5A) show that the charge capacity in-creases with increasing PANI content in the compos-ites up to 30 wt %, at which the maximum value is reached and then decreases with further increase of PANI content. Because the charge capacity of an elec-trode for a specific reaction is known to be proportional to the electrode surface, this result indicates that the re-action surface area increases with increasing PANI con-tent until reaching its maximum and then decreases with further increase of PANI content. The CVs in Fig-ure 5B were measFig-ured in 0.1 M phosphate buffer⫹E. colicells⫹5 mM HNQ⫹55 mM glucose, and the
cur-Figure 5. Cyclic voltammograms of different PANI/TiO2composite electrodes in an anaerobic
suspen-sion ofE. coliK-12 containing 5 mM HNQ without glucose (A) and with 55 mM glucose (B): (a) 10 wt % PANI/TiO2; (b) 20 wt % PANI/TiO2; (c) 30 wt % PANI/TiO2; and (d) 50 wt % PANI/TiO2. Scan rate, 5 mV/s.
The inset of panel A displays the charge capacity of the different electrodes. The inset of panel B repre-sents the baseline-subtracted peak current of glucose oxidation.
Figure 4. Nyquist plots on different electrodes in an anaero-bic culture ofE. coliK-12 containing 55 mM glucose, 0.5 mM HNQ, and 0.1 M phosphate buffer (pH 7.0).
ARTICLE
rent axis has the same scale as that in Figure 5A for comparison. Similarly to panel A, panel B also exhibits a pair of well-defined redox waves. However, panel B has significant differences in comparison to panel A; for instance, the anodic peak current is much larger than its cathodic one. In addition, for the electrodes with same percentage of PANI, the anodic peak current in panel B is much larger than that in panel A, although their cathodic peak currents are almost identical. Appar-ently, the larger anodic current is due to the glucose oxidation. After subtracting the background produced by HNQ, only the anodic waves can be observed (not shown in Figure 5), revealing that the glucose oxidation on theE. coli⫺PANI/TiO2electrode is a totally irrevers-ible electrochemical reaction. This is in agreement with our reported works.25,26The redox potential range of the glucose oxidation, from⫺0.4 to⫺0.2 V (Figure 5B), is as same as that of HNQ (Figure 5A), indicating that HNQ is an electron-transfer mediator between the non-conductiveE. colicells and the electrode.27,28The inset in Figure 5B clearly shows that the relationship of an-odic peak current of the glucose oxidationvsPANI per-centage in the composites has the same trend as the re-lation of charge capacityvsPANI percentage (inset in Figure 5A). The highest peak current, for glucose oxida-tion with 30% PANI composite electrode, indicates the best bio- and electrocatalysis of the glucose oxidation.
The peak current of a totally irreversible electro-chemical reaction in CV is proportional to the elec-trode surface (A), bulk reactant concentration (C0), and reactant diffusion coefficient (D0).
21In Figure 5,C 0and D0can be considered roughly constant. As discussed above, the effective reaction surface of the electrode is proportional to its charge capacity. That is why the rela-tionship of the peak current of glucose oxidationvs PANI percentage in the composites has the same change trend as that of the charge capacityvsthe PANI percentage (insets in Figure 5A,B). However, both charge capacity (Figure 5A) and peak current (Figure 5B) do not simply increase with increasing PANI con-tent in the composite. It is known that a porous elec-trode has a high internal surface area and, therefore, gives high electrochemical rates per apparent unit sur-face area of electrode, but the internal area cannot, in general, be completely utilized at high current densities due to the internal effect from mass transfer and ohmic polarization in an electrolyte that is simply dependent on the pore structure.29On the basis of the porous elec-trode theory, it is possible to explain why there is an op-timal PANI percentage in the composite for the best bio- and electrocatalytic behavior. Figure 3 illustrates that the average pore size of the electrodes remains constant with increasing PANI content in the compos-ite up to 30% but then decreases with further PANI in-creases. This may suggest that the pore structure and the utility of the electrodes are mainly determined by the TiO2microstructure after the PANI deposits up to 30
wt % of the composite. In fact, FESEM and TEM results (Figure 2) show that the fundamental nanoflake pore structure of TiO2is not changed significantly after modi-fication with PANI, and thus the electrode surface area can increase with increasing PANI deposit. However, when the PANI content is more than 30%, the average pore size decreases, and the internal effect could be-come the controlling factor in decreasing the electrode utility caused by reduced mass transport and higher IR polarization in the electrolyte, which suppresses the electrocatalytic current.
In order to explore the discharge profile of different composite anodes, an anolimiting MFC was de-signed, in which the Pt cathode had much larger sur-face area than that of the anode and thus the cathode polarization is insignificant. The volume of the MFC was 25 mL, and the concentration ofE. colicells was about 1⫻109cells mL⫺1, while the concentrations of HNQ and glucose were as same as those in the experiments described above. The constant current discharge ex-periments using the MFC with the four different an-odes were conducted at 0.1 mA/cm2, resulting in a change of the anode potential (vsAg/AgCl)vsthe dis-charge time as shown in Figure 6. For an anodic reac-tion, the more negative the anode discharge potential, the better the electrocatalysis. Apparently, the compos-ite anode with 30 wt % PANI gives much more nega-tive potential (⫺0.5 VvsAg/AgCl) during the discharge, demonstrating that it has the best electrocatalytic per-formance among the tested composites, which is in agreement with the CV results shown in Figure 5. As we discussed above, the greatest electrocatalytic be-havior of theE. coli⫺30 wt % PANI/TiO2electrode could be ascribed to optimal pore structure for good mass transfer and low IR drops in the inner pores. Figure 6 also illustrates that the discharge profile of the compos-ite/bacteria anode is totally different from that of a con-ventional anode: the bacteria anode has a high polar-ization potential initially that gradually becomes lower with increasing discharge time and finally becomes
Figure 6. Potentialⴚtime curve of anode-limiting MFCs uti-lizing different PANI/TiO2composites as anodes.
ARTICLE
VOL. 2 NO. 1 QIAOET AL. www.acsnano.org
constant at its lowest polarization potential. This is pos-sibly due to the bacteria growth process. In our experi-ments, the discharge process started immediately after addition of glucose solution and bacteria, which need time to grow to their maximum metabolic level and to distribute into the inner surface of the anode for the best performance. In addition, Figure 6 also shows a prominent feature of the 30 wt % PANI/TiO2 compos-ite: its catalytic effect, after reaching its maximum, is much more significantly improved than that of the other composite electrodes relative to their initial elec-troactivity, possibly indicating that it offers the best nanostructure environment for bacteria growth, which will be discussed more in the next section.
Bacteria Behaviors on PANI/TiO2Composite Surface.After
dis-charge, the surface morphology of the PANI/TiO2 com-posite anode was immediately examined with FESEM (Figure 7). It is seen that theE. colicells on the electrode surface produce some hairlike structures, which are re-ported as pili to allow bacteria to attach to other cells and to play a key role in mediation of the bacteria movement and biofilm formation.30,31Obviously, the pili could also promote cell adhesion on the composite surface, the host substrate. Figure 7a shows that lots ofE. colicells accumulate on the electrode surface and adhere to one another by pili. The graphs with high magnification (Figure 7b,c) clearly illustrate that the ex-tended pili attach the cells on the electrode surface and cross-link each other to form a network. This phe-nomenon is not found on free-floating cells in the elec-trolyte (Figure 7d). One possible reason is that the rough surface of the electrode could stimulate the cell to produce the pili and then to firmly attach the cells onto the electrode surface for a superior biofilm by pili cross-linking,32in which the bacteria can have a sound environment for extracellular electron transfer during the electrochemical reaction.33,34It is reported that the pili of some metal-reducing bacteria are highly conduc-tive and thus can directly transfer electrons to elec-trodes like a cable.35,36Possibly, the pili ofE. colicells on the composite electrode surface could also facilitate electron transfer between the cells and electrode, which could even play a key role in mediatorlessE. coli MFCs37,38and currently is under investigation in the au-thor’s laboratory. Figure 7c shows a superiorE. colipili network, indicating that the nanostructured PANI/TiO2 composite electrode is an excellent host for cell growth.
Performance of the PANI/TiO2Anode in a MFC.The
perfor-mance of the PANI/TiO2anode was tested in a dual-chamber MFC system that was constructed from two glass bottles (450 mL capacity) joined by a glass tube in-stalled with a 1.5-cm-diameter proton exchange mem-brane (PEM, Nafion 117, Dupont, Wilmington, DE). The anode (1.5 cm⫻1.5 cm) was made of 30 wt % PANI/ TiO2composite (the best performer as discussed above), the compartment of which contained an anaer-obic growing suspension ofE. coliK-12 cells inoculated
in a medium just before the test. The cathode was as-received carbon cloth (E-TEK, B1D), and the catholyte was a 50 mM ferricyanide solution with phosphate buffer identical to that in the bacterial medium. Cur-rent and potential measurements on the MFC were car-ried out by using a benchtop digital multimeter (ES-CORT 3146A) during discharge in constant-load mode with an external resistance of 1.95 k⍀, and the result is shown in Figure 8. It is noted that, after bacteria enrich-ment for about 48 h, the power density rises to a pla-teau and remains there for about 450 h without addi-tion of glucose or other nutriaddi-tion. After 500 h from inoculation, the power density drops sharply as glu-cose is depleted in the anodic compartment. The dis-charge duration is much longer than those of the previ-ously reportedE. coliMFCs under the same
conditions.38–40This remarkable improvement
indi-Figure 7. SEM micrographs ofE. colicells adhered on a 30 wt % PANI/ TiO2electrode surface (aⴚc) and free-floating cells (d).
Figure 8. Constant-load discharge curves of MFC with 30 wt % PANI/TiO2composite anode.
ARTICLE
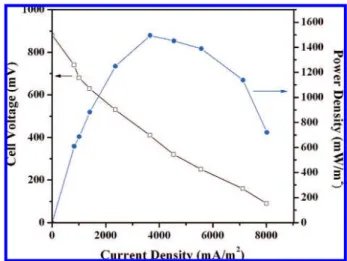
cates high energy conversion efficiency, likely resulting from theE. colibiofilm formed on the electrode surface, as discussed above. To determine the power output, various resistances (10 –5000⍀) were used as external loads, and the polarization curve and the power output of the MFC (Figure 9) show that the open-circuit poten-tial is 880 mV and the maximum power output is 1495 mW/m2, corresponding to a current density of 3650 mA/m2at a cell potential of 410 mV. As the maximal power density ofE. coli-catalyzed MFCs38reported to date is 760 mW/m2, the PANI/TiO2nanocomposite
an-ode in our work significantly improves the power den-sity by almost 2-fold. This new composite anode also has greater power density than the CNT/PANI compos-ite we have previously reported.14The results demon-strate that the nanoporous PANI/TiO2composite with optimal PANI content (30 wt %) can be a superior an-ode material in a MFC, giving a high power output.
CONCLUSIONS
We present here a unique nanostructured PANI/ TiO2composite with large specific surface area, uni-form nanopore distribution, and good biocatalytic per-formance. The catalytic performance of the composite anode in microbial fuel cells can be optimized by ad-justing the PANI percentage in the composite, and the composite with 30 wt % PANI gives the highest bio- and electrocatalytic performance. In comparison to the re-ported works, the composite anode delivers 2-fold higher power output (1495 mW/m2) in anE. coliMFC and thus has great potential to be used as an anode for a high-power MFC. This work may also provide a new universal approach for improving other MFCs. The ap-plication of this material in mediatorless MFCs is under investigation in the author’s laboratory. Although direct electron transfer between the nanocomposite andE. colihas been observed, its mechanism is not very clear and is further explored with both electrochemical and biological experimental approaches, which will be pre-sented in another report.
METHODS
Synthesis of PANI/TiO2Composite.The mesoporous structured
TiO2was synthesized by a sol– gel-assisted hydrothermal method as in our previous work.20After the TiO
2was obtained, different volumes of aniline were injected into 50 mL of an aque-ous TiO2dispersion with 1 M hydrochloric acid under ultrasonic operation to reduce agglomeration. Ammonium peroxydisulfate (APS) solution with a mole ratio of 1:1.25 monomer:APS was added dropwise into the mixture with constant stirring at 0 –5 °C. After 12 h of reaction, the precipitate was harvested by filtra-tion and rinsed several times with deionized water and metha-nol. Finally, the precipitate was vacuum-dried at 60 °C for 24 h, and PANI/TiO2composites were obtained.
Characterization of PANI/TiO2Composite.The crystal structure of
the product was characterized by XRD (Bruker AXS X-ray diffrac-tometer). The morphology was studied with FESEM (JSM-6700, JEOL, Japan) and high-resolution transmission electron micros-copy (JEM-2100F, JEOL, Japan). Nitrogen adsorption– desorption experiments were carried out at 77.3 K by using an automated gas sorption system (AUTOSORB-1, Quantachrome Instruments, Boynton Beach, FL). The surface area and pore size distribution were calculated using the Brunauer–Emmett–Teller (BET) equa-tion and Barrett–Joyner–Halenda (BJH) methods, respectively.
Electrode Preparation.The composite powder was mixed with poly(tetrafluoroethylene) solution (1 wt %) to prepare a paste. The paste was then coated on the surface of a nickel foam sheet (1 cm⫻1 cm⫻0.1 cm) to produce uniform films, followed by pressing with a presser to fabricate the PANI/TiO2electrode. The film covered the whole surface of the foam sheet to prevent ex-posure of nickel to the electrolyte. After drying at 120 °C to re-move water, the electrodes were used as the anodes for MFCs.
Bacteria Culture.E. coliK-12 (ATCC 29181) was grown anaerobi-cally at 37 °C in a standard glucose medium, which was a
mix-ture contained 10 g of glucose, 5 g of yeast extract, 10 g of NaH-CO3, and 8.5 g of NaH2PO4per liter. After growing for 12 h, the bacteria culture in stationary phase was harvested by centrifuga-tion at 4 °C (6000g, 5 min). The produced bacteria were washed three times and then suspended in a 0.1 M anaerobic phosphate buffer (pH 7.0) containing 55 mM glucose. The concentration of
E. colicells was about 109cells mL⫺1. Before each test, the sus-pension was purged over nitrogen for 20 min to remove oxygen from the solution.
Electrochemical Measurements.All electrochemical experiments were carried out with a PGSTAT30 Autolab system (Ecochemie, Utrecht, Netherlands) in a three-electrode cell that consisted of a working electrode, a Ag/AgCl (saturated KCl) reference elec-trode, and a platinum foil counter electrode. HNQ was chosen as the electron mediator because it can generate higher Coulom-bic output than commonly used mediators, such as resazurin or thionine.41Electrochemical impedance spectra measurements were performed over a frequency range of 0.5 Hz to 100 kHz at ⫺0.2 V, with a perturbation signal of 10 mV.
Acknowledgment.The authors are grateful to the Asian fice of Aerospace Research and Development, U.S. Air Force Of-fice of Scientific Research, for the financial support to this work under contract no. AOARD-05-4073.
REFERENCES AND NOTES
1. Lovley, D. R. Bug juice: Harvesting Electricity with Microorganisms.Nat. Rev. Microbiol.2006,4, 497–508. 2. Holzman, D. C. Microbe Power!Environ. Health Perspect.
2005,113, A754–A757.
3. Bullen, R. A.; Arnot, T. C.; Lakeman, J. B.; Walsh, F. C. Biofuel Cells and Their Development.Biosens. Bioelectron.2006,
21, 2015–2045. Figure 9. Power output and polarization curve of MFC with 30 wt %
PANI/TiO2composite anode.
ARTICLE
VOL. 2 NO. 1 QIAOET AL. www.acsnano.org
4. Logan, B. E.; Hamelers, B.; Rozendal, R.; Schrorder, U.; Keller, J.; Freguia, S.; Aelterman, P.; Verstraete, W.; Rabaey, K. Microbial Fuel Cells: Methodology and Technology.
Environ. Sci. Technol.2006,40, 5181–5192.
5. Logan, B. E.; Regan, J. M. Electricity-Producing Bacterial Communities in Microbial Fuel Cells.Trends Microbiol.
2006,14, 512–518.
6. Park, D. H.; Zeikus, J. G. Improved fuel cell and electrode designs for producing electricity from microbial degradation.Biotechnol. Bioeng.2003,81, 348–355. 7. Lowy, D. A.; Tender, L. M.; Zeikus, J. G.; Park, D. H.; Lovley,
D. R. Harvesting Energy from the Marine Sediment-Water Interface IIOKinetic Activity of Anode Materials.Biosens.
Bioelectron.2006,21, 2058–2063.
8. Rosenbaum, M.; Zhao, F.; Schroder, U.; Scholz, F. Interfacing Electrocatalysis and Biocatalysis with Tungsten Carbide: A High-Performance, Noble-Metal-Free Microbial Fuel Cell.Angew. Chem., Int. Ed.2006,45, 6658–6661. 9. Rabaey, K.; Verstraete, W. Microbial Fuel Cells: Novel
Biotechnology for Energy Generation.Trends Biotechnol.
2005,23, 291–298.
10. Syed, A. A.; Dinesan, M. K. PolyanilineOa Novel Polymeric MaterialOReview.Talanta1991,38, 815–837.
11. Schröder, U.; Nieben, J.; Scholz, F. A Generation of Microbial Fuel Cells with Current Outputs Boosted by More Than One Order of Magnitude.Angew. Chem., Int. Ed.
2003,115, 2986–2989.
12. Huguenin, F.; Torresi, R. M.; Buttry, D. A. Lithium Electroinsertion into an Inorganic⫺Organic Hybrid Material Composed from V2O5and Polyaniline.J.
Electrochem. Soc.2002,149, A546–A553. 13. Jang, S. H.; Han, M. G.; Im, S. S. Preparation and
Characterization of Conductive Polyaniline/Silica Hybrid Composites Prepared by Sol-gel Process.Synth. Met.2000,
110, 17–23.
14. Qiao, Y.; Li, C. M.; Bao, S. J.; Bao, Q. L. Carbon
Nanotube/Polyaniline Composite as Anode Material for Microbial Fuel Cells.J. Power Sources2007,170, 79–84. 15. Zhou, H.; Liu, L.; Yin, K.; Liu, S. L.; Li, G. X. Electrochemical
Investigation on the Catalytic Ability of Tyrosinase with the Effect of Nano Titanium Dioxide.Electrochem. Commun.2006,8, 1168–1172.
16. Li, X. W.; Wang, G. C.; Li, X. X.; Lu, D. M. Surface Properties of Polyaniline/Nano-TiO2Composites.Appl. Surf. Sci.2004,
229, 395–401.
17. Vu, Q. T.; Pavlik, M.; Hebestreit, N.; Rammelt, U.; Plieth, W.; Pfleger, J. Nanocomposites Based on Titanium Dioxide and Polythiophene: Structure and Properties.React. Funct. Polym.2005,65, 69–77.
18. Xu, J. C.; Liu, W. M.; Li, H. L. Titanium Dioxide Doped Polyaniline.Mater. Sci. Eng., C2005,25, 444–447. 19. Dey, A.; De, S.; De, A.; De, S. K. Characterization and
Dielectric Properties of Polyaniline-TiO2Nanocomposites.
Nanotechnology2004,15, 1277–1283.
20. Bao, S.-J.; Z., J.-F.; Li, C. M.; Cui, X.-Q.; Qiao, Y.;Guo, J. Novel Nanoporous TiO2Electrode for Directly Electrochemistry of glucose oxidase.Adv. Funct. Mater.2007, in press, http://dx.doi.org/10.1002/adfm.200700728. 21. Bard, A. J.; Faulkner, L. R.Electrochemical
MethodsOFundamentals and Applications, 2nd ed.; John Wiley & Sons, Inc: New York, 2001; pp 228–242. 22. Song, H. K.; Sung, J. H.; Jung, Y. H.; Lee, K. H.; Dao, L. H.;
Kim, M. H.; Kim, H. N. Electrochemical Porosimetry.J. Electrochem. Soc.2004,151, E102–E109.
23. Elliott, J. M.; Owen, J. R. Electrochemical Impedance Characterisation of a Nanostructured (Mesoporous) Platinum Film.Phys. Chem. Chem. Phys.2000,2, 5653–5659.
24. Ghosh, P.; Sarkar, A.; Meikap, A. K.; Chattopadhyay, S. K.; Chatterjee, S. K.; Ghosh, M. Electron Transport Properties of Cobalt Doped Polyaniline.J. Phys. D2006,39, 3047–3052.
25. Li, C. M.; Cha, C. S. Porous carbon composite/enzyme glucose microsensor.Front. Biosci.2004,9, 3324–3330.
26. Zang, J. F.; Li, C. M.; Cui, X. Q.; Wang, J. X.; Sun, X. W.; Dong, H.; Sun, C. Q. Tailoring zinc oxide nanowires for high performance amperometric glucose sensor.Electroanalysis
2007,19, 1008–1014.
27. Roller, S. D.; Bennetto, H. P.; Delaney, G. M.; Mason, J. R.; Stirling, J. L.; Thurston, C. F. Electron-Transfer Coupling in Microbial Fuel-Cells. 1. Comparison of Redox-Mediator Reduction Rates and Respiratory Rates of Bacteria.J. Chem. Technol. Biotechnol. B1984,34, 3–12.
28. Lithgow, A. M.; Romero, L.; Sanchez, I. C.; Souto, F. A.; Vega, C. A. Interception of the Electron-Transport Chain in Bacteria with Hydrophilic Redox Mediators. 1. Selective Improvement of the Performance of Biofuel Cells with 2,6-Disulfonated Thionine as Mediator.J. Chem. Res.-S1986,
5, 178–179.
29. Austin, L. G.Fuel Cells: A Review of Government-Sponsered Research 1950 –1964; NASA SP-120; National Aeronautics and Space Administration: Washington, DC, 1967; pp303– 320.
30. Pratt, L. A.; Kolter, R. Genetic Analysis ofEscherichia coli
Biofilm Formation: Roles of Flagella, Motility, Chemotaxis and Type I Pili.Mol. Microbiol.1998,30, 285–293. 31. Wall, D.; Kaiser, D. Type IV Pili and Cell Motility.Mol.
Microbiol.1999,32, 1–10.
32. Biffinger, J. C.; Pietron, J.; Ray, R.; Little, B.; Ringeisen, B. R. A Biofilm enhanced miniature microbial fuel cell using Shewanella oneidensis DSP10 and oxygen reduction cathodes.Biosens. Bioelectron.2007,22, 1672–1679. 33. Hernandez, M. E.; Newman, D. K. Extracellular electron
transfer.Cell. Mol. Life Sci.2001,58, 1562–1571. 34. Reguera, G.; Nevin, K. P.; Nicoll, J. S.; Covalla, S. F.;
Woodard, T. L.; Lovley, D. R. Biofilm and nanowire production leads to increased current in Geobacter sulfurreducens fuel cells.Appl. Environ. Microbiol.2006,72, 7345–7348.
35. Reguera, G.; McCarthy, K. D.; Mehta, T.; Nicoll, J. S.; Tuominen, M. T.; Lovley, D. R. Extracellular Electron Transfer via Microbial Nanowires.Nature2005,435, 1098– 1101.
36. Gorby, Y. A.; Yanina, S.; McLean, J. S.; Rosso, K. M.; Moyles, D.; Dohnalkova, A.; Beveridge, T. J.; Chang, I. S.; Kim, B. H.; Kim, K. S.; et al. Electrically Conductive Bacterial Nanowires Produced byShewanella oneidensisstrain MR-1 and other Microorganisms.Proc. Natl. Acad. Sci. U.S.A.2006,103, 11358–11363.
37. Zhang, T.; Cui, C.; Chen, S.; Ai, X.; Yang, H.; Shen, P.; Peng, Z. A novel mediatorless microbial fuel cell based on biocatalysis of Escherichia coli.Chem. Commun.2006,21, 2257–2259.
38. Zhang, T.; Zeng, Y.; Chen, S.; Ai, X.; Yang, H. Improved Performances ofE. coli-Catalyzed Microbial Fuel Cells with Composite Graphite/PTFE Anodes.Electrochem. Commun.
2007,9, 349–353.
39. Park, D. H.; Zeikus, J. G. Electricity Generation in Microbial Fuel Cells Using Neutral Red as an Electronophore.Appl. Envirom. Microbiol.2000,66, 1292–1297.
40. Ieropoulos, I. A.; Greenman, J.; Melhuish, C.; Hart, J. Comparative Study of Three Types of Microbial Fuel Cell.
Enzyme Microb. Technol.2005,37, 238–245. 41. Lee, S. A.; Choi, Y.; Jung, S. H.; Kim, S. Effect of Initial
Carbon Sources on the Electrochemical Detection of Glucose byGluconobacter oxydans.Bioelectrochemistry
2002,57, 173–178.