*e-mail: [email protected]
Received: 30 June 2014 / Accepted: 08 October 2014
Robust evaluation of time since awakening using force platform
posturography
Quang-Cuong Pham, Marco Túlio de Mello, Fernanda Veruska Narciso, Marcos Mônico Neto, Cristiane Westin Teixeira, Leandro Stetner Antonietti, Silvério Aparecido Garbuio, Sílvio de Araújo Fernandes Júnior, Renata Guedes Koyama,Marcos Duarte*, Sérgio Tui k
Abstract Introduction: Sleepiness is responsible for a considerable proportion of trafi c accidents. It is thus an important trafi c safety issue to i nd a robust, objective and practical way to estimate the amount of time a person has been awake. To attempt to meet this goal, we investigated the relationship between sleepiness and posture control. Methods: Subjects were kept awake for 36 hours and posturographic data during quiet standing were collected every two hours by means of a force platform. The standing surface (rigid surface or foam surface) and visual (eyes open or eyes closed) conditions were manipulated. Results: In the more challenging conditions (with foam surface and/or eyes closed), the body sway variables derived from the center of the pressure measurement increased signii cantly when time since awakening became greater than 21 h in almost all subjects. Conclusion:
Based on this result, we propose a practical protocol that could robustly assess whether time since awakening was greater than 21 h.
Keywords Sleepiness, Time since awakening, Posturography, Postural control.
Introduction
Sleepiness and fatigue are responsible for a considerable
proportion of trafi c accidents (Pinho et al., 2006; Noce et al., 2008; Williamson et al., 2014), particularly in truck and inter-city bus drivers, who must drive for long periods of time. It is thus an important trafi c safety issue to i nd a robust, objective (as
opposed to subjective reports such as the Stanford
Sleepiness Scale) (Hoddes et al., 1973) and practical way to estimate the amount of time a person has been awake (time since awakening or TA). Posturography is an interesting candidate (Hæggström et al., 2006; Morad et al., 2007; Forsman et al., 2010; Smith et al., 2012; Tietavainen et al., 2013) because it yields
objective measures and can be performed by means of cheap and easily transportable devices such as force platforms. Basically, posturography is the
measurement of human posture (Winter, 1995).
When a human subject is asked to stand as still as possible, he actually exhibits small, involuntary,
movements called postural sway (Winter, 1995; Duarte and Zatsiorsky, 2000). This sway can be quantii ed from the trajectories of the Center of Pressure (COP), which is typically recorded by force platforms (Winter, 1995), or alternatively quantii ed from body acceleration (Mancini et al., 2012). Other
possible methods for detecting fatigue related to sleepiness include using electroencephalography and
electrooculography (Hirvonen et al., 2010; Liu et al., 2013; Hallvig et al., 2014).
It can be hypothesized that the amount of sway is related to fatigue, which in turn is related to sleepiness and TA. However, simple measurements of the amount of sway, such as the standard deviation, area, and
velocity of COP trajectories during conventional
normal upright standing, are not always signii cantly correlated with TA and novel measurements, such
as fractal dimension and critical time from a stabilogram diffusion plot, have been proposed
because they achieved a higher correlation with TA (Hæggström et al., 2006; Morad et al., 2007; Smith et al., 2012; Tietavainen et al., 2013).
We believe that standing still in normal conditions is too simple a task to reveal any clear effect of TA
on the amount of sway. We therefore designed an experiment where the subjects had to stand still in
more challenging conditions, namely, on a foam
surface and/or without visual feedback. Indeed, it has been shown that together or separately, these experimental conditions signii cantly increase the difi culty of the task (Woollacott and Shumway-Cook, 2002), and more specii cally, that standing with
closed eyes enhances the sleepiness evaluation by
closed), the effect of TA on the amount of sway will
be clearly observable. Based on the experimental
results, we proposed a protocol to evaluate TA from
posturographic data. We statistically validated this protocol on a subject-by-subject basis and argue that it can be rapidly developed for real-life application.
Methods
Subjects, material, protocol
Fourteen male subjects participated in this experiment,
which conformed to the Declaration of Helsinki. This work was approved by our local ethical committee (number 0268/09), and it was carried out with the understanding and written consent of each subject. The subjects were healthy and reported neither sleep disorders (assessed by polysomnography) nor postural deicits; their ages, heights and weights were 23±4 years, 1.79±0.07 m and 73±14 kg, respectively.
The subjects slept at the laboratory (from 11 p.m.) the night before the experiment started. They were awakened at 7 a.m. and then kept awake and monitored for 36 consecutive hours. Posturographic data were collected by means of a force platform (AMTI, USA) with a sampling frequency of 100 Hz. Data collection was performed every two hours, from TA = 2 h to TA = 36 h, resulting in 18 data collection times.
Each data collection consisted of 8 trials per subject,
yielding 18 × 8 = 144 trials in total for each subject. In each trial, the subject was instructed to stand
on the force platform in a fully erect position and to stay as still as possible for 40 seconds. We tested
two standing surface conditions and two visual
conditions: Rigid Surface (R) and Foam Surface (F), Eyes Open (O) and Eyes Closed (C). This procedure
resulted in four experimental conditions: RO, RC, FO and FC. Condition RO is the “normal” or “control” condition that has been tested in previous studies
(Hæggström et al., 2006; Morad et al., 2007). The 8 trials of each data collection time point were performed in the following order: two RO trials, two RC trials, two FO trials and two FC trials.
In the Eyes Open trials, the subject had to ixate his gaze on a cross drawn on the wall ∼ 2 m in front of him
at eye-level. In the Foam Surface trials, viscoelastic foam (Ball Dynamics, USA; model: AIREX Balance Pad, USA; dimension: 41×49×6 cm3) was placed on
the force platform and the subject was asked to stand
on top of the foam.
Data processing and statistics
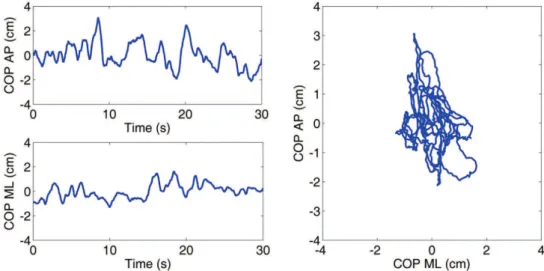
Matlab 7.8 software (MathWorks, USA) was used for processing the data. The COP time series were irst iltered using a fourth-order zero-lag low-pass Butterworth ilter with cut-off frequency of 10 Hz. The irst and last ive seconds of each trial were then removed, resulting in a 30 s time series (see igure 1 for an example of the COP trajectories).
Several simple variables, which are directly related to the amount of sway, were considered. However, because they yielded similar results, we showed only
results corresponding to the variable AREA, the area of the ellipse computed by Principal Component
Analysis such that there is a 95% probability that a new observation will lie inside the ellipse (Oliveira et al., 1996). In addition, for direct comparison with previous indings reported by Hæggström et al. (2006), we
Figure 1. Example of the COP trajectories in the anterior-posterior (AP) and medio-lateral (ML) directions of one subject in the eyes open
calculated the same novel variables used by them:
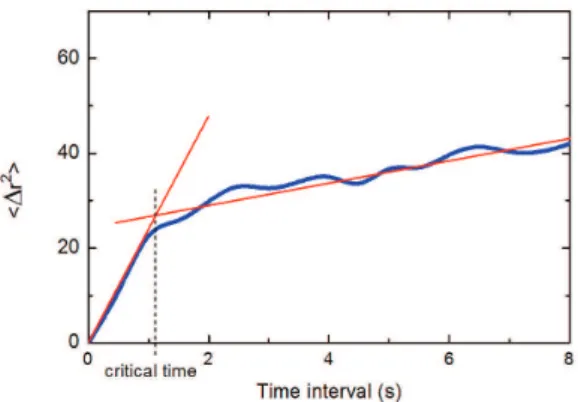
Critical Time (CT), which they called “time interval of open-loop control”; and Fractal Dimension (FD). The critical time variable is deined as the time interval where there is a general change in the trend of the stabilogram diffusion plot as illustrated in Figure 2. In
general, the fractal dimension variable is a statistical measure of the complexity in the data and, using the
deinition employed by Hæggström et al. (2006), it will be calculated as the slope of a straight line itted to the irst region (up to the critical time) in the stabilogram diffusion plot in a log-log scale. In comparison to the
original proposition of the stabilogram diffusion plot
applied to the COP analysis (Collins and De Luca, 1993), this calculation corresponds to two times the Hurst exponent in that region.
To statistically assess whether TA has an effect on these variables, we separated the data collection points into two bins: the “early” bin with TA < 21 h (comprising 10 data collection points, from 2 h to 20 h) and the “late” bin with TA > 21 h (comprising 8 data collection points, from 22 h to 36 h). Several
prior studies on driving performance and surveys
of trafic accidents reported critical thresholds as a result of extended wakefulness of approximately 19-20 h (Dawson and Reid, 1997; Howard et al., 2007; Noce et al., 2008). Normality and homogeneity of variances of the variables were veriied using the
Shapiro-Wilk test and the Levene statistic, respectively,
and two-way ANOVA tests (the irst factor was the subject with 14 levels, one level per subject; the second factor was the TA, with 2 levels: “early” and “late”) were then applied to the values of each variable. The level of signiicance of the tests was set at p = 0.01. The eta-squared (h2) effect size of each variable was
also quantiied.
Note that contrary to Hæggström et al. (2006), we did not apply any deconvolution to our data to
remove circadian rhythm to avoid the necessity of measuring the circadian rhythm for each subject.
However because the sizes of the bins were large, any signiicant global trends of the variables would
still be detected.
Results
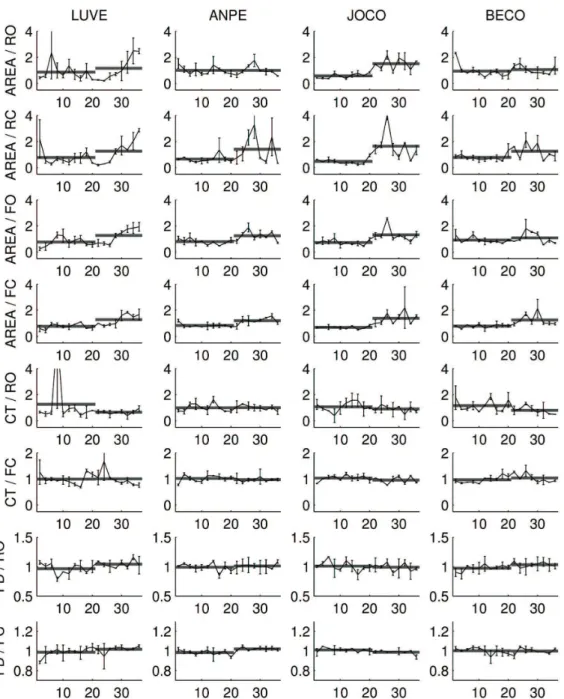
The values of several variables were plotted for four typical subjects in Figure 3. Intuitively, a variable will yield clear discrimination between the “early” and “late” bins of trials if (i) the variability within each bin (intra-bin variabilities) is low and (ii) the difference of the average values of the two bins (inter-bin difference) is high. One can observe graphically that in condition RO, requirement (i) – cf. subject LUVE – and requirement (ii) – cf. subject ANPE – were not fulilled by the variable AREA. This agrees with previous work that reported that simple posturographic variables were not suficient to evaluate TA in normal visual and standing surface conditions (Hæggström et al., 2006).
As expected (Woollacott and Shumway-Cook, 2002), increasing the dificulty of the task led to larger values of simple variables; for instance, the average
values of AREA across subjects and data collection
points were 1.9±1.8 cm2 in condition RO, 2.7±2.3 cm2
in condition RC, 8.4±3.9 cm2 in condition FO and
18.5±8.5 cm2 in condition FC.
In agreement with our main hypothesis, increasing values of the simple variables correlated with a stronger
effect of TA on these variables. For instance, one
could observe in Figure 3 that the two requirements mentioned above (low intra-bin variabilities and high inter-bin differences as shown by the superimposed horizontal segments) were fulilled in conditions RC, FO and FC. Table 1 quantiies these observations. Although TA has a signiicant effect on AREA in all conditions (p < 0.01), the effect size η2 (given by SS
TA /SSTOTAL) was much higher in condition FC (η2 = 0.18)
than in condition RO (η2 = 0.03).
We also found that the novel variables proposed
in Hæggström et al. (2006) did not allow for the clear discrimination between the “early” and the “late” bins. For instance, TA had no signiicant effect on
variable CT in the normal condition, and increasing
the task dificulty did not notably improve the quality of the discrimination (see Figure 3 and Table 1). TA had a signiicant effect on CT in condition RC and on FD in conditions RO and RC, but the effect sizes (respectively η2 = 0.02, 0.03 and 0.02) were much smaller than that corresponding to variable AREA in
condition FC (η2 = 0.18). Figure 2. Example of the stabilogram diffusion plot for the COP
trajectory of one subject in the eyes open and rigid surface test conditions at the beginning of the experiment. The critical time
variable is found at the intersection between two linear its adjusted
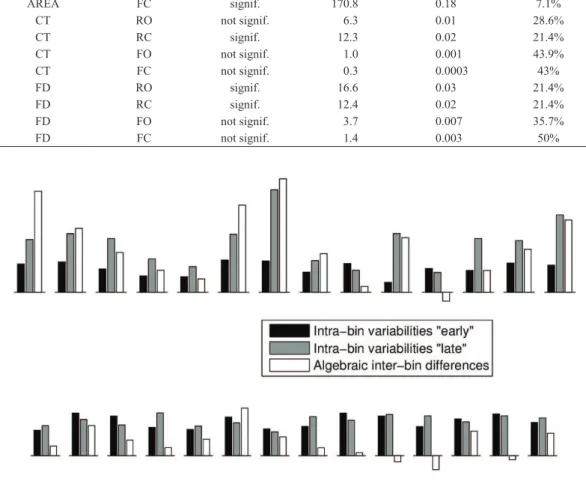
For a more detailed comparison of the variable AREA in condition FC and variable FD in condition
RO (the novel variable from Hæggström et al. (2006) that performed the best in our data), we plotted the
intra-bin variabilities and the inter-bin differences for each of the 14 subjects in Figure 4. One can note that for AREA/FC, the algebraic inter-bin differences
(white bars) were positive for 13 out of the 14 subjects, meaning that AREA was, on average, higher in “late”
trials than in “early” trials in 92.9% of the subjects (for
the other variables/conditions, see the last column of
Table 1). Moreover, for most subjects, the inter-bin differences were at the same level or even larger in many subjects than the intra-bin variabilities (black and grey bars).
In contrast, for FD/RO, 3 of the 14 subjects behaved
differently from the majority. Additionally, for most
subjects, the inter-bin differences were smaller than
Figure 3. Values of some variables (AREA, CT, FD) in four typical subjects as a function of TA. The values were normalized so that the
the intra-bin variabilities (see also the values of η2
reported above).
Protocol for evaluating time since
awakening
Based on the observations of the previous section,
we here propose a practical protocol for determining whether TA is larger than a certain threshold TCUT.
By convention, if TA < TCUT, we will say that the test
result is negative and if TA > TCUT, we will say that it is positive.
For simplicity, we describe and assess the
robustness of the protocol for a single variable and
a single condition (the most discriminating pair
variable/condition according to the previous section:
AREA/FC), but it is possible to combine multiple
variables and multiple conditions to further improve
the results (see Discussion).
Description of the protocol
• Database construction phase: We suppose
that the baseline amount of sway of each
subject is known to the experimenter. For
Table 1. Effect of TA on some variables (ANOVA test). Note: The last column gives the percentage of subjects for whom the effect of TA
was opposite to that of the majority of the subjects.
Variables Cond Effect of TA F-value Effect size η2 “Dissenting”
subjects
AREA RO signif. 17.8 0.03 21.4%
AREA RC signif. 93.4 0.12 0%
AREA FO signif. 113.3 0.15 0%
AREA FC signif. 170.8 0.18 7.1%
CT RO not signif. 6.3 0.01 28.6%
CT RC signif. 12.3 0.02 21.4%
CT FO not signif. 1.0 0.001 43.9%
CT FC not signif. 0.3 0.0003 43%
FD RO signif. 16.6 0.03 21.4%
FD RC signif. 12.4 0.02 21.4%
FD FO not signif. 3.7 0.007 35.7%
FD FC not signif. 1.4 0.003 50%
Figure 4. Subject-by-subject assessment of discrimination quality. Top: Variable AREA, condition FC. Bottom: Variable FD, condition RO.
example, this can be done by measuring the
subject’s sway several times in normal awake conditions (e.g., when TA ≤ 10 h), computing
and averaging the values of the variable across
the trials, and inally, recording the average value µ in the subject’s database record (in a bus company, for example, this would be done upon hiring a new driver and the database would be updated regularly thereafter). This is what we meant by “limited prior knowledge of the subjects’ posturographic history” (see Introduction), as opposed to protocols that require posturographic data for an entire 36 h
period.
• Test phase: In the test phase, the subject is measured N times in a row. The values of
the variable are then computed and averaged
across the N trials (for practical reasons, N
should not exceed 3 or 4, but the larger the
N, the more reliable the test). If the average
value of the variable is larger than k times
the value m in the database (in practice, the coeficient k will be determined according to a certain trade-off, see below), then the test is declared positive. Otherwise, it is declared
negative.
Assessment of the robustness of the protocol
We statically assessed the robustness of this protocol
based on our experimental data as follows.
• Database construction phase: The baseline value m was deined as the average value of the variable computed across the irst 10 trials (5 data collection points with TA = 2 h …10 h × 2 reps).
• Test phase: We considered the combinations of N trials taken from those with TINI ≤ TA <
TCUT. For a given combination, if the average value of the variable computed across N trials of the combination is larger than km, then the combination is incorrectly labelled as positive. We call such a combination a false positive. The ratio of false positives over the total number of N-combinations
is called the false positive rate (FPR). Similarly, we considered the combinations of N trials taken from those with TCUT < TA ≤
TEND. For a given combination, if the average value of the variable computed across N trials of the combination is larger than km, then the combination is correctly labelled as positive. We call such a combination a true positive. The ratio of true positives over the total number of N-combinations is called the
true positive rate (TPR).
One can observe that the protocol is robust if its
FPR is low and its TPR is high. There is, however, a trade-off between these two quantities; for example, when the coeficient k increases, the FPR decreases while the TPR decreases. To assess the robustness of the protocol, we plotted the TPR versus the FPR (yielding the Receiver Operating Characteristic or ROC curve). The robustness of the protocol could then be quantiied by the Area Under the ROC Curve (AUC), with AUC = 1 for perfect discrimination and AUC = 0.5 for indifferent discrimination (Su and Liu, 1993).
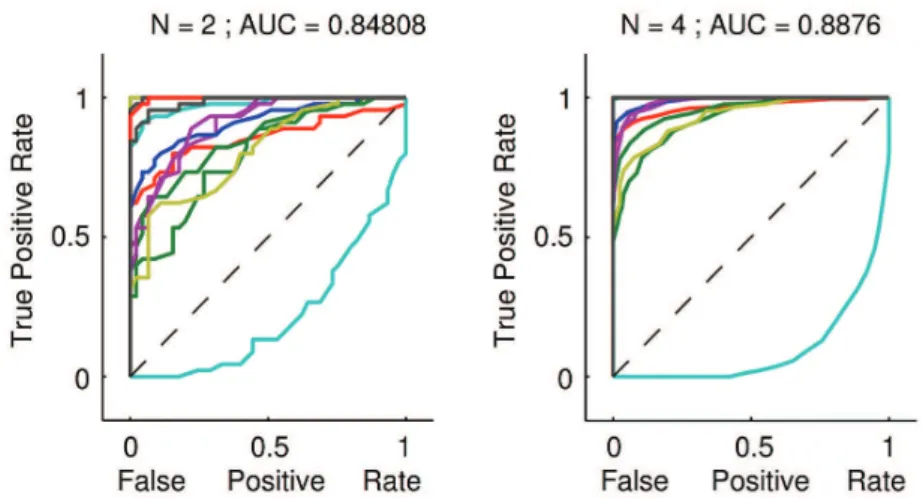
The ROC curves were plotted in Figure 5 for N = 2 (left plot) and N = 4 (right plot). For both
plots, TINI = 12 h, TCUT = 21 h and TEND = 30 h, i.e.,
Figure 5. Receiver Operating Characteristic (ROC) curves for our proposed protocol, which aims at discriminating trials with TA = 12 h …
20 h (negative trials, cf. the beginning of section Protocol…) from those with TA = 22 h … 30 h (positive trials). Left plot for N = 2 and right
plot for N = 4 (see Protocol…). The individual ROC curves for the 14 subjects were plotted in thin lines. The values of the Area Under the
we wanted to discriminate trials with TA = 12 h … 20 h from those with TA = 22 h … 30 h (note that
setting TINI = 12 h and TEND =30 h is more realistic and yields a harder challenge for the protocol than setting TINI = 2 h and TEND = 36 h because the irst trials tend to have a small AREA and the last trials
tend to have a large AREA).
One can see that our protocol allowed very clear discrimination in trials with TA = 12 h … 20 h from those with TA = 22 h … 30 h. For N = 4, the AUC of the average ROC curve was 0.89. For N = 2, the discrimination power was lower but still very good (AUC = 0.85). Note that all the individual ROC curves, except that of subject HEAN (cf. also Figure 3), were well above the no-discrimination line for both N = 4 and N = 2.
Depending on need, one may choose different
operating regimes. For N = 4, if one needs a low average FPR, e.g., 10%, this corresponds to k = 1.19 and an average TPR across subjects of 81%.
Alternatively, if one needs a high average TPR, e.g.,
90%, this corresponds to k = 1.10 and an average FPR of 18% (these results were obtained excluding subject HEAN).
Discussion
By using the Foam Surface/Eyes Closed condition,
we increased the dificulty of the quiet-standing task and thereby, were able to clearly discriminate between “early” (TA < 21 h) and “late” (TA > 21 h) trials. The variable we used (AREA) is directly related to the amount of sway displayed by the subject, and as
such, is easy to compute and interpret in physiological
terms. The reliability of the results was particularly high; 13 out of 14 subjects (or 92.9%) had a higher
average AREA in the “late” than in the “early” trials
in condition FC (and even 100% in conditions RC and FO). This variable (in the experimental conditions we considered) was more reliable than the novel variables proposed in the literature (Hæggström et al., 2006).
Based on the experimental results, we proposed a protocol to determine whether TA > 21 h. The robustness of this protocol was statistically
demonstrated on a subject-by-subject basis. We
insist on the practical character of this protocol; the database construction phase requires only 10 trials in the normal awake condition (TA ≤ 10 h), and the test phase may include as little as two 40 s trials.
A limitation of this study is its small sample size. This sample size is due to dificulty recruiting subjects for complex data collection which requires the subjects to stay awake for 36 hours. However, the proposed
protocol is based on a subject-by-subject analysis, and
we are conident that the present results are robust.
Our experiments and protocol can be further
improved in several ways. First, combining multiple variables and conditions (e.g., AREA/FC, AREA/ FO and FD/RO) using standard statistical tools, such as Linear Discriminant Analysis (Su and Liu, 1993) or multi-dimensional classiication algorithms, should improve the discrimination quality. Second, assuming a higher discrimination quality, it should
be possible to use a dichotomy search to determine
TA with higher precision. Third, taking into account circadian rhythm in our experiments (for instance, by awakening subjects at times of day other than 7 a.m.) may lead to a more precise understanding of
the effects of TA. Finally, our protocol needs to be tested in a real-life scenario.
Acknowledgments
We would like to thank the São Paulo Research Foundation (FAPESP), Research, Innovation and Dissemination Centers (CEPID-FAPESP) and the National Council for Scientiic and Technological Development (CNPq) for inancial support for this research. We would also like to thank the Multidisciplinary Center for the Study of Drowsiness and Accidents (CEMSA), the Center for Psychobiology and Exercise Studies (CEPE), and the Research Incentive Fund Association (AFIP) for their partnership.
References
Collins JJ, De Luca CJ. Open-loop and closed-loop control
of posture: a random-walk analysis of center-of-pressure trajectories. Experimental Brain Research. 1993; 95(2):308-18. PMid:8224055. http://dx.doi.org/10.1007/BF00229788 Dawson D, Reid K. Fatigue, alcohol and performance impairment. Nature. 1997; 388(6639):235. PMid:9230429. http://dx.doi.org/10.1038/40775
Duarte M, Zatsiorsky VM. On the fractal properties of natural
human standing. Neuroscience Letters. 2000; 283(3):173-6. http://dx.doi.org/10.1016/S0304-3940(00)00960-5 Forsman P, Haeggstrom E, Wallin AE, Toppila E, Pyykko I. Principal component analysis detects sleepiness-related changes in balance control. Gait & Posture. 2010; 32(3):419-21. PMid:20634074. http://dx.doi.org/10.1016/j. gaitpost.2010.06.012
Hæggström EO, Forsman PM, Wallin AE, Toppila EM, Pyykko IV. Evaluating sleepiness using force platform posturography. IEEE Transactions on Bio-medical Engineering. 2006; 53(8):1578-85. PMid:16916092. http:// dx.doi.org/10.1109/TBME.2006.878069
Hallvig D, Anund A, Fors C, Kecklund G, Akerstedt T. Real
and subjective sleepiness. Biological Psychology. 2014; 101:18-23. PMid:25010991. http://dx.doi.org/10.1016/j. biopsycho.2014.07.001
Hirvonen K, Puttonen S, Gould K, Korpela J, Koefoed VF, Muller K. Improving the saccade peak velocity measurement
for detecting fatigue. Journal of Neuroscience Methods.
2010; 187(2):199-206. PMid:20083140. http://dx.doi. org/10.1016/j.jneumeth.2010.01.010
Hoddes E, Zarcone V, Smythe H, Phillips R, Dement WC. Quantification of sleepiness: a new approach. Psychophysiology. 1973; 10(4):431-6. PMid:4719486. http://dx.doi.org/10.1111/j.1469-8986.1973.tb00801.x Howard ME, Jackson ML, Kennedy GA, Swann P,
Barnes M, Pierce RJ. The interactive effects of extended
wakefulness and low-dose alcohol on simulated driving and vigilance. Sleep. 2007; 30(10):1334-40. PMid:17969467 PMCid:PMC2266271.
Liu NH, Chiang CY, Hsu HM. Improving driver alertness
through music selection using a mobile EEG to detect
brainwaves. Sensors. 2013; 13(7):8199-221. PMid:23803789 PMCid:PMC3758591. http://dx.doi.org/10.3390/s130708199
Mancini M, Salarian A, Carlson-Kuhta P, Zampieri
C, King L, Chiari L, Horak FB. ISway: a sensitive,
valid and reliable measure of postural control. Journal
of NeuroEngineering and Rehabilitation. 2012; 9:59. PMid:22913719 PMCid:PMC3481400. http://dx.doi. org/10.1186/1743-0003-9-59
Morad Y, Azaria B, Avni I, Barkana Y, Zadok D, Kohen-Raz
R, Barenboim E. Posturography as an indicator of fatigue due to sleep deprivation. Aviation, Space, and Environmental
Medicine. 2007; 78(9):859-63. PMid:17891895.
Noce F, Tuik S, Mello MT. Professional drivers and working time: journey span, rest, and accidents. Sleep Science. 2008; 1:20-6.
Oliveira LF, Simpson DM, Nadal J. Calculation of area of stabilometric signals using principal component
analysis. Physiological Measurement. 1996; 17(4):305-12. PMid:8953629. http://dx.doi.org/10.1088/0967-3334/17/4/008
Pinho RS, Silva-Junior FP, Bastos JP, Maia WS, Mello
MT, Bruin VM, Bruin PF. Hypersomnolence and accidents
in truck drivers: a cross-sectional study. Chronobiology
International. 2006; 23(5):963-71. PMid:17050211. http:// dx.doi.org/10.1080/07420520600920759
Smith SS, Cheng T, Kerr GK. The effect of extended wake
on postural control in young adults. Experimental Brain
Research. 2012; 221(3):329-35. PMid:22821076. http:// dx.doi.org/10.1007/s00221-012-3175-8
Su JQ, Liu JS. Linear-combinations of multiple diagnostic markers. Journal of the American Statistical Association.
1993; 88(424):1350-5. http://dx.doi.org/10.1080/016214 59.1993.10476417
Tietavainen A, Gates FK, Merilainen A, Mandel JE,
Haeggstrom E. Nintendo(R) Wii Fit based sleepiness
tester detects impairment of postural steadiness due to 24
h of wakefulness. Medical Engineering & Physics. 2013; 35(12):1850-3. PMid:24054980. http://dx.doi.org/10.1016/j. medengphy.2013.08.007
Williamson A, Friswell R, Olivier J, Grzebieta R. Are drivers aware of sleepiness and increasing crash risk while driving? Accident Analysis & Prevention. 2014; 70:225-34. PMid:24803170. http://dx.doi.org/10.1016/j.aap.2014.04.007 Winter DA. Human balance and posture control during standing and walking. Gait & Posture. 1995; 3(4):193-214. http://dx.doi.org/10.1016/0966-6362(96)82849-9 Woollacott M, Shumway-Cook A. Attention and the control of posture and gait: a review of an emerging area of research. Gait & Posture. 2002; 16(1):1-14. http://dx.doi.org/10.1016/ S0966-6362(01)00156-4
Authors
Quang-Cuong Pham, Marcos Duarte*
Biomedical Engineering, Universidade Federal do ABC – UFABC, Av. dos Estados, 5001, CEP 09210-580, Santo André, SP, Brazil.
Marco Túlio de Mello, Fernanda Veruska Narciso, Marcos Mônico Neto, Cristiane Westin Teixeira, Leandro
Stetner Antonietti, Sílvio de Araújo Fernandes Júnior, Renata Guedes Koyama, Sérgio Tuik
Centro Multidisciplinar em Sonolência e Acidentes, São Paulo, Brazil.
Marco Túlio de Mello, Sérgio Tuik
Centro de Estudos em Psicobiologia e Exercício, São Paulo, Brazil.
Silvério Aparecido Garbuio, Sérgio Tuik
Instituto do Sono, São Paulo, Brazil.
Cristiane Westin Teixeira, Leandro Stetner Antonietti, Silvério Aparecido Garbuio,Renata Guedes Koyama, Sérgio
Tuik
Associação Fundo de Incentivo a Pesquisa, São Paulo, Brazil.
Marco Túlio de Mello, Fernanda Veruska Narciso, Marcos Mônico Neto, Sílvio de Araújo Fernandes Júnior, Sérgio
Tuik