http://dx.doi.org/10.1590/0104-530X1313-15
Resumo: De acordo com a literatura, os princípios enxutos não devem somente ser aplicados na manufatura, mas também se estender para outros processos, principalmente aos mais a montante na cadeia de produção, como é o caso do processo de desenvolvimento de produto (PDP), o qual possui grandes oportunidades para a aplicação desses princípios. É importante que o produto seja desenvolvido com base nos princípios enxutos, para que possíveis desperdícios provenientes do PDP sejam evitados no momento da manufatura. O desenvolvimento de produto enxuto consiste em aplicar no PDP tanto os princípios enxutos, aprendidos em Lean Manufacturing (LM), quanto as práticas enxutas especíicas para o desenvolvimento de produtos. Este artigo objetiva investigar se empresas industriais brasileiras, com o LM considerado consolidado, transferem os princípios e práticas enxutos para o PDP. Os dados foram obtidos por meio de uma pesquisa survey, com uma amostra de 47 empresas industriais brasileiras. Além de análise descritiva, também foi realizada uma análise de Cluster, considerando o grau de aplicação das práticas e princípios enxutos no PDP. A análise dos resultados evidencia que a maioria das empresas transferiu os princípios enxutos aprendidos com o LM para o PDP, mas ainda não consegue aplicar, em mesmo grau, as práticas enxutas no PDP. Por outro lado, 15% das empresas da amostra, apesar de terem consolidado o LM e terem um processo de desenvolvimento considerado crítico para o negócio, não estenderam os princípios e nem as práticas enxutas para o PDP.
Palavras-chave: Desenvolvimento de produto enxuto; Princípios enxutos; Práticas enxutas; Lean Development. Abstract: According to the literature, lean principles should be applied not only in manufacturing, but should also be extended to other processes, especially to those more upstream along the production chain, such as the product development process (PDP), which presents great opportunities for the application of these principles. It is important that the product be developed based on lean principles, so that potential wastes from the product development process are avoided in manufacture. Lean development consists in trying to apply both the lean principles learned in Lean Manufacturing (LM) and the speciic lean practices for product development. This paper aims to investigate whether Brazilian companies with well-established Lean Manufacturing transfer the lean principles and practices to the product development process. Data were obtained through a survey conducted in 47 industrial Brazilian companies. In addition to descriptive analysis, an analysis of Cluster was performed considering the degree of implementation of the lean practices and principles in the PDP. The results of these analyses show that most companies transfer lean principles learned from the LM to the PDP, but they still cannot apply lean practices in the PDP to the same degree. In contrast, although 15% of the sampled companies have consolidated the LM and present a development process considered critical to the business, they extended neither the lean principles nor the lean practices to the PDP.
Keywords: Product development process; Lean principles; Lean practices; Lean Development.
Application of lean approach in the product
development process: a survey on Brazilian industrial
companies
Aplicação da abordagem lean no processo de desenvolvimento de produto: um survey em empresas industriais brasileiras
Larissa Maria Prisco Pinheiro1 José Carlos de Toledo1
1 Departamento de Engenharia de Produção, Universidade Federal de São Carlos – UFSCar, CEP 13565-905, São Carlos, SP, Brazil,
e-mail: larissaguiga@yahoo.com.br; toledo@dep.ufscar.br Received Mar. 11, 2014 - Accepted Sept. 22, 2015
Financial support: None.
1 Introduction and justiication
The principles of lean production, or Lean
Manufacturing (LM), were developed in the 1960s
by Toyota as an evolution of the concept of integrated
production and structuring of production practices
that were adopted in Toyota plants. This philosophy
and management approach were summarized in ive principles: value, value stream, low, pull production
and perfection (Liker, 2004).
as chronic by the Toyota Production System: waiting,
overproduction, transportation, defects, inventory, handling and unnecessary processing.
Womack & Jones (1996) broaden the scope of understanding of lean principles, emphasizing that the same would apply to any company, should be extended to the product development process (PDP). A comparative survey conducted by Morgan (2002), in the global auto industry, suggests that performance
in product development can be beneited by the same
tools and lean methods that guided the revival of US manufacturing.
The application of lean approach only in manufacturing
processes would restrict the achievement of its potential
beneits, as the constant search for waste disposal has
become role not only in manufacturing, becoming a responsibility for several areas of the organization, mainly to product design, since its result directly impacts the production process and product performance
and process. Thus, the lean approach can be applied
to the process of product development, in order to
expand the beneits gained from the application of
its principles in production processes, by creating products that add value for customers with low rates of waste (Morgan & Liker, 2006).
Studies on the implementation and the results of the Lean Manufacturing are already widely reported in the literature, national and international (Sánchez & Pérez, 2001; Rahman et al., 2010; Veiga et al., 2011; Meiling et al., 2012), but little has been reported about the implementation and results of the lean product development process, or Lean Development (LD).
In Brazil, there are few papers speciically related to
the topic Lean Development, and it is more common
to ind publications that deal with the application of
lean principles in manufacturing and administrative processes.
Publications identiied in literature on Lean
Development (Oppenheim, 2004; Hines et al., 2006; Possamai & Ceryno, 2008; Dal Forno et al., 2008; Pessôa et al., 2008; Salgado et al., 2009; Dal Forno & Forcellini, 2012) mostly deal with the subject in general terms, focusing on the concepts and tools, and there is little information about its applications and mainly on the results that this application is generating for the company. Some papers (Dal Forno et al., 2008;
Salgado et al., 2009) speciically address the research
as a principle or a particular Lean Development tool being deployed individually and what results it brings to the company.
Based on the literature, presenting arguments that lean principles should not be applied only in manufacturing, but in all areas of the organization, among them in the product development process, which the results directly impact the production process and product performance and process, there is the concern whether, and to what degree, Brazilian companies
with consolidated strategies of Lean Manufacturing
are considering this possibility. The literature also
suggests that the product development process would have a greater impact on the company lean than the
actual lean production. Thus, it deserves investigating
what principles and tools these companies are using and if they are already noticing concrete results arising from the application of lean principles in the product development process.
In this scenario, this paper is guided to discuss information about the implementation of Lean concepts in the product development process, knowing and identifying whether, and how, i.e., the use of which practices and tools, Brazilian companies that adopt the
LM for at least ive years, i.e, at irst would possess
lean principles more consolidated in manufacturing, deploying and/or diffusing these principles and practices in the PDP. In addition, it has aimed to group the companies according to the proximities and
afinities of the principles and practices that are being
adopted in the implementation of lean development. For this, we obtained data on the use of lean principles and tools in the PDP of a sample of Brazilian industrial companies considered innovative, with active product development in the country and have the Lean Manufacturing implemented or under
implementation for at least ive years.
A ield study was conducted by survey, using a questionnaire along an accessible and identiied
population of 73 companies, obtaining a sample of 47 questionnaires properly answered.
Topic 2 of the paper presents the theoretical
framework on the lean development and its principles
and tools. The third topic presents a description of
the method and the research variables and also the
units of analysis. The results and data analysis are presented in topic 4 and inally topic 5 presents the inal considerations.
2 Lean development
A lean approach to product development is a valuable asset and its base is the importance of appropriate integration of people, processes, tools and technologies to add value to the consumer and society (Morgan & Liker, 2006).
The strategy behind the lean product development
is to consolidate a strong reactivity capacity to market demands and competitive positioning of the company as a leader in its segment (Liker & Morgan, 2006; Reinertsen, 2005).
There are more opportunities for competitive
advantage in product development than in any other department or area of industrial companies
(Morgan & Liker, 2006; Sousa Mendes & Toledo, 2015; Toledo et al., 2008). Two factors support this
best performance and the rest of the competitors concerning the development of products tends to
increase. In addition, the current levels of eficiency
in manufacturing presage that the focus on production will have diminishing returns in the future. Second,
even if a strong production system can inluence the quality and productivity, the ability to inluence
the value set by the consumer is much higher in the early stages of the product development process and decreases as the development nears release stage of the new product. Furthermore, the production area
compared to product development, has little inluence
on the initial selection of suppliers. In the automotive industry, e.g., about 60% of the components are produced by suppliers and this is a tendency for other manufacturer industries. Hence, the supplier’s contribution to the engineering, production and, consequently, the proper choice of supplier has a
signiicant impact on the cost and total quality.
Reinertsen (2005) states that the development of lean product attempts to apply the principles learned in Lean Manufacturing in the product development
area and they are used to create a low that will make it more streamlined and eficient process. The possibility
of putting faster on the market a new product will increase the reactivity capacity of the company.
Tools adapted from Lean Manufacturing, e.g.,
Kaizen, 5S, mapping processes and other basic tools quality may be used provided that they are adapted to the PDP. For example, in the case of the 5S, the idea is to focus on the disposal of unwanted information rather than, e.g., the cleanliness of the manufacturing environment (Womack & Jones, 1996). In addition, tools that aid the visualization of a project and communication within the project team can be used to help the team members to know what their roles are and the necessary integration. Examples of such tools: a room dedicated to each project, a graphic design (visual) at the beginning of the project and task lists of what needs to be done and prioritized (Liker & Morgan, 2006; Reinertsen, 2005).
Salgado et al. (2009) conducted an analysis, from the compilation of several authors publications, principles and tools of lean manufacturing, as well
as the PDP waste. The authors prepared a summary
presented in Chart 1, which identiies the tools that are best suited to treat the PDP waste. Analysis of the table shows that the value stream mapping is suggested as a useful tool in identifying all the PDP waste.
Some practices used to achieve the goals of Lean product development are the SBCE – Set based concurrent engineering, involvement of suppliers and customers as early as possible, visual management, teamwork and cross-functional teams (Karlsson & Ålhström, 1996). Standardize the PDP, reduce the size of lots of transmitted reports from one stage to another and elect a strong project leader, representing the
customers and capable of implementing his capacity,
are factors that make the low of the process faster
(Kristofferson & Lindeberg, 2006).
Cusumano & Nobeoka (1998) state that the focus of lean product development is the integrated management of multiple projects, maximizing the number of new product models for each platform design, the intense reuse of components and technologies across projects aiming economy of scale and scope.
What also distinguishes the lean development is the emphasis on the operation of multiple design alternatives in the initial phases, delaying the concept and solution freezing, eliminating the alternatives evaluated as inferior in that the level of detail
progresses until only the inal solution, increasing the
probability that this solution is best compared with the usual practice of iterations on the same alternative
(previously deined) until the design requirements are met. This practice is called Set Based Concurrent
Engineering - Concurrent Engineering Based on Possible Solutions Sets or SBCE (Ward et al., 1995; Sobek et al., 1999).
2.1 Lean principles in product development environment
Mascitelli (2004) presents the development of lean product with the main goal of achieving integration between product development activities and the manufacturing process, i.e., a type of co-development. Further, underlines the need for the new product should seek preferably to use materials of the current factory inventory, the same supplier base, few components and
/ or assemblies, similar process low to the existing
and that enables small batches as well as tolerances
as the current capabilities of the process. The author presents ive principles for lean product development:
- Principle 1: Deine precisely the customer’s problem and identify the speciic function to
be performed to resolve the problem;
- Principle 2: Identify the process faster by which
the identiied functions can be integrated into
a low cost and high quality product;
- Principle 3: Remove any waste item and redundant or unnecessary cost, to reveal a great product solution;
- Principle 4: Listen often and interactively to the voice of the customer throughout the development process;
2.2 Lean practices of product development
Dal Forno et al. (2008) present a compilation of the main lean practices in the development of products mentioned in the literature:
- Value Stream Mapping: aims to develop a picture of the current state to view some waste and calculate the lead time. After, in the future state map and action plan, improvements are planned;
- Visual management: visual management, whether electronic or physical form, consider the standardization, in order to facilitate a common understanding of the team, it makes them visible problems and shows the project
scope with quality indicators, time and cost. A visual picture to the schedule of dates and phases of ongoing projects helps the visualization of meeting deadlines and taking preventive measures on time, as the project performance conference frequency (Locher, 2008);
- SBCE: On Set Based Concurrent Engineering, the entire development team establishes and develops a set of parallel and independent alternatives through the stages of the PDP and at the end, the best alternative is generated
and tested in order to do it right the irst time
(Schäfer & Sorensen, 2010; Madhavaram & Appan, 2010).
Chart 1. Application of tools of lean manufacturing in the PDP waste.
Product Development Process Waste Applicable Lean Tools
Waiting
Mapping the value stream Total productive maintenance Improved customer / supplier relation Reducing the number of suppliers Synchronized production Receipt / supply just in time
Transport
Mapping the value stream Group technology
Work in continuous streaming / reduction of the lot size Total productive maintenance
Movement
Mapping the value stream
Work in continuous streaming / reduction of the lot size 5S
Unnecessary Processes Mapping the value stream 5S
Stock Mapping the value stream
Work in continuous streaming / reduction of the lot size
Overproduction
Mapping the value stream 5S
Synchronized production
Defects
Mapping the value stream Quality control tools Zero defect Failsafe tools
Reinvention
Mapping the value stream Performance measures Group Technology Visual control graphics
Lack of discipline in the process
Mapping the value stream Empowerment
Working in teams Performance measures
Commitment of employees and senior management Multi-enabled worker / rotation functions
Personal training Limited Information technology
resources
Thus, one should ensure that the information and knowledge low in cadenced manner (takt
time), continuous (no waiting and no returns) and pulled (according to the actual demand of the next step) throughout the development (McManus,
2005). The information should be available at the
time and right place and at the right amount. It is also essential to apply the Set Based Concurrent Engineering. According to Kennedy (2003), the SBCE simultaneously explores various possible solutions for the project, articulated for different subsystems and gradually eliminates the weaker until it converges
to the inal solution, delaying the decision until the
maturity level of the project will allow to take it with
the least possible risk. Thus, the inal solution that
is more likely to actually be the best for the project
among those considered. The author also claims that Toyota’s development process starts with the statement of goals, and the product speciications
are the result of the process and not its starting point.
3 Research method
In order to achieve the goal, a structured questionnaire was developed and used for implementation of the survey in order to evaluate objectively and systematically
answers and allow greater lexibility for the evaluation
of results. Both open and closed questions were used in the questionnaire. For closed questions, we used the Likert scale, ranging from 1 to 5.
Initially, there was a pre-test or pilot test of the
questionnaire in ive companies, each of the following
industries: white goods, aviation, food, consumer
goods and chemical. These companies have both the LM applied for more than ive years as product development in the unit itself. This information was
obtained through direct contact between researchers and companies.
The pretest was applied to face way in the ive
companies with the manager or coordinator of the
product development area. Thus, it was found that
the questionnaire was appropriate to provide relevant data, so that the goal of the research was reached.
After the pretest questionnaire was reined, more speciically in terms of the response options available
to closed questions in order to avoid uncertainties by the respondent at the moment to answer this questionnaire. .
The questionnaire was sent by electronic mail (e-mail) to the same ive companies that conducted
the pretest in order to obtain the preliminary degree of reliability of the survey questionnaire through the Alpha Cronbach factor, which was calculated by
the XLSTATS version 7.5.2 software. According to
Hair et al. (2006), the questionnaire and the metrics used are suitable because the value of Cronbach’s
alpha is greater than 0.7. The calculated value for
Cronbach’s Alpha was 0.955, indicating that respondents
understand the questions and the answers of the questionnaire tended to have consistency and internal coherence, validating it as a tool of this research.
3.1 Research variables
Research variables used to develop the questions contained in the questionnaire, which were used in the analysis of the results, were determined from the literature on the principles and practices of Lean Development. Hence, the analysis of the results from these variables allows the results to be evaluated in terms of the principles and lean product development practices of the companies analyzed.
Before testing the relationship between the different
types of variables identiied, Forza (2002) states
that it is necessary to translate them into observable operational elements and / or subject to measurement, i.e. to perform the operationalization of the constructs, by presenting elements that will be taken as the basis of observation to analysis of each construct. For this, the variables were deployed into a set of elements that could transcribe or illustrate more clearly these variables in the structured questionnaire. Each variable can be directly or indirectly related to one or more questions of the questionnaire, through its elements.
The research variables, their respective elements
deployment and the survey questions in which they are contained are shown in Chart 2.
3.2 Analysis units
The units of analysis are companies that are
embedded in the population of Brazilian industrial companies that have implemented Lean Manufacturing,
or in the implementation phase, for at least ive years
and who perform in the country activities of product
development and innovation. These were the criteria
used in the search that generated the target population from which extracted the sample studied.
The choice for analysis units that have the Lean
Manufacturing was given by the fact that they should already be in possession of lean concepts, and this fact may be seeking to apply these concepts in other areas of the organization, e.g., in product development process. Moreover, if the company has a performance level evolved in Lean Manufacturing, it is expected that it seeks to apply these concepts in product development, which is a process that precedes production and therefore the company could improve more the production performance if it also has lean concepts implemented in the PDP.
in the world, conducted by Boston Consulting Group; and List of the 100 most innovative company in the world, according to Forbes magazine). In relation to the latter two sources, only companies that have plants in Brazil were considered. In general the criteria used by these publications to consider whether a company
is innovative include the number of patents iled and
obtained, number or percentage of new products are launched every year and share of new products in overall sales of the company.
The information on whether the company had a lean manufacturing program for at least ive years,
it was not possible to be obtained in advance. But, it was expected that companies with the highest
innovative proile and active PDP in the country
had deployed a LM program, or equivalent, and a
few years ago. That was one of the irst questions of
the questionnaire, and was bound for the company to be part of the sample and continue to answer the questionnaire.
The selection, according to the three sources used, resulted in a population identiied of 73 companies to
which the questionnaire was submitted, and 68.5% of these companies, i.e., 50 companies returned completed questionnaires. Among the 50 respondent companies, 3 were eliminated from the analysis for not having implemented the Lean Manufacturing for at least 5 years. Hence, a total of 47 companies, or 64.4% of the companies that received the questionnaire was used for data processing and statistical analysis.
Table 1 shows the operating markets of the companies in the sample.
4 Results and analyses
4.1 Descriptive analysis of surveyed companies
This section presents the descriptive characterization
of the 47 companies surveyed.
Adopting the criteria for classiication of the size
of the companies proposed by Brazilian Institute of Geography and Statistics, IBGE, which takes into account the number of employees, it was observed that 87% of the sample is made up of large companies (considering the size of the interviewed unit) and the remaining 13% are medium-sized.
Regarding the nationality of the companies surveyed, Graphic 1 shows the distribution of companies according to their continent of origin. Most of the companies is of European origin. Next come companies with nationality of North America, South America and Asia.
The area of performance of the professionals
interviewed was the product development area, since the purpose of this paper is founded on the implementation of lean concepts in the product development process. Once the study of contextual factors of the organization requires that the respondent has an insight into both the micro process acting as the macro process in which it operates and also the organization as a whole, questionnaires were sent to the care of the head of PDP. Graphic 2 shows the distribution of positions of the professionals who answered the questionnaire.
Chart 2. Research variables (and reference authors), their elements and survey questions where they are contained.
Variable (V) Elements Questionnaire
questions
V1: Lean Development Tools
- Value stream mapping application in PDP (Womack & Jones, 2004)
- Use of SBCE (Sobek et al, 1999; Kennedy, 2003).
- Visual management of ongoing projects (Morgan & Liker, 2006)
1, 2, 3, 4, 5, 8 and 9
V2: Lean Development Principles (Morgan & Liker, 2006)
- Application of lean concepts in PDP - Dedicated project teams existence
- Existence of a project leader / chief engineer with extensive experience in the project area
- Development of the technical capabilities of the development engineers
- Senior management involvement in all stages of the PDP - Re-use of existing knowledge
- Integration between areas of PDP and manufacturing
6, 7, 10, 11 and 12
Source: Authors.
Table 1. Sample Companies Market/Industry.
Market/Industry Number of Companies
Automotive 12
Consumer goods 9
Metallurgical 7
Chemical 7
Alimentary 6
Hygiene and Health 3
Steel 2
Aeronautical 1
Total 47
Regarding the degree of importance that the PDP has within the company’s competitiveness strategy, all respondents believe that product development has a high degree of importance in the competitive strategy of the company. It is expected that companies that have this high degree have more strategic interest in allocating resources in the PDP, seeking effectiveness
and eficiency of these investments, and may thus
be more advanced at the level of implementation of lean concepts in the PDP.
It is also expected that companies with a greater coverage of PDP scope to have a greater interest in the allocation of resources to this process. Graphic 3 shows the coverage of the PDP scope of the evaluated
companies. For the classiication of the coverage of
the PDP scope, we used the following scale:
- Low - only minor changes / adjustments in existing products;
- Average - small and large changes / adjustments in existing products;
- High – small and minor changes / adjustments in existing products and the development of new products and / or technologies.
Approximately 80% of the sample’s companies have a high coverage of the PDP scope, which makes sense when compared to the fact that all have the product development area interviewed plan and also consider that the PDP has a high degree of importance in the competitive strategy of the company.
4.2 Descriptive analysis in relation to the lean development application
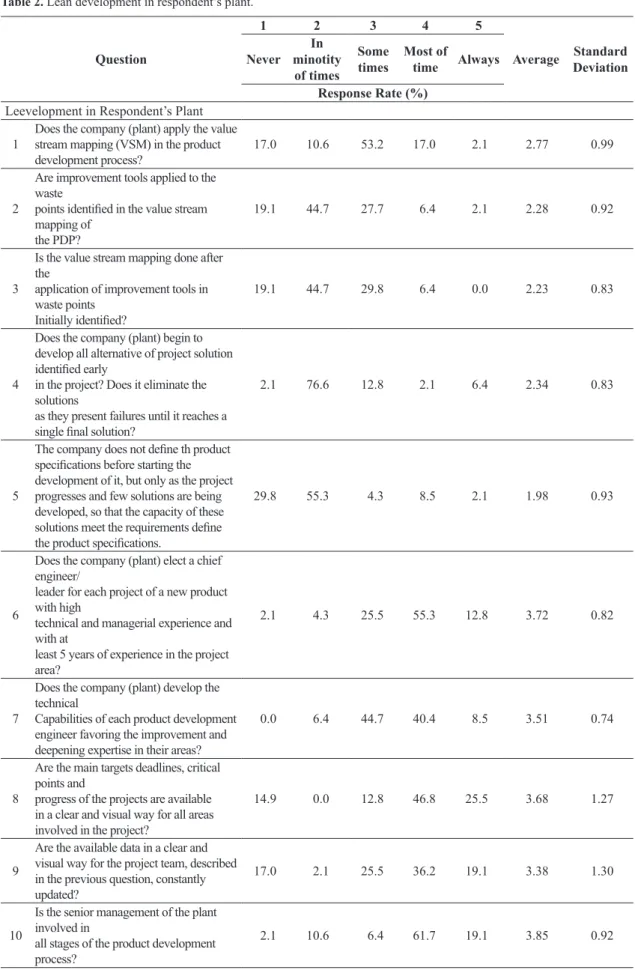
Table 2 shows the information regarding the frequency of notes assigned to the research variables (questions) on the Lean Development presence in the respondent’s plant, as well as their respective means and standard deviations.
It can be observed that the overall average of the variables in relation to Lean Development in the respondent plant is 3.13, which indicates that Lean Development is perceived as applied “sometimes” in the surveyed companies. No question presented average response (considering the whole sample) less than 4. All of these issues, as well as the evaluation scale used, are shown in Table 2.
The answers showed lower intensity average of
presence in the companies were questions 1, 2, 3, 4 and 5, with averages of 2.77, 2.28, 2.23, 2.34 and 1.98, respectively, all for the use of lean tools for product development (value stream mapping and SBCE). However, some issues related to lean principles have averages above 3.50, such as questions 6, 7, 8, 10, 11 and 12, indicating a closer alternative to “applies most of the time.”
The question 12, concerning the principle of
integration between areas of manufacturing and product development, is the highest average (3.96) and lower standard deviation (0.41), indicating a relatively high application of this principle and less difference in the intensity of application between companies, indicated by a significantly lower
standard deviation. The question 5, which focuses
on an element of SBCE tool, had the lowest average (1.98), with a standard deviation of 0.93, indicating a lower intensity of use.
Questions 4 and 5, regarding the use of SBCE, a
basic and speciic tool of LD showed respectively
78.7% and 85.1% of the frequency of anwers in the alternative “not applicable” or “applies in the minority of cases” indicating the low use of this
Graphic 1. Distribution of companies surveyed according
to nationality.
Graphic 2. Area of the interviewed employees.
Graphic 3. Coverage of PDP scope of the companies
Table 2. Lean development in respondent’s plant.
Question
1 2 3 4 5
Average Standard Deviation Never
In minotity
of times
Some times
Most of time Always Response Rate (%)
Leevelopment in Respondent’s Plant
1
Does the company (plant) apply the value stream mapping (VSM) in the product development process?
17.0 10.6 53.2 17.0 2.1 2.77 0.99
2
Are improvement tools applied to the waste
points identiied in the value stream mapping of
the PDP?
19.1 44.7 27.7 6.4 2.1 2.28 0.92
3
Is the value stream mapping done after the
application of improvement tools in waste points
Initially identiied?
19.1 44.7 29.8 6.4 0.0 2.23 0.83
4
Does the company (plant) begin to develop all alternative of project solution identiied early
in the project? Does it eliminate the solutions
as they present failures until it reaches a single inal solution?
2.1 76.6 12.8 2.1 6.4 2.34 0.83
5
The company does not deine th product speciications before starting the development of it, but only as the project progresses and few solutions are being developed, so that the capacity of these solutions meet the requirements deine the product speciications.
29.8 55.3 4.3 8.5 2.1 1.98 0.93
6
Does the company (plant) elect a chief engineer/
leader for each project of a new product with high
technical and managerial experience and with at
least 5 years of experience in the project area?
2.1 4.3 25.5 55.3 12.8 3.72 0.82
7
Does the company (plant) develop the technical
Capabilities of each product development engineer favoring the improvement and deepening expertise in their areas?
0.0 6.4 44.7 40.4 8.5 3.51 0.74
8
Are the main targets deadlines, critical points and
progress of the projects are available in a clear and visual way for all areas involved in the project?
14.9 0.0 12.8 46.8 25.5 3.68 1.27
9
Are the available data in a clear and visual way for the project team, described in the previous question, constantly updated?
17.0 2.1 25.5 36.2 19.1 3.38 1.30
10
Is the senior management of the plant involved in
all stages of the product development process?
2.1 10.6 6.4 61.7 19.1 3.85 0.92
tool, with averages of 2.34 and 1.98. Concerning the application of value stream mapping tool, represented by questions 1, 2 and 3 are relatively slightly larger, with average respectively of 2.77, 2.28 and 2.23 and with the frequency of responses of 63.8%, 72.4% and 74.5% in the alternative “applies in the
minority of cases” or “sometimes applies.” A speciic
implementation of the value stream mapping for the PDP, represented by question 1 with average of 2.77, standard deviation of 0.99, and answer frequency of 70.2% in the alternative “apply sometimes” or “applied to most of the time ” it is the most used
tool in the sample. This is not a surprise, as this is
the lean tool considered more universal and popular. On the other hand, the improvement actions in the waste points indicated by mapping (question 2) and the value stream map after improvements (question 3) are less performed, indicating not full use of this tool.
Thus, it is observed that the surveyed companies
are migrating, initially, lean principles to the PDP, while the lean tools can also be migrated in a next step. Eventually, these companies may be using the classic and already consolidated tools in the PDP, as a design FMEA and DFX (Design for Environment, Manufacturing, Assembling, etc.), but targeted on a daily basis by lean principles.
The answers of the question 10 indicate that the
involvement of senior management in all stages of the PDP is perceived as strong in these companies, as indicated by the average of 3.85 and a frequency of 80.8% in the alternative “applies most of the time”or” always applies “.
The cluster analysis, presented in the following
section, will complement the analysis of the results, so that it is possible to obtain a more robust conclusion.
4.3 Cluster analysis
Statistical analysis of Cluster, made based on the application of the principles and lean practices in the sample of companies product development process is shown in Figure 1.
The analysis shows the formation of 6 clusters.
Graphic 4 illustrates the behavior of each cluster regarding the values assigned to each question.
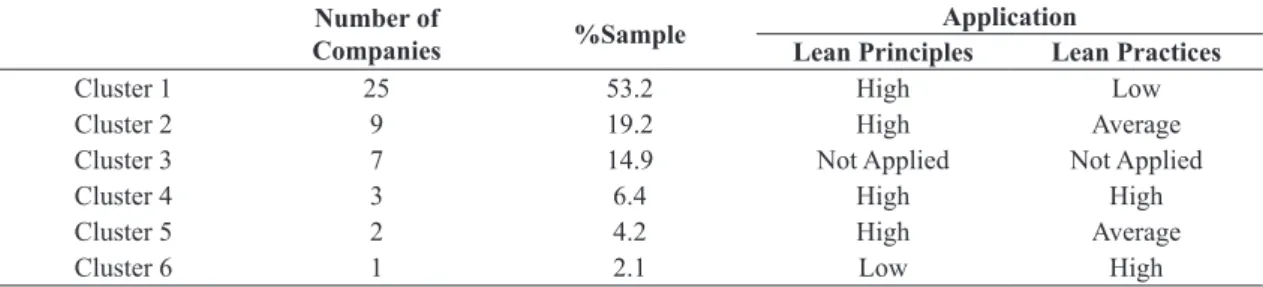
The largest cluster (cluster 1) represents 53.2% of the
sample, i.e. it is composed of 25 of the 47 companies in
the sample. This cluster is formed by companies from
all sectors of the sample and has a high application of lean principles and a low application of lean practices in the product development process.
The second largest cluster (cluster 2) is formed by 9 companies, or 19.2% of the sample. The feature of
this cluster is a high application of lean principles and an average application of lean practices of product development.
Cluster 3 is the third largest. It is represented by 7 companies, or 14.9% of the sample, which do not apply neither the principles nor the lean practices in the product development process.
The fourth largest cluster (cluster 4) has 3 companies in its composition, or 6.4% of the sample. This cluster
has high application of both concepts as lean practices of product development.
Cluster 5 represents 4.2% of the sample, or two companies, demonstrating average application of both principles and lean practices of product development in the PDP.
The cluster 6 is the smallest, consisting of only one
sample company, or 2.1% and has low implementation of the principles and high application of lean practices in the product development process.
Question
1 2 3 4 5
Average Standard Deviation Never
In minotity of times
Some times
Most of time Always Response Rate (%)
11
Are the people who acquire speciic technical
knowledge to develop a project allocated to the
development of new projects that use the same
knowledge?
2.1 4.3 25.5 44.7 23.4 3.83 0.91
12
Is the integration between the areas of manufacturing and product development high?
0.0 0.0 10.6 83.0 6.4 3.96 0.41
General Average 10.5 21.6 23.2 34.0 10.6 3.13 0.91
Source: Authors.
Table 3 shows the comparison of these results, showing the characterization of clusters for the application of the principles and lean practices in their PDP.
According to the Statistics area of literature, atypical observations should be considered not to introduce a bias in the estimation of data grouping
structure, or cluster (Hair et al., 2006). Therefore,
as the authors conclude, efforts should be made to examine whether the results can be generalized to the population of interest.
The results show that the percentage sum of
the samples of the clusters 4, 5 and 6 is of 12.7%.
This number is less than the sample percentage of
cluster 3 alone, which is of 14.9%. In order not to introduce a bias in the estimation of clusters, clusters 4, 5 and 6 were not considered for the analysis of the sample results.
Cluster 1 shows a high application of the principles and a low application of lean practices in the PDP
of the companies. This shows that more than half of
the companies surveyed could transfer to the product development process lean principles, arising from the LM. However, these companies are still not applying the lean product development practices, which are comprised in these research by the PDP’s value stream mapping, the visual management and SBCE.
Cluster 2 also shows that companies that have a high application of lean principles in the PDP, having managed to transfer those from the LM. However, they show an average application of lean practices in their product development processes. Once the cluster 2 is approximately 20% of the sample, these data show that few Brazilian companies are managing to apply, albeit moderately, the lean practices in the PDP. In fact, lean principles are part of the lean philosophy and, for companies that have the LM
deployed for more than ive years, it was expected
that such principles were already mature, which was evidenced by the results found in clusters 1 and 2, which together constitute 72.4% of the sample. On the
Figure 1. Cluster analysis based on the application of the
principles and lean practices in the PDP of the sample.
Graphic 4. Behavior of clusters regarding values assigned to each issue related to Lean Development in the respondent plant.
Table 3. Characterization of clusters regarding the application of the principles and lean practices in the their PDP.
Number of
Companies %Sample
Application
Lean Principles Lean Practices
Cluster 1 25 53.2 High Low
Cluster 2 9 19.2 High Average
Cluster 3 7 14.9 Not Applied Not Applied
Cluster 4 3 6.4 High High
Cluster 5 2 4.2 High Average
Cluster 6 1 2.1 Low High
other hand, the lean practices of product development go beyond the lean philosophy, according to Ward (2007), the development of lean product goes beyond the principles of LM and methods of conventional concurrent engineering. In fact, it is considered that
the SBCE is a signiicant barrier breaks on the way
of developing new products (Ward et al., 1995; Sobek et al., 1999).
Cluster 3 companies, or approximately 15% of the sample did not apply neither the principles nor the
lean practices in the PDP. This shows that although
these companies have the LM deployed for more
than ive years, they did not extend lean principles
learned to the PDP, either started the implementation of lean practices in it.
Graphic 5 shows the descriptive analysis of clusters according to the nationality of the companies
American and Brazilian companies are concentrated in clusters 1 and 2, i.e., 93.3% of American companies and 87.5% of the investigated Brazilian companies are present in these two clusters. European companies are basically distributed among the clusters 1, 2, 3 and 4 (40% in cluster 1, 15% in cluster 2, 20% in cluster 3 to 15% in cluster 4). Asian companies are distributed among the clusters 1, 2, 3 and 5 (25% in each). Once the clusters 1, 2 and 3 are those used for the analysis of the results, the descriptive analysis of the nationality of clusters shows a tendency that US and Brazilian companies, of the sample, are more advanced in the implementation of Lean Development than European
and Asian companies. This may be suggested as the
American and Brazilian companies are concentrated
in clusters 1 and 2, which are those with the Lean Development with a higher degree of application, when taking into account the clusters 1, 2 and 3.
5 Final considerations
Most of the companies of the sample (72.4%), represented by the sum of the clusters 1 and 2 seeks to use the lean development through the application of lean principles and practices in the product development process. About half of the companies of the sample (cluster 1: 52.3% of the sample) transferred lean principles learned from Lean Manufacturing for the PDP, but still failed to apply lean practices of product development. Only about 20% of companies (cluster 2) could, in addition to the principles also apply lean practices, albeit moderately.
Thus, both the descriptive analysis of the companies
surveyed as cluster analysis showed that most of the sample transferred lean principles from production to the PDP. Regarding tools and lean practices, they are transferred to a lesser extent.
On the other hand, the cluster analysis showed that approximately 15% of the companies of the sample did not transfer to the PDP nor the principles and nor
the lean practices learned from the LM. This allows
question whether these companies have actually learned the Lean approach, with its principles, practices, and understood the importance for consolidation, to incorporate the principles and practices in the PDP. It is true that one of the lean practices, SBCE, is an innovative way to develop new products, which goes
against common sense in the area, which requires more knowledge and experience of the project team, which hinders the implementation of this practice and requires greater maturity of the PDP.
It is recommended to identify and analyze the reasons why the number of companies not to extend the principles and lean practices learned in the LM for the product development process. It is possible that some companies are not yet aware of the possibility of transferring the LM concepts to other areas of the company. In addition, some companies may consider having the LM deployed in production, without having it in fact. Apply some concepts and tools alone does not mean, in fact, to have the Lean
Manufacturing implemented and to obtain suficient
knowledge and belief to extend its application in the production chain.
Also, the cultural issue of some companies, as well
as speciic product development subculture which in
some cases can prioritize the convenience of viewing little standardization and greater degrees of freedom in the conduct of PDP activities, can interfere in this transfer process learning. It is common, e.g., the
view that the dynamism and creativity of speciic
PDPs are inconsistent with concepts and practices of standardization and continuous improvement. Another hypothesis is that companies can not be managed applying the LM concepts successfully and therefore, can not see gains in applying them in other areas. Either way, a study to clarify this question is quite relevant.
It was also noted that in Brazil, the US and Brazilian companies of the sample, apply in a greater degree Lean Development comparatively to European and Asian companies.
The main limitation of this study refers to the
number of companies surveyed, once the sample is of 47 units less than the number considered appropriate by the literature. Hair et al. (2006) proposed that the multivariate techniques are performed with samples above 50 observations. However, if taken into account
the size of the population identiied and accessed,
which is of 73 companies, the sample obtained in 47 companies is of 64.4% of the population, which represents a very considerable number.
A possibility of continuing the research is to review the questionnaire and seek ways to achieve
a signiicantly larger sample of companies.
The results presented in this study are a rich source
of data for the beginning of understanding the current
situation of LD in Brazilian companies. The same can
be used as a starting point for further studies, such as case studies or action research that approach not only
a practice or a lean principle speciically, but, the set
of practices and lean principles so that the LD can be, indeed, evaluated and understood as a whole. A better understanding of this phenomenon may contribute
to the deinition of practices and guidelines, from
an academic and business consulting point of view that can contribute to better implementation and
overcoming dificulties in the use of LD.
References
Cusumano, M. A., & Nobeoka, K. (1998). Thinking beyond lean: how multi-project management is transforming product development at Toyota and others companies. New York: FreePass. 248 p.
Dal Forno, A. J., & Forcellini, F. A. (2012). Lean product development: principles and practices. Product: Management & Development, 10(2), 131-143. http:// dx.doi.org/10.4322/pmd.2013.007.
Dal Forno, A. J., Barquet, A. P. B., Buson, M. A., & Ferreira, M. G. G. (2008). Gestão de desenvolvimento de produtos: integrando a abordagem Lean no projeto conceitual. Gestão da Produção, Operação e Sistemas, 3(4), 45-58.
Forza, C. (2002). Survey research in operations management: a process-based perspective. International Journal of Operations & Production Management, 22(2), 152-194. http://dx.doi.org/10.1108/01443570210414310.
Hair, J. F., Jr, Black, B., Babin, B., Anderson, R., & Tatham, R. (2006). Multivariate data analysis. 6th ed. Upper Saddle River: Prentice-Hall.
Hines, P., Francis, M., & Found, P. (2006). Towards lean product lifecycle management: a framework for new product development. Journal of Manufacturing Technology Management, 17(7), 866-887. http://dx.doi. org/10.1108/17410380610688214.
Karlsson, C., & Ålhström, P. (1996). The difficult path to lean product development. Journal of Product Innovation Management, 13(4), 283-295. http://dx.doi.org/10.1016/ S0737-6782(96)00033-1.
Kennedy, M. N. (2003). Product development for the lean enterprise. Richmond: Oaklea Press.
Kristofferson, A., & Lindeberg, C. (2006). Lean product development in swedish industry (Master’s thesis). School of Economics, Stockholm.
Liker, J. (2004). The Toyota Way: 14 management principles from the world’s greatest Manufacturer. New York: McGraw-Hill.
Liker, J., & Morgan, J. (2006). The Toyota product development system: integrating people, process and technology. New York: Productive Press.
Locher, D. A. (2008). Value Stream Mapping for Lean Development: a how-to guide for streamlining time to market. Estados Unidos: CRC Press.
Mascitelli, R. (2004). The lean design guidebook: everything your product development team needs to slash manufacturing cost. Northridge: Technology Perpectives.
McManus, H. L. (2005). Product development value stream analysis and mapping manual (PDVSM). Cambridge: The Lean Aerospace Initiative, Center for Technology, Policy, and Industrial Development, Massachusetts Institute of Technology. 116 p.
Meiling, J., Backlund, F., & Johnsson, H. (2012). Managing for continuous improvement in off-site construction: evaluation of lean management principles. Engineering, Construction, and Architectural Management, 19(2), 141-158. http://dx.doi.org/10.1108/09699981211206089.
Morgan, J. M. (2002). High performance product development: a systems approach to a lean product development process (Doctoral thesis). The University of Michigan, Michigan.
Morgan, J., & Liker, J. K. (2006). Toyota’s product development system: integrating people, process and technology. New York: Productivity Press.
Oppenheim, B. W. (2004). Lean product development flow. Systems Engineering, 7(4), 352-376. http://dx.doi. org/10.1002/sys.20014.
Pessôa, M. V. P., Loureiro, G., & Alves, J. M. (2008). A method to lean product development planning. Product: Management & Development, 6(2), 143-155.
Possamai, O., & Ceryno, P. S. (2008). Lean approach applied to product development. Product: Management & Development, 6(2), 157-165.
Rahman, S., Laosirihongthong, T., & Sohal, A. S. (2010). Impact of lean strategy on operational performance: a study of Thai manufacturing companies. Journal of Manufacturing Technology Management, 21(7), 839-852. http://dx.doi.org/10.1108/17410381011077946.
Reinertsen, D. (2005). Let It flow: how lean product development sparked a revolution. Industrial Engineering, 37(6), 40-45.
Salgado, E. G., Mello, C. H. P., Silva, C. E. S., Oliveira, E. S., & Almeida, D. A. (2009). Análise da aplicação do mapeamento do fluxo de valor na identificação de desperdícios do processo de desenvolvimento de
produtos. Gestão & Produção, 16(3), 344-356. http:// dx.doi.org/10.1590/S0104-530X2009000300003.
Sánchez, A. M., & Pérez, M. P. (2001). Lean indicators and manufacturing strategies. International Journal of Operations & Production Management, 21(11), 1433-1451. http://dx.doi.org/10.1108/01443570110407436.
Schäfer, H., & Sorensen, D. J. (2010). Creating options while designing prototypes: value management in the automobile industry. Journal of Manufacturing Technology Management, 21(6), 721-742. http://dx.doi. org/10.1108/17410381011064012.
Sobek, D. K., Ward, A. C., & Liker, J. K. (1999). Toyota’s principles of set-based concurrent engineering. Sloan Management Review, 40(2), 67-83.
Sousa Mendes, G. H., & Toledo, J. C. (2015). Organizational characteristics in concurrent engineering: Evidence from Brazilian small and medium enterprises in the medical device industry. Concurrent Engineering, Research and Applications, 23(2), 135-144. http:// dx.doi.org/10.1177/1063293X15569512.
Toledo, J. C., Silva, S. L., Mendes, G. H. S., & Jugend, D. (2008). Fatores críticos de sucesso no gerenciamento de projetos de desenvolvimento de produto em empresas de base tecnológica de pequeno e médio porte. Gestão & Produção, 15(1), 117-134. http://dx.doi.org/10.1590/ S0104-530X2008000100011.
Veiga, G. L., Lima, E. P., Angelis, J. J., & Costa, S. E. G. (2011). The strategic role of lean a discussion. Brazilian Journal of Operations & Production Management, 8(1), 9-30.
Ward, A. C. (2007). Lean product and process development. Cambridge: The Lean Enterprise Institute. 208 p. Ward, A. C., Liker, J. K., Cristiano, J. J., & Sobek Ii, D.
K. (1995). The second Toyota paradox: how delaying decisions can make better cars faster. Sloan Management Review, 36(3), 43-61.
Womack, J. P., & Jones, D. T. (1996). Lean thinking: banish waste and create wealth in your corporation. New York: Simon & Schuster.