*e-mail: [email protected]
1. Introduction
Semiconducting conjugated polymers have drawn much attention due to their unique electrical and optical properties, reasonable chemical stability, and easy processability1. These unique properties of conjugated polymers enable the development of several electronic devices, such as Organic Light Emitting Diodes (OLEDs), photovoltaic cells, transistors, sensors and biosensors2–5. Among semiconducting polymers, polythiophene and its derivatives display thermal and environmental stability6. Since regioregular poly(3- hexylthiophene-2,5-diyl) was introduced7, regioregular polythiophenes have been investigated, concerning their role as an effective hole transferring semiconducting polymers. In the late 90’s, advances in the synthesis and assembly of other poly(3-alkyllthiophene-2,5-diyl) (P3AT) were reported8.
Polythiophene ilms can be fabricated by different methods9 for further optoelectronic applications. In this context, Langmuir-Blodgett (LB) is a technique that allows the fabrication of highly ordered thin ilms, which properties can be monitored at molecular level10,11. Two critical parameters that determine the electrical characteristics of polymer devices are their chemical composition and solid nanostructure12. The electrical properties of these materials are drastically altered due to electronic coupling between polymer chains, which is determined by the type of packing and conformation in the solid state12,13. Thus, the development of effective deposition methods that control material organization at nanoscale, e.g., the LB and the
layer-by-layer (LbL) techniques, is extremely important. Since polythiophenes exhibit low amphiphilicity, an amphiphilic long chain fatty acid (viz. Stearic Acid, SA) has been used to assist the formation of high quality polythiophene monolayer and multilayer LB ilms14-16.
The awareness of effects that contaminants indoor atmospheres can have in health has been increasing over the last 25 years. This has caused a development of international standards, which are concerned with indoor pollutants17. Thus, there is a need to develop electronic noses as devices for detection of gas and volatile organic compounds (VOCs), with low cost, portability, and operating at low power18. The regioregular polythiophenes are good alternatives for sensors fabrication in relation to other semiconducting polymers. This can be attributed to the way they organize, since small changes in conformational order and solid-state organization should cause significant changes in conductivity, promoting excellent sensitivity19.
In this paper, we report the fabrication of P3OT LB ilms by adding SA. Moreover, through optical and electrical characterization we analyzed the multilayer ilms. Finally, P3OT/SA LB films were tested toward the detection of VOCs showing good technological potential for the development of gas sensors.
2. Experimental
2.1. Materials
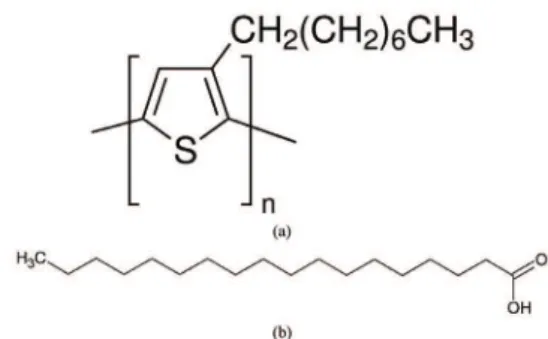
Regioregular poly(3-octylthiophene) (P3OT), with molecular weight of 25,000 g.mol–1 and regioregularity over 90% was used in this report. The repeat unit of P3OT
Poly(3-octylthiophene)/stearic Acid Langmuir and Langmuir-Blodgett Films:
Preparation and Characterization
Edilene Assunção da Silvaa*, Vinícius Jessé Rodrigues de Oliveiraa, Maria Luisa Braungera,
Carlos José Leopoldo Constantinoa, Clarissa de Almeida Olivatia
aFaculdade de Ciências e Tecnologia, Universidade Estadual Paulista – UNESP, CP 467,
CEP 19060-900, Presidente Prudente, SP, Brazil
Received: April 8, 2014 – Revised: November 30, 2014
A study is reported on Langmuir and Langmuir-Blodgett (LB) ilms obtained by adding different percentages of stearic acid (SA) to poly(3-octylhiophene) (P3OT). Surface pressure–mean molecular area (π–A) isotherms, ultraviolet-visible (UV-Vis) absorption spectrum, atomic force microscope (AFM) and dc electrical measurements have been used for characterization. From π–A isotherms, the area per monomer for condensed ilms (of SA) increased according to P3OT amount. Good transfer ratios were obtained for LB deposition from P3OT/SA ilms with higher percentage of SA. LB ilms revealed linear growth as monitored by UV-Vis absorption spectra. Electrical characterization showed higher conductivity for LB ilm with 54 wt.% of SA. AFM images of the same ilm revealed high roughness and presence of large size agglomerates. Finally, interdigitated electrodes (IDE) coated with P3OT/SA LB ilms showed to be sensitive to the presence of volatile organic compounds.
molecule structure is shown in Figure 1a. Both, P3OT and SA (Figure 1b) were purchased from Sigma-Aldrich and used as received. Chloroform was purchased from Synth, and dichloromethane, tetrahydrofurane (THF), toluene were purchased from Vetec. Brazilian Synchrotron Light Laboratory provided golden interdigitated electrode (IDE) in glass substrate fabricated by photolithography, with 25 pairs of digits, 100 nm height, 8 mm length, 100 μm width and 100 μm separation. BK7 glass slides were left over HMDS (hexamethyldisilazane) vapor in order to create a hydrophobic surface.
2.2. Langmuir and LB ilms
Surface pressure vs. mean molecular area (π-A) isotherms of neat P3OT and P3OT/SA mixtures were obtained using a KSV 5000 Langmuir trough. Different weight percentages of SA were used to prepare mixed LB ilms. The percentage of the irst fabricated ilm was 74 wt.%., and then decreased this percentage (54, 34 and 14 wt.%), keeping the solution concentration at 0.38 mg/mL in chloroform, in order to analyze the inluence of SA addition to obtain high quality LB ilms20. The Langmuir ilms were obtained by spreading a 250 μl solution of P3OT and P3OT/SA dissolved in chloroform onto ultrapure water (supplied by a Millipore system, resistivity 18.5 MΩ∙cm). A period of 15 min was allowed for the evaporation of solvent before starting compression. The π-A isotherms of P3OT/ SA were recorded at a barrier compression of 15 cm2/min and at 22 °C. For electrical characterization, 25 monolayers were transferred onto IDE coated glass substrates, by vertical dipping and for comparison by horizontal lifting (Langmuir-Schaefer - LS) methods. For optical characterization, Langmuir ilms were deposited onto hydrophobic glass substrates. LB ilms were transferred with surface pressure (corresponding to the condensed phase of Langmuir ilms), dipping speed and transfer ratio (TR) for downstrokes and upstrokes presented in Table 1. Good transfer ratios were obtained for LB deposition from P3OT/SA ilms with 74, 54 and 34 wt.% SA, resulting in high quality and uniform ilms. While for the other ilms (14 and 0 wt.%) was not possible to grow LB ilms.
2.3. Instrumentation and characterization
UV-Vis absorption spectra were obtained by Varian Cary 50 spectrophotometer. Concerning morphology, atomic force microscopy (AFM) studies of LB and LS P3OT/ SA ilms were carried out in an area of 30x30 μm2 using contacting mode in Nanosurf microscope, model EasyScan
2. Direct current (dc) electrical characterization of ilms was performed using Keithley 238 source measure unit. Current
vs. voltage (I vs. V) curves were obtained to analyze samples reproducibility, to evaluate ilms conductivities, and to make a comparison among the fabricated ilms.
2.4. VOCs sensors
The electrical responses of P3OT/SA LB ilms upon VOCs exposure (dichloromethane, THF and toluene) were carried out using dc measurements (I vs. t), with ixed applied voltage (5V). The sensors were assayed in a homemade test chamber in the presence of VOCs in dynamic low, dragged by nitrogen. The low was kept constant at 60NL/h (NL is a unit of mass for gases equal to the mass of 1L at a pressure of 1atm and at a standard temperature) during all the experiments, as veriied by the low meter. For the baseline, devices were left in the presence of nitrogen lux by 15 minutes, after that the VOC is carried by the nitrogen for another 15 minutes, then returning to baseline. Therefore, the response can be seen as the current changes according to the VOCs presence. Prior to data acquisition, the sensing units were left under pure nitrogen low for 30 min in the chamber to reach a stable reading.
3. Results and Discussion
3.1. π-A isotherms
The π-A isotherms of P3OT (neat and mixed with different SA wt%) are shown in Figure 2. It is possible to observe a transition in the liquid phase, indicating a molecular reorganization of the monolayer. Regarding polythiophenes, if thiophene rings are oriented in parallel to water surface, the area per repeat unit would be around 28 Å2,21. While their expected area, according to Corey– Pauling–Koltum (CPK) model, is 14.7 Å2, if the thiophene rings are oriented perpendicular to the water surface, with the backbones along the surface21,22. However, the area
Table 1. P3OT LB ilms deposition parameters.
Wt.%ofSA 74 54 34
Deposition surface pressure (mN/m) 30 30 35
Speedupstroke (mm/min) 10 9 0.7
SpeedDownstroke (mm/min) 10 7 0.5
Averagetransferratio 0.9 0.9 0.7
per repeat unit of neat P3OT found is about 5.4 Å2. This is an indication that P3OT did not form a true monolayer, with the polymer forming aggregated and/or being coiled during the compression, in a way that only part of repeat units of main chain is in contact with water surface, due to its rigidity. For instance, the stacking forming bilayers for Langmuir monolayers of polymers has been reported16,23. Therefore, it was not possible to fabricate good quality LB ilms of neat P3OT. From the displayed π-A isotherms of the P3OT/SA mixtures, as has already been observed for regioregular P3ATs14,24, the mean molecular area increases with the increase of P3OT content, and so does the surface pressure. According to previous reports, SA molecules should have mean molecular area of 22 Å2,25 at a surface pressure of 50 mN/m. The P3OT/SA ilms with higher SA percentages (74 and 54 wt.%) revealed an area per repeat unit close to SA area. Thus, it seems that SA molecules are oriented perpendicular to water surface and they work as a matrix in which P3OT is lying down, forming aggregated islands on the SA ilm. Langmuir ilm with 34 wt.% SA showed an area about 34 Å2, leaving 12 Å2 for P3OT. This indicates that thiophene rings are perpendicular to the water surface and located on the side of SA molecules. The lowest SA percentage (14 wt.%) presents area of 49 Å2, remaining 27 Å2 to the polymer. In this case, it seems that P3OT probably is oriented parallel to water surface.
3.2. UV-Vis absorption
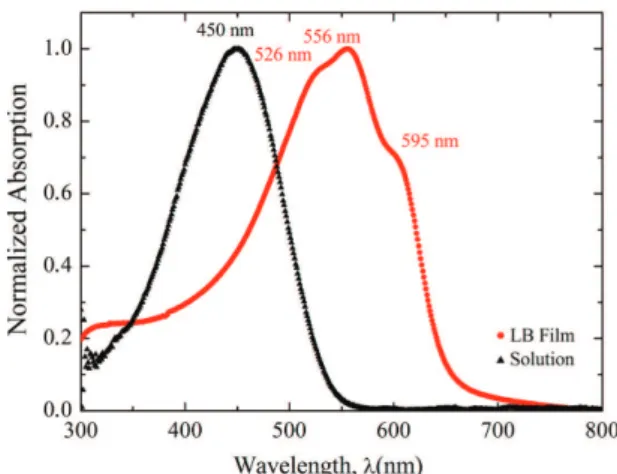
The degree of intra and interchain ordering in solutions, in LB and LS films of neat and mixed P3OT, can be examined from their optical absorption spectra. UV–Vis spectra of P3OT/54SA in chloroform and LB ilm are shown in Figure 3. For the solution spectrum, it is possible to observe an absorption band centered at about 450 nm, which is attributed to π-π* transition26. LB ilm presents an organized structure, since ilms of high ordering display a red-shifted π-π* absorption band with more pronounced vibrational structure. This structure also shows the presence of longer conjugation lengths, which are supported by the literature27,28. The λ
max for the main peaks of mixed LB ilms (74, 54 and 34 wt.% SA) are shown in Table 2. The UV-Vis spectrum of P3OT/74SA LB ilm presents the lowest red-shift when compared to the other LB ilm spectra, consistent with the shorter conjugation due to the higher amount of SA.
The UV–Vis absorption measurement is usually used to verify the reproducibility of the transfer process29. In Figure 4, it is possible to observe the absorbance spectra of mixed LB ilms according to the number of layers deposited onto BK7 glasses. This growth was found to be practically linear, corroborating with the uniformity of the LB ilms deposited onto the substrate.
3.3. Dc electrical characterization
Figure 5 shows electrical characteristics (I vs. V) of mixed P3OT/SA LB and LS ilms onto IDE substrates. It is possible to observe that the curves present an ohmic
Table 2. Wavelength for bands and shoulder for P3OT/SA Lb ilms with 11 layers.
P3OT/SA Band 1 λ(nm) Band 2 λmáx(nm) shoulder λ(nm)
P3OT/74SA 523 554 593
P3OT/54SA 526 556 595
P3OT/34SA 526 556 596
Figure 3. UV–vis absorption spectra of P3OT/54SA solution and LB ilm (11 layers).
Figure 4. Absorbance spectra of P3OT/54SA LB ilms. Inset: the
relationship between the absorbance (556 nm) and the number of transferred layers.
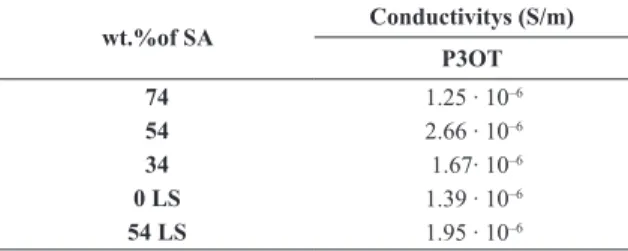
behavior, which was expected due to the parallel contact Au/P3OTilm/Au, causing the absence of a potential barrier. Thereby, the resistance, R, can be estimated from the I vs. V measurements carried out on IDE. This quantity is calculated by the data linear it (, once the slope is the inverse of R. The conductivity, σ, is the inverse of resistivity, ρ, which can be found through the relation , where L is the conductor length and A the cross section area. Thus, Olthuis et al.30 developed a method of obtaining the conductivity from IDE devices. It was introduced the cell constant, which is equivalent to L/A ratio. The cell constant, κ, is determined by the sensor geometry, and takes into account number, length, spacing and height of digits, considering the dimension of IDE. The cell constant for this study was established to be 5.1 m–1. Table 3 presents dc electrical conductivity, σdc, values determined for the P3OT ilms. It is possible to observe that σdc presents maximum value for LB ilm with 54 wt.% SA, showing how the amount of SA inluences on the conductivity. As sake of comparison, the electrical results of neat P3OT LS ilm are presented. Therefore, there
is an optimum result, since the insulating behavior of SA31 may be interfering in one of the cases (74wt.%), and ilm quality and organization are compromised because there is not SA enough to enhance LB deposition (34 wt.%). Then, for comparison with these results, LS ilms were prepared of neat and P3OT/SA (54 wt.%), in order to investigate the inluence of the deposition technique on the results. The σdc of neat P3OT LS is similar to P3OT/SA(74 wt.%) and the σdc of P3OT/SA(54 wt.%) LS is lower than P3OT/SA(54 wt.%) LB ilm. These outcomes demonstrate that LB ilm ordered structure is responsible for the improvement on conductivity. Kumar et al.32 found a σ
dc of 1.1 × 10
-6 S∙m-1 for neat P3OT
deposited by spin-coating technique onto gold electrodes evaporated on both sides, forming a diode-like structure (Au/P3OT/Au), and conductivity of 8.2 × 10⁻⁴ S∙m−1 when doped. Most results of literature presents electrical measurements for doped polythiophene ilms33,34, which extensively increases the conductivity.
3.4. AFM morphology
To support the electrical outcomes, AFM measurements in contacting mode were performed on LB and LS ilms with 54 wt.%, since they revealed higher σdc values. This characterization is important to observe the morphology signiicance on the results, and evaluate the topographic feature of the P3OT/54SA ilms at the molecular level. It is noteworthy the homogeneity of IDE substrate that revealed root mean square (rms) roughness of 2.8 nm. AFM topographic images of 30×30 μm2 for P3OT/54SA ilms are displayed in Figure 6. In LB ilm image (Figure 6a) it is possible to observe the presence of agglomerates with Table 3. Electrical conductivities for LB and LS ilms with diferent
Stearic Acid Percentages.
wt.%of SA Conductivitys (S/m) P3OT
74 1.25 ∙ 10–6
54 2.66 ∙ 10–6
34 1.67∙ 10–6
0 LS 1.39 ∙ 10–6
54 LS 1.95 ∙ 10–6
large size and the roughness found for this ilm revealed a high value (143 nm). LS ilm image (Figure 6b) also shows the presence of agglomerates, however, they seem to be smaller and in greater amount, the roughness obtained exhibited considerable decrease (80.3 nm) when compared to the LB ilm. These images support the existence of P3OT aggregated islands on top of a SA Langmuir ilm. Thus, it seems that higher roughness lead to higher conductivity values, corroborating previous work35.
3.5. VOCs sensors
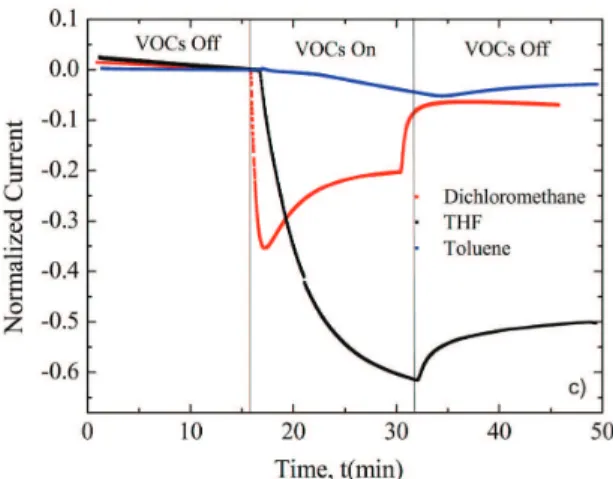
Normalized current changes for P3OT/54SA sensors upon exposure to different VOCs are shown in Figure 7. The ilms with other percentages presented similar results, changing only intensities. As shown by Arshak et al.36 through normalization, it is possible to analyze and compare data with different initial currents. Thus, normalizations were carried out using the sensor current immediately before the passage of VOCs (t ~15 min). For all vapors tested, the sensors response to VOCs was almost immediate and it was obtained a negative response, demonstrating that polythiophene ilms conductivity decreases in the presence of VOCs, as conirmed by previous studies19,37. THF vapor showed the maximum response, while dichloromethane vapor presented an intermediary response, but its current starts increasing before turning-off the vapor. Toluene, non-polar and weak solvent for P3OT, showed the minimum response. The sensor currents did not return to the initial value after the passage of VOCs, even being in the presence of only nitrogen for 15 minutes. THF sensor shows the less reversible process among the three VOCs. On the other hand, dichloromethane sensor process is almost entirely reversible. The negative behavior can be attributed to the swelling of polymer chains, which is coherent due to the fact tested VOCs are P3OT solvents. The presence of analyte molecules among polymeric chains are capable of modifying π-π* interactions among the molecules of conjugated Figure 7. Normalized current responses for the different analytes
tested as function of time.
polymers. These interactions occur due to the aggregation phenomenon, tendency of conjugated chromophores remain together in solution and especially in ilm form38. This swelling may increase the distance between polymer chains, and therefore, decrease the hopping conduction. This process can induce a conformational change in polymer chains and in some cases cannot be fully reversed with the presence of only nitrogen low. To summarize, once THF is a polar analyte and a strong P3OT solvent, it can penetrate the ilm and expand the space between polymeric chains, decreasing the conductivity, and show a higher response.
Aiming test sensors selectivity, one P3OT/54SA LB ilm was exposed to each of the three VOCs individually, in order to analyze if after detecting one of the vapors, the sensor could still detect the others, and if it does, verify a possible modiication caused by this process. For the selectivity test it was used all the possible sequences of the VOCs to check eventual changes in the sensor response. From the results, it could be noticed that sensors can detect one VOC, even after have detected others before and showing the same behavior previously presented. Hence, the P3OT/54SA sensor exhibited vapor selectivity for the tested VOCs. Some further tests were performed in order to verify the capacity of the sensors response to the VOCs after the irst exposure.
Figure 8 shows the results for the P3OT/54SA sensor under THF, toluene or dichloromethane VOCs. Despite the lack of full recovery, the sensors have sensitivity to a new passage of vapor. It is probably related to the fact that sensitive areas were not be completely inactivated, but decreased with the continued exposure to VOCs.
4. Conclusions
It was possible to fabricate a good quality of P3OT/ SA LB ilms, which was also very reproducible. These LB ilms revealed higher dc conductivity values than LS ilms, showing that the organization and roughness are more favorable for the electrical properties. Among LB ilms, P3OT/SA with 54wt.% SA showed the best result due to the optimization between the quality of deposition and the semiconducting characteristics of P3OT, according to SA percentage. The P3OT/SA ilms demonstrated promising results for their use as VOCs sensors.
Acknowledgments
The authors are grateful for the inancial support of CAPES, FAPESP, CNPq, INEO and LNLS (Brazil) for providing interdigitated electrodes (project LMF 16557).
References
1. Wan M. Conducting polymers with micro or nanometer structure. Tsinghua University Press; 2008. http://dx.doi.
org/10.1007/978-3-540-69323-9
2. Malliaras G and Friend R. An Organic Electronics
Primer. Physics Today. 2005; 58(5):53-58. http://dx.doi. org/10.1063/1.1995748.
3. Soylemez S, Ekiz Kanik F, Ileri M, Hacioglu SO and Toppare
L. Development of a novel biosensor based on a conducting polymer. Talanta. 2014; 118:84-89. http://dx.doi.org/10.1016/j.
talanta.2013.10.007. PMid:24274273
4. Hsu Y-C, Tseng L-C and Lee R-H. Graphene oxide
sheet-polyaniline nanohybrids for enhanced photovoltaic performance of dye-sensitized solar cells. Journal of Polymer Science. Part B, Polymer Physics. 2014; 52(4):321-332. http:// dx.doi.org/10.1002/polb.23416.
5. Gentile F, Coppedè N, Tarabella G, Villani M, Calestani D, Candeloro P, et al. Microtexturing of the Conductive
PEDOT:PSS Polymer for Superhydrophobic Organic Electrochemical Transistors. BioMed Research International.
2014; 2014:1-10. http://dx.doi.org/10.1155/2014/302694.
6. Jen K-Y, Miller GG and Elsenbaumer RL. Highly conducting,
soluble, and environmentally-stable poly(3-alkylthiophenes).
Journal of the Chemical Society. Chemical Communications. 1986; 5(17):1346-1347.
7. Chen TA and Rieke R. The first regioregular head-to-tail poly(3-hexylthiophene-2,5-diyl) and a regiorandom isopolymer: nickel versus palladium catalysis of 2(5)-bromo-5(2)-(bromozincio)-3-hexylthiophene polymerization. Journal of the American
Chemical Society. 1992; 114(25):10087-10088. http://dx.doi. org/10.1021/ja00051a066.
8. Chittibabu KG, Li L, Kamath M, Kumar J and Tripathy SK.
Synthesis and properties of a novel polythiophene derivative with a side-chain NLO chromophore. Chemistry of Materials. 1994; 6(4):475-480. http://dx.doi.org/10.1021/cm00040a023.
9. Niu JZ, Cheng G, Li Z, Wang H, Lou S, Du Z, et al. Poly
(3-dodecylthiophene) Langmuir–Blodgett films: Preparation and characterization. Colloids and Surfaces A: Physicochemical
and Engineering Aspects. 2008; 330(1):62-66. http://dx.doi. org/10.1016/j.colsurfa.2008.07.041.
10. Mattoso LHC, Ferreira M and Oliveira Junior ON. Filmes
Langmuir-Blodgett de polímeros condutores. Polímeros Ciência e Tecnologia. 1994:23-34.
11. Roberts G. Langmuir-Blodgett ilms. New York: Plenum Press; 1990.
12. Skotheim T and Reynolds J. Handbook of conducting polymers. Boca Raton: CRC Press; 2006.
13. McCullough RD, Tristram-Nagle S, Williams SP, Lowe RD and Jayaraman M. Self-orienting Head-to-Tail Poly
(3-alkylthiophenes): New Insights on Structure-Property Relationships in Conducting Polymers. Journal of the American Chemical Society. 1993; 115(11):4910-4911. http:// dx.doi.org/10.1021/ja00064a070.
14. Arslanov VV. Polymer monolayers and Langmuir– Blodgett films. Polythiophenes. Russian Chemical Reviews. 2000; 69(10):883-898. http://dx.doi.org/10.1070/ RC2000v069n10ABEH000612.
15. Sharma SK, Singhal R, Malhotra BD, Sehgal N and Kumar
A. Biosensor based on Langmuir-Blodgett films of poly(3-hexyl thiophene) for detection of galactose in human blood.
Biotechnology Letters. 2004; 26(8):645-647. http://dx.doi.
org/10.1023/B:BILE.0000023023.19651.01. PMid:15200174 16. Pawlicka A, Faria R, Yonashiro M, Canevarolo SV Jr and
Oliveira ON Jr. Effect of polymer molecular weight on Langmuir monolayers and the deposition of Langmuir-Blodgett films of poly (3-butylthiophene) and stearic acid.
Thin Solid Films. 1994; 244(1-2):723-727. http://dx.doi. org/10.1016/0040-6090(94)90558-4.
17. Brown VM and Crump DR. An investigation into the
used indoors. Analytical Methods. 2013; 5(11):2746-2756. http://dx.doi.org/10.1039/C3AY40224J
18. Gonçalves VC and Balogh DT. Optical VOCs detection using
poly(3-alkylthiophenes) with different side-chain lengths.
Sensors and Actuators. B, Chemical. 2009; 142(1):55-60. http:// dx.doi.org/10.1016/j.snb.2009.08.009.
19. McCullough RD, Sauve G, Li B, Jeffries-El M, Santhanam
S, Schultz L, et al. Regioregular Polythiophene Nanowires and Sensors. Proceedings of the Society for Photo-Instrumentation Engineers. 2005; 5940:1-7. http://dx.doi. org/10.1117/12.619609.
20. Singhal R, Chaubey A, Srikhirin T, Aphiwantrakul S, Pandey
SS and Malhotra BD. Immobilization of glucose oxidase
onto Langmuir–Blodgett films of poly-3-hexylthiophene.
Current Applied Physics. 2003; 3(2-3):275-279. http://dx.doi. org/10.1016/S1567-1739(02)00215-8.
21. Callender CL, Carere CA, Daoust G and Leclerc M.
Langmuir-Blodgett processing of poly(3,4-dibutoxythiophene). Thin Solid Films. 1991; 204(2):451-457. http://dx.doi.org/10.1016/0040-6090(91)90083-A.
22. Xu Y, Liu Y, Wu J and Zhu D. Preparation and electrical
conductivity of Langmuir–Blodgett films of poly(3-alkylthiophene)s. Journal of Applied Polymer Science. 1998; 69(1):1-6. http://dx.doi.org/10.1002/(SICI)1097-4628(19980705)69:1<1::AID-APP1>3.0.CO;2-N.
23. Nicholson PG, Ruiz V, Macpherson JV and Unwin PR. Effect
of composition on the conductivity and morphology of poly(3-hexylthiophene)/gold nanoparticle composite Langmuir-Schaeffer films. Physical Chemistry Chemical Physics. 2006; 8(43):5096-5105. http://dx.doi.org/10.1039/b605691c.
PMid:17091160
24. Rikukawa M, Nakagawa M, Ishida K, Abe H, Sanui K and
Ogata N. Electrical properties of conductive Langmuir-Blodgett films comprised of head-to-tail poly (3-hexylthiophene). Thin Solid Films. 1996; 284-285:636-639. http://dx.doi.org/10.1016/ S0040-6090(95)08409-6.
25. Ochiai K, Tabuchi Y, Rikukawa M, Sanui K and Ogata N. Fabrication of chiral poly(thiophene) Langmuir–Blodgett
films. Thin Solid Films. 1998; 327-329:454-457. http://dx.doi. org/10.1016/S0040-6090(98)00685-3.
26. Pavia D, Lampman GM, Kriz GS and Vyvyan JR. Introduction to spectroscopy. Belmont: Brook/Scole; 2009.
27. Motaung DE, Malgas GF, Arendse CJ, Mavundla SE and Knoesen D. Structural and photo-physical properties of
spin-coated poly(3-hexylthiophene) thin films. Materials Chemistry and Physics. 2009; 116(1):279-283. http://dx.doi.org/10.1016/j. matchemphys.2009.03.028.
28. McCullough R, Lowe R, Jayaraman M and Anderson DL. Design,
synthesis, and control of conducting polymer architectures: structurally homogeneous poly (3-alkylthiophenes). The Journal of Organic Chemistry. 1993; 58(4):904-912. http:// dx.doi.org/10.1021/jo00056a024.
29. Olivati CA, Ferreira M, Cazati T, Balogh DT, Guimarães FEG,
Oliveira ON Jr, et al. Anisotropy in the optical properties of oriented Langmuir–Blodgett films of OC1OC6-PPV. Chemical Physics Letters. 2003; 381(3-4):404-409. http://dx.doi. org/10.1016/j.cplett.2003.10.010.
30. Olthuis W, Streekstra W and Bergveld P. Theoretical and
experimental determination of cell constants of planar-interdigitated electrolyte conductivity sensors. Sensors and Actuators. B: Chemical. 1995; 24(1-3):252-256. http://dx.doi. org/10.1016/0925-4005(95)85053-8.
31. Spohner MA. Study of the properties of electrical insulation
oils and of the components of natural oils. Acta Polytechnica. 2012; 52:100-105.
32. Kumar J, Singh RK, Chand S, Kumar V, Rastogi RC and Singh R. Dc Electrical Conduction and Morphology of Poly(3-Octylthiophene) Films. Journal of Physics D: Applied Physics. 2006; 39(1):196-202. http://dx.doi.org/10.1088/0022-3727/39/1/029.
33. Singh RK, Kumar J, Singh R, Kant R, Chand S and Kumar V. Micromorphology, photophysical and electrical properties
of pristine and ferric chloride doped poly(3-hexylthiophene) films. Materials Chemistry and Physics. 2007; 104(2-3):390-396. http://dx.doi.org/10.1016/j.matchemphys.2007.01.024.
34. Kelkar D and Chourasia A. Electrical and Magnetic Conduction Properties of Polythiophene Doped with FeCl 3. Materials Chemistry and Physics. 2013; 327(1):45-53.
35. Ferreira M, Constantino CJL, Olivati CA, Vega ML, Balogh DT, Aroca RF, et al. Langmuir and Langmuir-Blodgett Films
of Poly [2-methoxy-5-(n-hexyloxy)-p-phenylenevinylene].
Langmuir. 2003; 19(21):8835-8842. http://dx.doi.org/10.1021/ la0346595.
36. Arshak K, Moore E, Lyons GM, Harris J and Clifford
S. A review of gas sensors employed in electronic nose applications. Sensor Review. 2004; 24(2):181-198. http:// dx.doi.org/10.1108/02602280410525977.
37. Gonçalves VC, Nunes BM, Balogh DT and Olivati C.
Detection of volatile organic compounds using a polythiophene derivative. Physica Status Solidi. 2010; 207(7):1756-1759. http://dx.doi.org/10.1002/pssa.200983723.