*e-mail: [email protected]
1. Introduction
Plasma nitriding of stainless steels improves some of their tribological properties1-5 as a result of the nitrided layer, which is formed on the surface, whose properties depend strongly on the conditions used in the process, such as gas composition and pressure, temperature and time. If the temperature is lower than 450 °C, an expanded austenite phase (gN), which presents a large nitrogen concentration, is formed. This layer shows higher hardness and higher pitting corrosion resistance in comparison with the untreated austenite (g)[6-9].
Compared to g relections, gN peaks are broader and shifted to lower diffraction angles. The gN(200) positions are more deviated relatively to the g(200) diffraction angle than the other planes, demonstrating a deviation from the cubic fcc unit cell. The structure of this phase is still a matter of
controversy which has not yet been completely clariied10-15. Fewel et al.10 employed both Cu-Kα and Co-Kα radiations to measure X-ray Diffraction (XRD) patterns up to the (420)
relection for one selected nitrided sample. They analyzed the XRD patterns trying different structures, like tetragonal, monoclinic and triclinic, obtaining the best agreement of their data for the latter one. Particularly, it is a structure which presents a low symmetry, but they used to represent it as a fcc structure with distortion. To do this, the lattice parameters are equal and a distortion ε (in this paper η will be used for this distortion, not to be confused with ε phase).
This model was tested by Mingolo et al.14, who used Cu-Kα to measure a lower number of relections, up to (400). They studied the gN phase observed for the surface of two AISI 316L nitrided samples, describing it well by a triclinic structure, instead of tetragonal or monoclinic. In a more recent study of seven nitrided samples using synchrotron radiation diffraction, Fewell and Priest15 observed peaks up
to (622) relection. In their study, they tested a total of ten
plausible candidate structures in order to propose a structure for this phase. They examined in details two of the seven samples and concluded that none of the candidate structures
work well at high order relections and each presents its particular dificulties at a lower order. However, they afirm
[…] the triclinic lattice has the 3 fewest deformation-split components of the candidate structures and generally the
highest multiplicity component of a relection correspond to
the measured position […]”15 prior to the (440) relections. For the current study, as the use of synchrotron radiation allows for both a higher intensity and a better resolution, it was
chosen for measuring XRD patterns up to the (222) relection,
from eight nitrided AISI 316L samples. The samples were nitrided at different conditions of time and temperature, and consequently, showed different properties, such as nitrogen concentration and nitrided layer thickness. In this study it was used a photon energy of 6.5 keV, whose XRD patterns were
itted using Fewell’s model. Moreover, to consider nitrogen
concentration gradient across the nitrided layer, each gN peak
Study of Expanded Austenite Formed in Plasma Nitrided AISI 316L Samples,
Using Synchrotron Radiation Diffraction
Marcelo Camposa,b*, Sylvio Dionysio de Souzaa,c, Luis Gallego Martinezd, Maristela Olzon- Dionysioa,c
aDepartamento de Física, Universidade Federal de São Carlos – UFSCar, São Carlos, SP, Brasil bEmbrapa Instrumentação, Empresa Brasileira de Pesquisa Agropecuária, São Carlos, SP, Brasil
cInstituto de Ciências e Tecnologia, Universidade Federal dos Vales do
Jequitinhonha e Mucuri – UFVJM, Diamantina, MG, Brasil
dCentro de Ciência e Tecnologia de Materiais, Instituto de Pesquisas Energéticas e Nucleares – IPEN,
São Paulo, SP, Brasil
Received: April 7, 2014; Revised: October 9, 2014
AISI 316L stainless steel samples nitrided at different conditions of temperature and time, showing different properties, such as nitrogen concentration (CN) and nitrided layer thickness, were studied. Expanded austenite (gN) diffraction peaks up to the (222) relection were observed using suitable
wavelength synchrotron radiation. XRD patterns were itted by Le Bail method, using a special triclinic
crystal structure (with a lattice distortion η) for gN, whose peaks were decomposed in a few subpeaks, to consider CN gradient across the nitrided layer. Our results indicate that regarding gN magnetic behavior, which was observed for the samples nitrided at 450 °C, it seems to be correlated not only to high CN
(≥31at.%), but also to higher η (≥2.4°), which reaches up to 5.6°. This distortion η decreases when CN increases, consequently, with its minimum close to the surface. On the other hand, for paramagnetic samples (350 °C), η increases up to 1.4° when CN increases up to 30 at.%.
was decomposed in a few subpeaks, following the proposal of Öztürk and Williamson16.
2. Material and Methods
Details of the preparation of the samples, which were
plasma nitrided using 80% H2-20% N2, at 6 Torr, for 3 and 5 h using different temperatures (350, 400 and 450 °C), have been given previously17, and the nitrided layer thickness (t) values are presented in Table 1. Here results for samples nitrided for 4h, using 400 and 450 °C are presented as well.
The phases formed on the nitrided samples were
characterized by XRD, performed at the Brazilian
Synchrotron Light Laboratory (LNLS), using synchrotron radiation (λ = 1.9074 Å or E = 6.5001 keV). The conditions were: θ-2θ geometry, at 0.2° steps, ranging from 47° ≤ 2θ ≤ 135°. A pyrolytic graphite analyzer and scintillation counter were used to obtain high signal to background with medium resolution.
In addition to the austenitic matrix and gN phase, the hexagonal ε (Fe2-3N) was used in the XRD pattern ittings and, when necessary, cubic g’(Fe4N) and trigonal Cr2N
phases were used as well. The Le Bail technique was used
to index the diffraction peaks in the experimental data18,19,
which were itted using GSAS software20 and EXPGUI graphical interface21.
For the gN phase, having special triclinic symmetry10,15, which presents a slight distortion (η) from fcc austenitic
substrate structure was used. Based on the results of Öztürk
and Williamson16, we concluded that the best model to adopt in gN phase ittings was to consider it as a solid solution with a sequence of layers showing different contents of nitrogen. Each layer corresponds to a different lattice parameter agN. The values for nitrogen concentration in each solid gN phases, CN, were calculated using Picard’s equation22
agN =ag + α CN (1)
where α is a constant. The literature indicates a range of values for this constant, which depends on the CN value16. The most commonly used (α = 0.0078 Å/at.% N) is known as Vegard´s constant14,23. Instead of this value, a different value is indicated, because the last one is used for low
nitrogen concentrations (0-10 at.%). The new value is16,24,
α = 0.00861 Å/at.% N, which was adopted in this work.
3. Results and Discussion
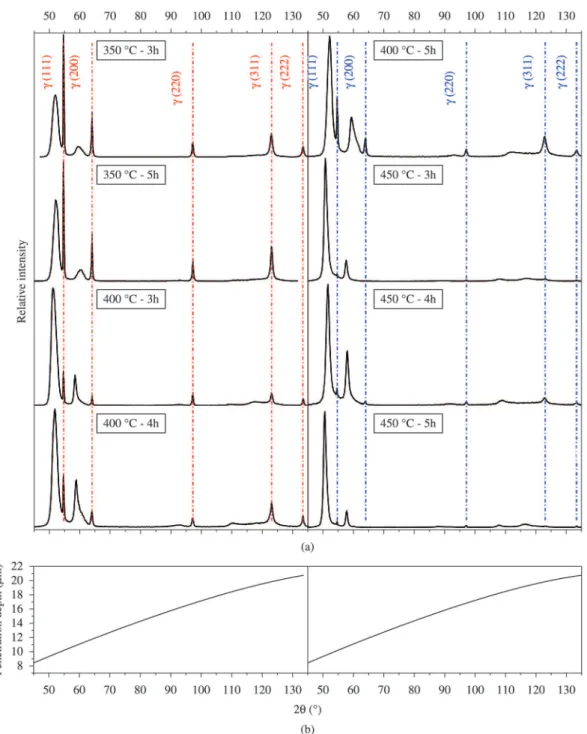
Figure 1a presents the measured XRD patterns. The vertical bars show the positions of the fcc austenite peaks, labeled g(hkl). All the XRD patterns show the expanded austenitic gN peaks, which are broader and shifted to lower diffraction angles, when compared to the correspondent austenite peaks. Figure 1b presents the penetration depth (d) of the synchrotron radiation.
The diffraction patterns presented in Figure 1 show a positive correlation between this penetration depth (d) of radiation and the nitrided layer thicknesses (t) (Table 1).
The g (111) relection whose d value (10.4 mm) is minimum, is observed for 350 and 400 °C, whose thickness is t< 10.4 mm. Moreover, the g(111) intensity decreases when t increases, and is signiicantly higher than that of gN(111) for 350 °C, 3h, whose t=0.7 mm. The intensity decreases
substantially at 400 °C (2.9 ≤ t ≤ 3.9 mm) and practically
disappears at 450 °C, with 7.6 ≤ t ≤ 11mm, i.e., t∼d. On the
other hand, if we analyze the relections of higher order, i.e.,
(311), where d∼20 mm, the g(311) intensity is comparable for 350 and 400 °C, which show t < d/7, but diminishes considerably at 450 °C, showing t∼d/2.
Figure 2 shows the itted diffraction lines (in red) on data points (black circles) for the samples nitrided for 3h. In
order to see details of all the relections on the XRD patterns,
Figures 3a, b and c present a zoomed image from the region between 80° and 135° of Figure 2, showing all the phases
which were used in the ittings. This region was selected because of the signiicative separation of the different gN
phases, which is not observed in (111) and (200) relections.
Figure 4 illustrates details of the subpeaks, which were used for considering nitrogen concentration gradient across the nitrided layer.
3.1 Samples nitrided at 350 °C
Whereas three different gN phases were used in ittings for the samples nitrided for 3h, four phases were used for 5h sample. The austenite (ag = 3.597 Å) and the ε phases
were used as well. The itted values for the gN phases are presented in Table 2.
3.2 Samples nitrided at 400 °C
Four different gN phases were used in the ittings for
the samples nitrided for 3h, while ive phases were used
for 4 and 5h samples. The austenite (ag = 3.597 Å) and the
ε phases were used, as well as for 350 °C. In Table 3 are
presented the itted values for the gN phases.
For both temperatures, an additional phase appears for
5h, compared to 3h. This phase represents 25% (or 1/4) and 20% (or 1/5) of the total number used for gN subphases, for 350 and 400 °C, respectively. This rise can be explained
by the increase of 23% and 21% (from 3 to 5h, for 350 and
400 °C, respectively) of nitrided layer thicknesses (t). This is because all the diffusion layers (and even the matrix) are certainly observed, as the x-ray penetration depth (d)
complies with the equation 3.0t ≤ d≤ 27t. In this equation, the minimum corresponds to (111) relection, for 400 °C,
5h and the maximum, to (222), for 350 °C, 3h. Moreover, as this additional phase presents lower N concentrations, it is located in the innermost layer, which is known as the diffusion layer.
Table 1. Thickness (t) of the samples’ nitrided layers17.
Temperature (°C) 350 400 450
Time (h) 3 5 3 4 5 3 4 5
Figure 1. (a) X-ray diffraction patterns of the samples nitrided at different temperatures and times and (b) Synchrotron radiation (6.5keV) penetration depth (d) as a function of the diffracted angle.
3.3 Samples nitrided at 450 °C
Four different gN phases were used in the ittings for the samples nitrided for all times: 3, 4 and 5h. In addition to the austenite (ag = 3.597 Å), ε and g’ phases, the Cr2N phase was used as well. Table 4 presents the itted values for the gN phases.
These samples differ from the 350 and 400 °C samples
in at least two different aspects. The irst one is the same
number of gN phases used in the ittings, for all times: 3, 4 and 5h. The second one is the gN phase concentration, whose
minimum value is 31 at.%. For these samples, the interval
that correlates t and d is 0.95t ≤ d≤ 2.7t; consequently, the observation of the diffusion layer may be much more
dificult. Another possible and more likely explanation is that the diffusion layer might be less signiicant, relatively
to 350 and 400 °C, as it decreases with the increasing the temperature, according to some authors25,26.
Figure 2. Fitted X-ray diffraction patterns for the samples nitrided for 3h at different temperatures.
Figure 3. Zoom of the region between (220) and (222) relections ofFigure 3, for (a) 350, (b) 400 and (c) 450 °C.
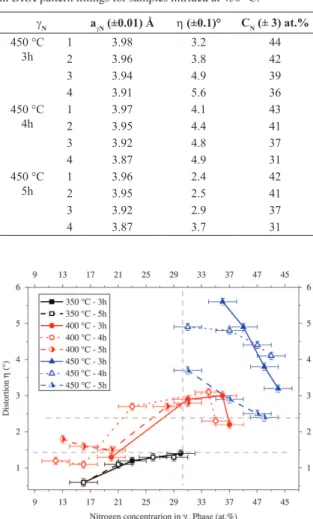
this phase is paramagnetic (or magnetic) when its CN is low (high)16. The Mössbauer Spectroscopy can show this behavior, and the results for all the samples will be presented in a future publication. If this is assumed, it is interesting to show that the lattice distortion η behavior in relation to CN depends on the magnetic character of the respective gN phase. To evidence this aspect, Figure 5 shows η values as a function of CN values, i.e., the fourth column as a function of the last column of Tables 2, 3 and 4.
This figure presents two very distinct regions: CN ≤ 30 at.% (which is marked in a vertical dotted line), showing η ≤ 1.4° (in a horizontal dotted line, below) and the second one, indicating CN ≥ 31 at.% and η ≥ 2.4° (in a horizontal dotted line, above), where the samples nitrided at 350 and 450 °C, respectively, can be observed and each one shows a typical behavior.
The paramagnetic gN phases in layers nitrided at 350 °C, for 3 and 5h, are very similar, showing a very high CN gradient (approximately 60 at.%) between the inner region and the surface. At the same time, the lattice distortion η increases when CN increases, and therefore it is higher near the surface, showing a slight variation, approximately 0.8°. On the other hand, the magnetic layers nitrided at 450 °C show a very different behavior: while the CN gradient between the inner region and the surface is
Table 2. Values for Lattice parameter (a), Distortion (η) and Nitrogen concentration (CN) for each sublayer of the gN phases used in DRX pattern ittings for samples nitrided at 350 °C.
gN agN (±0.01) Å η (±0.1)° CN (± 3) at.%
350 °C 3h
1 3.86 1.4 30
2 3.80 1.2 23
3 3.74 0.6 16
350 °C 5h
1 3.85 1.3 29
2 3.82 1.3 26
3 3.78 1.1 21
4 3.74 0.6 16
Table 3. Values for Lattice parameter (a), Distortion (η) and Nitrogen concentration (CN) for each sublayer of the gN phases used in DRX pattern ittings for samples nitrided at 400 °C.
gN agN (±0.01) Å η (±0.1)° CN (± 3) at.%
400 °C 3h
1 3.92 2.2 37
2 3.91 3.0 36
3 3.87 2.9 31
4 3.77 1.3 20
400 °C 4h
1 3.90 2.3 35
2 3.89 3.1 34
3 3.80 2.7 23
4 3.74 1.1 16
5 3.70 1.2 12
400 °C 5h
1 3.87 2.8 31
2 3.84 2.7 28
3 3.77 1.5 20
4 3.74 1.6 16
5 3.71 1.8 13
Table 4. Values for Lattice parameter (a), Distortion (η) and Nitrogen concentration (CN) for each sublayer of the gN phases used in DRX pattern ittings for samples nitrided at 450 °C.
gN agN (±0.01) Å η (±0.1)° CN (± 3) at.%
450 °C 3h
1 3.98 3.2 44
2 3.96 3.8 42
3 3.94 4.9 39
4 3.91 5.6 36
450 °C 4h
1 3.97 4.1 43
2 3.95 4.4 41
3 3.92 4.8 37
4 3.87 4.9 31
450 °C 5h
1 3.96 2.4 42
2 3.95 2.5 41
3 3.92 2.9 37
4 3.87 3.7 31
Figure 5. Lattice distortion as a function of nitrogen concentration for each sublayer of the gN phases used in DRX patterns ittings, for all the nitrided samples.
distortion η, which is maximum in the inner region, shows a variation between 1.3° and 2.4° for 5 and 3h, respectively. For 4h, while CN shows the highest interval, between 31
and 43 at.%, η shows a very smooth variation of 0.7°. Moreover, Williamson and Öztürk16 suggested that the magnetic gN phase is analogous to the fcc ordered g’-Fe4N, which has a more expanded fcc lattice compared with g-Fe and is ferromagnetic at room temperature. In this respect, our results seem to agree with their suggestion, because lattice distortion η decreases when CN increases, near the
surface, for 450 °C samples, indicating a higher symmetry for the subphase which is more magnetic. Therefore, our assumption seems to be correct.
Regarding the samples nitrided at 400 °C, they show magnetism and paramagnetism simultaneously9, and are magnetic near the surface and paramagnetic in the inner region, which can be observed in Figure 5. This igure indicates that the behavior of these samples is not uniform
as is for the samples nitrided at 350 and 450 °C. However,
the gN phases presenting CN in the same interval observed
for 350 °C samples, i.e., for 17 ≤ CN ≤ 30 at.%, show the same behavior observed for these samples. In other words, the lattice distortion η increases when CN increases, although
it increases to 3.0°, which is signiicantly higher than the
value observed for the 350 °C samples, i.e., 1.4°. On the other hand, for CN ≥ 31 at.%, for both 3 and 4h, for the most
supericial layer, η decreases to a value very close to 2.4°, which is the η reference value for the samples nitrided at 450 °C.
4. Conclusion
1) Regarding gN phases magnetic character, our results indicate that magnetic behavior, observed for the samples nitrided at 450 °C, seems to be correlated not only with high nitrogen concentration (CN ≥ 31 at.%), but also with high lattice distortion (η ≥ 2.4°), which reached up to 5.6°. Moreover, this distortion decreases when CN increases, consequently it has a minimum value at the surface.
2) On the other hand, for paramagnetic samples, nitrided at 350 °C, the lattice distortion η increases when CN
increases, up to 1.4° and 30 at.%, respectively. In this
case, it has a maximum at the surface.
3) As the sample set showed a big range of layer thickness, this property was correlated to X-ray depths
penetration from different relections of XRD patterns, showing signiicant positive correlation between both.
Acknowledgements
This work was partly supported by the Brazilian research
funding agencies FAPESP and CAPES. We gratefully acknowledge the National Laboratory of Light Synchrotron – LNLS, Brazil Grant No. XDR1/9101.
References
1. Williamson DL, Öztürk O, Wei R and Wilbur PJ. Metastable phase formation and enhanced diffusion in f.c.c. alloys under high dose, high flux nitrogen implantation at high and low ion energies. Surface and Coatings Technology. 1994; 65(1-3):15-23. http://dx.doi.org/10.1016/S0257-8972(94)80003-0. 2. Menthe E, Bulak A, Olfe J, Zimmermann A and Rie K-T.
Improvement of the mechanical properties of austenitic stainless steel after plasma nitriding. Surface and Coatings Technology. 2000; 133-134:259-263. http://dx.doi.org/10.1016/ S0257-8972(00)00930-0.
3. Liang W. Surface modification of AISI 304 austenitic stainless steel by plasma nitriding. Applied Surface Science. 2003; 211(1-4):308-314. http://dx.doi.org/10.1016/S0169-4332(03)00260-5.
4. Li G, Peng Q, Li C, Wang Y, Gao J, Chen S, et al. Effect of DC plasma nitriding temperature on microstructure and dry-sliding wear properties of 316L stainless steel. Surface and Coatings Technology. 2008; 202(12):2749-2754. http://dx.doi. org/10.1016/j.surfcoat.2007.10.002.
5. Xi Y, Liu D and Han D. Improvement of corrosion and wear resistances of AISI 420 martensitic stainless steel using plasma nitriding at low temperature. Surface and Coatings Technology. 2008; 202(12):2577-2583. http://dx.doi.org/10.1016/j. surfcoat.2007.09.036.
6. Olzon-Dionysio M, de Souza SD, Basso RLO and de Souza S. Application of Mössbauer spectroscopy to the study of corrosion resistance in NaCl solution of plasma nitrided AISI 316L stainless steel. Surface and Coatings Technology. 2008; 202(15):3607-3614. http://dx.doi.org/10.1016/j. surfcoat.2007.12.040.
7. Fossati A, Borgioli F, Galvanetto E and Bacci T. Corrosion resistance properties of glow-discharge nitrided AISI 316L austenitic stainless steel in NaCl solutions. Corrosion Science. 2006; 48(6):1513-1527. http://dx.doi.org/10.1016/j. corsci.2005.06.006.
8. Li CX and Bell T. Corrosion properties of active screen plasma nitrided 316 austenitic stainless steel. Corrosion Science. 2004; 46(6):1527-1547. http://dx.doi.org/10.1016/j. corsci.2003.09.015.
9. Campos M, de Souza SD, de Souza S and Olzon-Dionysio M. Improving the empirical model for plasma nitrided AISI 316L corrosion resistance based on Mössbauer spectroscopy.
Hyperfine Interactions. 2011; 203(1-3):105-112. http://dx.doi. org/10.1007/s10751-011-0351-3.
10. Fewell MP, Mitchell DRG, Priest JM, Short KT and Collins GA. The nature of expanded austenite. Surface and
Coatings Technology. 2000; 131(1-3):300-306. http://dx.doi. org/10.1016/S0257-8972(00)00804-5.
11. Blawert C, Mordike BL, Jirásková Y and Schneeweiss O. Structure and composition of expanded austenite produced by nitrogen plasma immersion ion implantation of stainless steels X6CrNiTi1810 and X2CrNiMoN2253. Surface and Coatings Technology. 1999; 116-119:189-198. http://dx.doi.org/10.1016/ S0257-8972(99)00086-9.
12. Blawert C, Kalvelage H, Mordike BL, Collins GA, Short KT, Jirásková Y, et al. Nitrogen and carbon expanded austenite produced by PI3. Surface and Coatings Technology. 2001; 136(1-3):181-187. http://dx.doi.org/10.1016/S0257-8972(00)01050-1.
13. Gontijo LC, Machado R, Miola EJ, Casteletti LC, Alcântara NG and Nascente PAP. Study of the S phase formed on plasma-nitrided AISI 316L stainless steel. Materials Science and Engineering A. 2006; 431(1-2):315-321. http://dx.doi. org/10.1016/j.msea.2006.06.023.
14. Mingolo N, Tschiptschin AP and Pinedo CE. On the formation of expanded austenite during plasma nitriding of an AISI 316L austenitic stainless steel. Surface and Coatings Technology. 2006; 201(7):4215-4218. http://dx.doi.org/10.1016/j. surfcoat.2006.08.060.
15. Fewell MP and Priest JM. High-order diffractometry of expanded austenite using synchrotron radiation. Surface and Coatings Technology. 2008; 202(9):1802-1815. http://dx.doi. org/10.1016/j.surfcoat.2007.07.062.
16. Öztürk O and Williamson DL. Phase and composition depth distribution analyses of low energy, high flux N implanted stainless steel. Journal of Applied Physics. 1995; 77(8):3839-3850. http://dx.doi.org/10.1063/1.358561.
17. Olzon-Dionysio M, Campos M, Higa OZ, Cunha TF and Souza SD. Investigating the correlation between some of the properties of plasma nitrided AISI 316L stainless steel.
Materials Research. 2013; 16(5):1052-1057. http://dx.doi. org/10.1590/S1516-14392013005000081.
18. Le Bail A, Duroy H and Fourquet JL. Ab-initio structure determination of LiSbWO6 by X-ray powder diffraction.
Materials Research Bulletin. 1988; 23(3):447-452. http:// dx.doi.org/10.1016/0025-5408(88)90019-0.
19. Le Bail A. Whole powder pattern decomposition methods and applications: A retrospection. Powder Diffraction. 2005; 20(4):316-326. http://dx.doi.org/10.1154/1.2135315. 20. Larson AC and Von Dreele RB. General Structure Analysis
21. Toby BH. EXPGUI, a graphical user interface for GSAS.
Journal of Applied Crystallography. 2001; 34(2):210-213. http://dx.doi.org/10.1107/S0021889801002242.
22. Picard S, Memet JB, Sabot R, Grosseau-Poussard JL, Rivière JP and Meilland R. Corrosion behaviour, microhardness and surface characterisation of low energy, high current ion implanted austenitic stainless steel. Materials Science and Engineering A. 2001; 303(1-2):163-172. http://dx.doi. org/10.1016/S0921-5093(00)01841-4.
23. Jack DH and Jack KH. Invited review: Carbides and nitrides in steel. Materials Science and Engineering. 1973; 11(1):1-27. http://dx.doi.org/10.1016/0025-5416(73)90055-4.
24. Ledbetter HM and Austin MW. Dilation of an fcc Fe–Cr–Ni alloy by interstitial carbon and nitrogen. Materials Science and Technology. 1987; 3(2):101-104. http://dx.doi.org/10.1179/ mst.1987.3.2.101.
25. Borgioli F, Fossati A, Galvanetto E and Bacci T. Glow-discharge nitriding of AISI 316L austenitic stainless steel: influence of treatment temperature. Surface and Coatings Technology. 2005; 200(7):2474-2480. http://dx.doi. org/10.1016/j.surfcoat.2004.07.110.