The Unusual Morphology, Structure, and Magnetic Property
Evolution of Glassy Carbon upon High Pressure Treatment
C.Q. Jin, X. Wang, Z.X. Liu, Y.L. Zhang, F.Y. Li, and R.C. Yu
Institute of Physics, Beijing High Pressure Research Center, Chinese Academy of Sciences, P. O. Box 603, Beijing 100080, P. R. China
Received on 23 May, 2003.
Glassy carbon (GC) has been high-pressure high-temperature treated. An interesting morphology evolution from the pristine sample to the high pressure products was observed. It is found that GC can be graphitized under pressure at a temperature much lower than that at ambient condition. Furthermore thein−situstructure
and electrical measurements of GC and graphitized glassy carbon (GGC) under high temperature and high pressure have been investigated up to 30 GPa. We particularly emphasize the unusual magnetic properties of GC treated under high pressures and high temperatures. A paramagnetic to ferromagnetic-like, and then to superconducting (a diamagnetic signal with hysteresis magnetic response) -like behavior, which can be observed at temperatures as high as 80 K, appears as a successive evolution from the initial GC to GGC in accordance with three regions distinguished by the graphitization temperature. This interesting evolution of magnetic properties probably evokes the new understanding of carbon element.
1
Introduction
It is fascinating to investigate the unusual superconductiv-ity in materials containing only light element simply due to their relatively higher Debye temperature[1]. Carbon is one
of such legendary element due to its many forms in terms of structure configuration[2]. Recent experiments reveal that even in pure highly oriented pyrolytic graphite (HOPG), fer-romagnetism and superconductivity fluctuations can exist[3]. Many research works have revealed the superconductivity in the doped new form of carbon C60[4]. Moreover, the recent
discoveries of superconductivity[5] in graphite composite materials have triggered renewed investigation on carbon-based materials[6]. The results imply that the structure di-mension or the topology may play some fundamental role in figuring out the physical properties of graphite related mate-rials.
Carbon has a great diversity of structural and electronic properties depending on its many forms. The single, double, triple carbon-carbon bonds, and their conjugated forms lead not only to the well-known crystalline phases of graphite and diamond, but also to the large variations in structure as a function of temperature and to metastable disordered solids. As an important form in carbon family, glassy carbon is gen-erally believed to contain approximately 100%sp2valence
bond, which has the short-range order of a strained graphite-like layer[7]. It is believed that the glass carbon with a tur-bostratic structure featured by randomly stacked graphite layers is intermediate between amorphous and the graphite form. It thus offers the opportunity to study the topology re-lated effect on graphite rere-lated material. High pressure plays a unique role in designing, modifying, tailoring the
struc-ture, morphology and consequently the physical properties of matter, such as those established in the research on high
TC superconductors[8]. These can be further verified by a series of more recently discovered superconductivity upon the application of high pressure in such unusual elements like oxygen, lithium, boron, etc.
Since the effect of order-disorder developed in the high pressures and high temperatures polymerization process can result in topological defects in this covalently bonded ma-terial and cause the occurrence of unpaired spin, it is thus interesting to check what happened for this evolution, which can provide evidences to testify the appearance of magnetic properties induced by structural instability. These topologi-cal defects may still retain after graphitization and increase the hybridization of local charge density in graphite sheets, as well as lead to the superconductivity.
Here we report and summarize our recent work[9,10,11] on the investigations of high pressure high temperature treated glassy carbon which exhibited some unusual physi-cal properties such as the evolution from ferromagnetic-like to superconducting-like behavior appeared in accord with three regions distinguished by the graphitization tempera-ture.
2
Experimental
standard in the synchrotron radiation experiment. The resis-tance measurements were made on an Intelligent Model ZL5 LCR Measurement System using the assembly as previously reported[12].
DC magnetization M(H, T) measurements were per-formed on two magnetometers: Quantum Design MPMS5 and Oxford MagLab. Before measurements the instruments were carefully degaussed. In order to exclude the impu-rity effects, an ICP-AES method by IRIS/AP-ICP emission spectrometer was adopted to examine the traces of impuri-ties. The total amount of Fe, Co, Ni was found less than 70 ppm in the raw material examined in magnetic measure-ments.
3
Results and Discussion
The High pressure graphitization of glass carbon
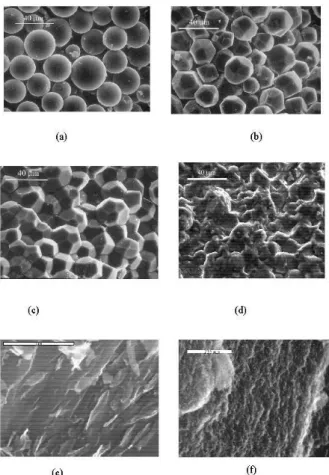
The after-treated specimens have very interesting parti-cle shape evolution from sphere to polyhedron and also the crystalline morphology and size development with increas-ing temperature at the fixed pressure, as shown in Fig. 1. This dynamic graphitization process can be clearly reflected on the X-ray diffractions, as shown in Fig. 2. GC has peaks corresponding to the (hk) and(002) positions of graphite but the other (hkl) peaks are not visible, which suggests that GC consists of strained graphite layers stacked in a disor-dered manner[13]. When treated under high temperatures
and high pressures, GC probably has high internal stresses since its shape varied significantly. However, the effect of the growth of finite crystalline sizes would exceed that of the strain-induced broadening as temperature increases[14]. The
structure slowly evolves toward the ideal graphite structure, and the enhanced crystal formation is indicated by the ap-pearance of higher and sharp peaks. Fig. 3 gives the Raman spectra of GC treated under different temperatures at 5.0 GPa. It has been found that the relative intensity of the 1360 cm−1mode with respect to the 1580 cm−1mode varies as the inverse of the crystal planer domain size[15]. As is evi-dent from Fig. 3, Raman spectra show a distinct narrowing of the width of two bands. Such changes depend strongly on molecular structure, as the variations of its shape and size are clearly demonstrated in Fig. 1. As the molecular size and perfection in atomic order increase with graphitization, the
Figure 1. SEM photographs of GC prepared at 5.0 GPa, showing the particle shape evolution at (a) room temperature, (b) 600◦C, (c) 1200◦C, (d) 1400◦C, and the crystalline morphology and size at (e) 1200◦C, (f) 1400◦C.
High Pressure Effect on Structural and Electrical Prop-erties of Glassy Carbon
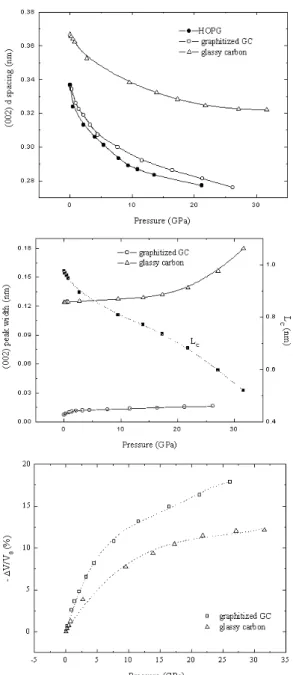
The high pressure X-ray diffraction experiments for GC are carried out up to 31.6 GPa. Fig. 4 shows the energy-dispersive patterns for GC together with the inner calibrated element Pt. Fig. 4 shows the energy-dispersive patterns for GC together with the inner calibrate element Pt. The inter-planar spacingd002, basal plane dimension,La, and height
Lc, normal to the(002)planes have been used extensively to characterize GC. The obtainedd002spacing and the width at
Figure 2. X-ray diffraction patterns of GC treated at 5.0 GPa and at room temperature(a), 600◦C(b), 800◦C(c), 1000◦C(d), 1200◦C(e),
1400◦C(f).
Figure 3. Raman spectra of the high pressure high temperature treated GC. (a) - (f) correspond to the same as of Fig. 2.
Figure 4. Energy-dispersive X-ray diffraction pattern of GC under various pressures.
than that of graphitized glassy carbon that has nearly the samed002as highly ordered pyrolitic graphite. The pressure
dependence of the parameterLcderived from the Scherrer-type modified Warren equation is also given in Fig. 5(b). With increasing pressure, the size of the graphitic layers and the apparent inter-layer spacing decrease continuously.
Bridgman presented a general formula to establish the equation of state (EOS) as:[18]
∆V /V0=a0+aP +bP2+cP3+...
Where∆V =V-V0,V0is the volume at zero pressure, with
coefficientsa0, a, b, andcbeing the fitting parameters, while the relative volume change∆V /V0 can be directly referred from the relative density change. The density can be esti-mated from the X-ray diffraction data:[19]
δX−ray=
ZAmH
ac
¡
ac
√ 3/2¢
c=
7.627
d002
g/cm3 (1)
where Z = 4 denotes the number of carbon atoms in a unitcell, A = 12 is the atomic weight of carbon, mH = 1.66x10⁻²⁴g is the mass of a hydrogen atom,a
c= 2.456 ˚A is the lattice constant of graphite. Fig. 5(C) shows a compar-ison of theP-V relations of GC and GGC. It can be clearly seen that the change of∆V /V0of GC with increasing
pres-sure is markedly different from that of GGC. The volume compression of GGC is much larger than that of GC indicat-ing that a microstructural difference exists between them, which confirms the compressibility in carbon materials in-creases with increasing the degree of structural order.
The experimental∆V /V0-P data of GC and GGC have
been fitted by the Bridgman equation and can be expressed as:
⌋
∆V /V0= 0.01207P−0.00045P2+ 0.0000060027P3, in GC;
Figure 5. (a) The pressure dependence ofd002for high-oriented
graphite, GGC, and GC, (b) the effects of pressure on the peak width ofd002-spacing for GGC and GC, andLc for GC. (c) A
comparison of the relative volume change∆V /V0 between GGC
and GC.
From the equation, we can obtain the bulk modulusB0
according to the relationship,B0 = 1/a0. The bulk
modu-lusB0for GC and GGC is 82.9 GPa and 38.0 GPa,
respec-tively. The higher bulk modulus in GC indicates that it is much harder than GGC.
As can be seen from Fig. 6, both the resistances of GC and GGC decrease gradually with increasing pressure. At the low pressure for GGC, the unusual change of resistance in the curve indicates some rearrangement of packing of crystallites, or possibly some rearrangement of bonding at their edges when they are forced into contact. While in GC, the resistance decreases smoothly with increasing pressure up to about 13 GPa, then a bump appears in theR-P curve that indicates the completion of the merging between the
merged.
Figure 6. A comparison of theR−Prelation between GGC and
GC. The arrow indicates a bump appearing in GC upon compres-sion.
The magnetic properties of the high pressure graphi-tized GC
DC magnetization measurements have been performed for all products prepared under different pressures and tem-peratures. The temperatures in the high pressure synthesis have primary effects in distinguishing their magnetic behav-iors. It can be divided into three regimes by the transfor-mation temperature: the first one in non-graphitization re-gion only shows paramagnetism, the second one in near-graphitization region reveals ferromagnetic signals, while the third one in graphitization region gives superconducting-like (a diamagnetic signal with hysteretic magnetic re-sponse) behaviors.
Figure 7. Magnetic moment hysteresis loops after subtraction of the diamagnetic background signals measured in samples treated at 5.0GPa at room temperature and 1200◦C,respectively.
Figure 8. Magnetization loops for glassy carbon treated at 5 GPa, 1200◦C without subtracting background. The inset shows the re-sults after subtracting the diamagnetic background data. It gives clear evidence for saturated magnetization at 300 K.
temperature was close to the transition point 1400◦C. Then a large hysteresis loop appears, as shown in Fig. 8 forT = 5 K, 10 K, and 300 K respectively. These hysteresis loops are typical for ferromagnets. A comparison between before and after (the inset) subtraction of the diamagnetic back-ground signals is also presented. It has long been thought that ferromagnetism due to interactions between p-electrons is impossible. However, the discovery of a new organic material (TDAE-C60) rapidly changed this notion[20,21,22].
The ferromagnetic state can be a result solely of the align-ment of p-electron spins on the fullerene units. From the point of this view, the observed unusual magnetic behavior is not too surprising because it may be the similar case for our samples treated under high temperatures and high pres-sures. The topological defects induced ferromagnetism is also used to explain the ferromagnetism in rhombohedral C60 [23]. During the graphitization process, we have
ob-served a significant shape change from spherical to poly-gonized. It can be clearly seen in Fig. 1(c), (e) that the topo-graphical micrograph for the sample in near-graphitization region is of short-range order of the strained layers. We
suppose that these shape changes are intimately related with the appearance of ferromagnetic behavior. These aggregated polyhedra with the short-range order of the strained graphite layer can lead to asp2-sp3 rehybridization and form
un-paired electron. This pressure-induced polygonization can trigger an ordering alignment of the itinerant moments com-ing from these unpaired spins to form itinerant ferromag-netism. When the prepared temperature reaches transition point, GC will transform into polycrystalline graphite. We also examine its magnetic signals and want to check if fer-romagnetism still exists, but find that an interesting change from ferromagnetic-like to superconducting-like behavior happens. Shown in Fig. 9 are magnetic moment hystere-sis loopsm(H)measured forT = 5 K, 40 K and 80 K, re-spectively. One can clearly observe the superposition of the superconducting hysteresis loop over a linear diamagnetic background (m0 = χH, whereχ = −1. 22 x 10−6 emu
g−1 Oe−1 atT = 10 K). Measuring under higher temper-atures will cause the detected signals comparable to back-ground noise. Fig. 10 shows the temperature dependence of the magnetic momentm(T)for applied fieldH = 100 Oe. As shown in Fig. 10(a) for the sample in near-graphitization region, note the upturn around 50 K, this can be attributed to the couples of paramagnetism of common amorphous car-bon with some ferromagnetic clusters formed by defects as discussed above. While in Fig. 10(b), the sample belongs to polycrystalline graphite transformed by GC. Although X-ray diffraction and Raman spectra have not shown any sign of amorphous carbon, we can not exclude the magnetic ef-fects caused by them. The turning point seems atT = 20 K, but the magnetization reaches zero around 50 K. It may indicate the existence of some untransformed GC. Our ob-served result has the similarity with the recent report about the existence of superconducting fluctuations in HOPG[3]. We speculate that the topological disorders have played an important role in the samples. The after-transformed glassy carbon is graphite microcrystalline of warped layers with curved regions, which can present some disclinations con-tributing to the disorder, as shown in Fig. 1(f). Localization due to this disorder can happen and enhance the local charge density, and therefore trigger the superconductivity. Since both the ferromagnetism and superconductivity in this ma-terial can be ascribed to the structural instability, during the process of graphitization they can coexist.
spec-Figure 9. The superconducting-like magnetization behavior in GC after graphitization. The diamagnetic background signals have been subtracted. Continuing to increase temperature will cause the detected signals comparable to background noise.
Figure 10. Temperature dependencies of the magnetic moment measured in glassy carbon before (a) and after (b) graphitization in applied magnetic fieldH= 100 Oe.
Acknowledgement
This work has been supported by the National Natu-ral Science Foundation of China, Chinese Academy of
Sci-rtan, Nature350, 600 (1991).
[5] R. Ricardo da Silva, J.H.S. Torres, and Y. Kopelevich, Phys. Rev. Lett.87, 147001 (2001).
[6] J. Gonz¨alez, Phys. Rev. Lett.88, 76403 (2002).
[7] G.M. Jenkins, K. Kawamura, and L.L. Ban, Proc. R. Soc. Lond. A.327, 501 (1972).
[8] C. -Q. Jin, X. -J. Wu, P. Laffez, T. Tatsuki, T. Tamura, S. Adachi, H. Yamauchi, N. Koshizuka, and S. Tanaka, Nature
375, 301-303 (1995).
[9] X.Wang, Z.X.Liu, Y.L.Zhang, F.Y.Li, R.C.Yu, and C.Q.Jin, J. Phys.: Condens. Matter14, 10265-10272 (2002).
[10] X.Wang Z.X.Bao, Y.L.Zhang, F.Y.Li, R.C.Yu, and C.Q.Jin, J. Appl. Phys.93, 1991-1994 (2003).
[11] X. Wang, G.M. Zhang, Y.L. Zhang, F.Y. Li, R.C. Yu, and C.Q. Jin, Carbon41, 188 (2003).
[12] Z. X. Bao, S. V. Hugo, and L. Francis Howell, J. Appl. Phys.
70, 6804 (1991).
[13] R.E. Franklin, Acta Cryst.3, 107 (1950).
[14] R.R. Saxena, and R.H. Bragg, Carbon16, 373 (1978).
[15] R.O. Dillon, J.A. Woollam, and V. Katkanant, Phys. Rev. B.
29, 3482 (1984).
[16] S. Yamada, and H. Sato, Nature193, 261 (1962).
[17] M. Inagaki, A. Oberlin, and S. de Fonton, High Temp. - High Pressures9, 453 (1977).
[18] P. W. Bridgman, The Physics of High Pressure (Bell and Sons, London, 1958).
[19] M. M. Dubinin, G. M. Plavnik, and E. D. Zaverina, Carbon
2, 261 (1964).
[20] P.M. Allemand, K.C. Khemani, A. Koch, F. Wudl, K. Hol-czer, S. Donovan, G. Gruner, and J.D. Thompson, Science
301, 253 (1991).
[21] A. Mrzel, A. Omerzu, P. Umek, D. Mihailovic, Z. Jagliˇci´c, and Z. Trontelj, Chem. Phys. Lett.298, 329 (1998).
[22] B. Narymbetov, A. Omerzu, V. V. Kabanov, M. Tokumoto, H. Kobayashi, and D. Mihailovic, Nature407, 883 (2000).