Characterization of test specimens produced in reduced
size for X-ray microtomography (µ-CT) tests
Caracterização de corpos de prova de tamanho
reduzido desenvolvidos para ensaios de
microtomograia de raios X (µ-CT)
Abstract
Resumo
The need to use reduced sample sizes, in order to attain improved spatial resolution in (µ-CT) tests applied in Portland cement composites, makes researchers perform the fractionation of materials to obtain samples with dimensions compatible with the capacity of the scanning equipment, which might cause alterations in the microstructure under analysis. Therefore, a test specimen (TS) with dimensions compatible with the scanning capacity of a microtomography system that operates with an X-ray tube and voltage ranging from 20 to 100 kV was proposed. Axial compression strength tests were made and their total porosity was assessed by an apparent density and solid fraction density ratio, which were obtained by means of mercury and helium pycnometry and µ-CT technique, respectively. The adoption of that TS has shown to be viable for providing a sample with a higher level of representation.
Keywords: X-ray microtomography, fractionation of samples, test specimen, pycnometry, pore structure.
A necessidade de se utilizar amostras de tamanho reduzido, para a obtenção de uma melhor resolução espacial nos ensaios de µ-CT em compósitos de cimento Portland, leva os pesquisadores a realizar o fracionamento do material para a obtenção de amostras com dimensões compatíveis com a capacidade de leitura do equipamento, o que pode ocasionar alterações da microestrutura em análise. Assim, foi proposto um corpo de prova (CP) com dimensões compatíveis com a capacidade de leitura de um microtomógrafo com tubo de raios X que opera dentro de um intervalo de tensão de 20 a 100 kV.Foram realizados testes de resistência à compressão axial e avaliação da sua porosidade total por meio da relação entre a densidade aparente e a densidade da fração sólida, obtidas respectivamente pelas técnicas de picnometria (de mercúrio e hélio) e pela técnica de µ-CT. A adoção deste CP se mostrou viável por proprocionar uma amostragem com maior nível de representatividade.
Palavras-chave: microtomograia de raios X; fracionamento de amostras, corpo de prova, picnometria, estrutura de poros.
a UFMG, Department of Materials Engineering and Construction, Belo Horizonte, MG, Brazil; b UFMG, Department of Metallurgical and Materials Engineering, Belo Horizonte, MG, Brazil; c UFMG, Departament of Architecture and Urbanism Technology, Belo Horizonte, MG, Brazil; d KROTON Educacional S.A., Belo Horizonte, MG, Brazil.
Received: 12 Jul 2015 • Accepted: 12 Jan 2017 • Available Online: 04 Oct 2017
E. E. BERNARDES a
A. G. DE MAGALHÃES a
W. L. VASCONCELOS b
E. V. M. CARRASCO c
E. H. M. NUNES b
L. B. DE LIMA d
1. Introduction
The use of computer based X-ray microtomography (µ-CT) has vastly improved the structural analysis of pores in materials. Ac-cording to Cnudde et al. [1], a critical point when working with X-ray microtomography is the ratio between the size of the sample and the spatial resolution obtained. A small sample size is required to attain a high spatial resolution. However, working with small
sam-ples conlicts with the question of representativeness, since the
volume of the sample must contain the properties of the whole set, in order to obtain an acceptable estimate of the general properties of the material. In the case of composites of a cement matrix, their heterogeneity and complex void structure increase the level of
dif-iculty of developing an adequate sampling plan.
Studies involving the analysis of pores in cementitious matrix composites by using X-ray microtomography make use of several different sampling techniques. In general, the methodologies ad-opted in these studies involve the molding of test specimens from which the samples are extracted. To perform this extraction, the processes of fragmentation or extraction of testimony are mainly
used [2-4]. However, these processes may lead to micro-issures,
thus causing alterations in the microstructure of the materials.
Ad-ditionally, a sample collected from a speciic region of the speci -men (TS), for instance, from the central region [5], may produce results that are not consistent with the system’s true properties. A possible alternative to extracting samples could be molding specimens with a reduced size that is compatible with the read-ing capacity of the equipment [5-7], which would furnish increased sampling/TS ratio, or even a total sampling.
However, it is important to note that a reduced size increases the
level of dificulty in conducting studies with concretes, since the presence of coarse aggregates makes it more dificult to produce very small specimens. Therefore, studies in this ield usually use
materials that feature a cementitious base such as cement mor-tars, grouts and micro-concretes.
The objective of this study was to produce mortar specimens with a reduced size, viable to be used in µ-CT studies using whole and intact structures. In addition to that, it was sought to evaluate if the internal structure of these CPs could be considered representa-tive when compared to specimens with dimensions of (5x10) cm,
produced from the procedure speciied by standard NBR 7215 [8].
The adoption of a standardized procedure aims to reduce the de-gree of variability of the study, facilitating the comparison of results for future researches.
The dimensions of the small size CPs were determined by
prelimi-nary tests performed in the same μ-CT equipment used in the sub -sequent assays. It was sought the largest diameter which, accord-ing to the power of the equipment, allowed to overcome the degree
of opacity of the material to X-ray. For deinition of the height, it was respected the condition deined in standard NBR 5738 [9] wich
says that the ratio between height/diameter of the test specimen must be equal to 2. Thus, the feasibility of testing cylindrical CPs of (2x4) cm was observed.
For the two types of TS adopted, axial compression tests were performed, besides to evaluating its total porosity by means of the relation between the bulk density (apparent) and the density of the solid fraction, obtained by the techniques of mercury and helium
Table 1
CP V ARI chemical analysis according
to NBR 5733 standard
Chemical determinations
Cement used (% of the mass)
NBR 5733 limits (% of the mass)
Insoluble residue
(IR) 0.79 ≤ 1.0
Loss on ignition
(LOI) 3.9 ≤ 4.5
Magnesium
oxide (MgO) 0.76 ≤ 6.5
Sulfur trioxide (SO3) – when C3A of
the clinker - 8% 2.89 ≤ 3.5 – when C3A of
the clinker > 8% - ≤ 4.5
Carbon dioxide
(CO2) 2.48 ≤ 3.0
Table 2
CP V ARI mechanical analysis according to NBR 5733 standard
Characteristics and properties Unit Cement used Cement used
Fineness Residue in the sieve 75 µm Speciic area
% ≤6 ≤ 6
m²/kg 480.6 ≥ 300
Mortar setting start time min 131 ≥ 60
Mortar setting end time min 186 ≤ 600
Expandability when hot mm ≤5 ≤ 5
Compressive strength
1 day old MPa 27.9 ≥ 14
3 days old MPa 40.2 ≥ 24
pycnometry and the μ-CT technique, respectively. The evaluation of the porosity by means of the μ-CT technique was performed
only in the small size CP, since the equipment does not have
suf-icient power for reading in the CP of (5x10) cm.
In order to compare the results obtained from axial compressive strength tests, performed in the two TS groups studied, in order to evaluate the effect caused by the reduction in size, it was used the hypothesis test based on the Student t Test probability distribution (or T-statistical test) for independent samples.
For the purpose of veriication, a new hypothesis test was performed
using the Fisher-Snedecor probability distribution test (test F). For
the purpose of veriication, a new hypothesis test was performed us -ing the Fisher-Snedecor probability distribution test (F-test).
2. Materials and experimental program
2.1 Mortar
Portland cement with high initial strength (CP V – ARI), whose chemical and physical properties analyses are presented in Tables 1 and 2, respectively, according to the standard NBR 5733 [10], was used. This choice is caused by the fact that this is the cement with lower content of additions available in the Brazilian market. The mortar was produced using a 1:3 (cement/sand) ratio with a 0.48 water/cement (w/c) ratio. The sand utilized was prepared from a homogenized mixture of four individual fractions of regular sand
in equal proportions, in mass, as speciied in the standard NBR
7215 [8]. Table 3 exhibits the granulometric fractions of the regular sand, according to the standard NBR 7214 [11].
2.2 Molding and curing
In the preparation of the specimens (TS), standard (5x10) cm molds and special (2x4) cm molds were used, whose images can be seen in Figure 1. The specimen diameter 2 cm was previously established based on the opacity level of the material under study in relation to reading capacity of the µ-CT equipment to be utilized [6].
For the compression strength test, 55 cylindrical specimens featur-ing 2x4cm dimensions and 56 specimens featurfeatur-ing 5x10cm dimen-sions were molded, ruptured at 7 days of age. The compression strength tests on the normalized TS with dimensions of (5x10) cm have the purpose of validating the material, the dosing procedure and preparation of the samples, adopted in this study, since its results are backed by standard [10] and literature. Thus, when
ap-plying the same procedures for CP with dimensions of (2x4) cm, it is possible to perform a comparison of results, since there is no standard or literature data for specimens with these dimensions. Samples used in the helium gas (He) and mercury (Hg) pycnom-etry tests were collected from the same specimen. Therefore, for each age under analysis (7 and 28 days), unique specimens were molded featuring 2x4cm and 5x10cm.
For reading with the X-ray microtomography, one test specimen with dimensions of (2x4) cm was molded, being used at both test ages (7 and 28 days). Because it is a non-destructive technique, the performance of readings at different ages, using the same test body, besides being feasible is convenient, as it allows following the actual changes in the porosity of the material due to the cement particles hydration process, without any variability arising from the molding process.
In the molding of the specimens, the mechanical densiication was
used, by means of a vibrating table, in order to reduce the vari-ability in the process.
After the molding step, the test specimens were kept in a humid chamber for a period of 24 hours and then demolded and kept sub-merged in a tank containing potable water until ready to be tested.
2.3 Preparing the test specimens
For the compressive strength test, all TS had their ends capped with sulfur, in order to guarantee the parallelism between them.
For the pycnometry tests, it was necessary to establish a speciic
preparation procedure for each TS size.
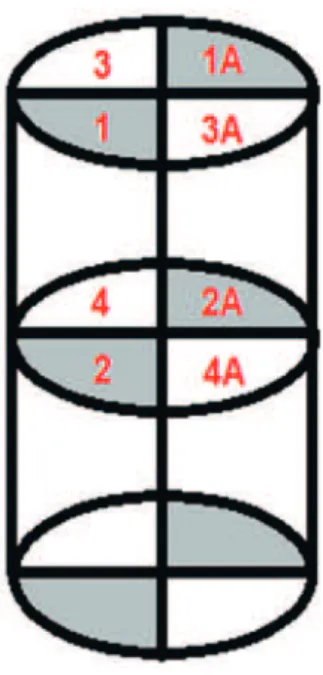
The specimens of (2x4) cm were divided in two halves by a longitu-dinal section. One of the halves was utilized in the helium pycnom-etry test and the other one in the mercury pycnompycnom-etry test. In the specimens with dimensions of (5x10) cm, two orthogonal cuts were made between them, in the longitudinal direction, and a cross section, resulting in a division of 8 parts with similar dimen-sions. Figure 2 shows the schematic model of cutting of the CPs and the indication of the parts selected for the tests. By longitudinal division, ¼ of the specimen was selected for the He pycnometry
Table 3
Grain size fractions standard sand
Material trapped between the nominal
aperture sieve
Designation
2.4 mm to 1.2 mm Coarse fraction 1.2 mm to 0.6 mm Mean coarse fraction 0.6 mm to 0.3 mm Mean ine fraction 0.3 mm to 0.15 mm Fine fraction
Figure 1
test (parts 1 and 2) and the other ¼, opposite the vertex of the irst
sample, was reserved for the Hg pycnometry test (parts 1A and 2A ), and the remaining parts were discarded.
Samples for the pycnometry tests were oven dried at a tempera-ture of (105 ± 5) ° C for a period of approximately 6 hours. This
drying time was suficient for two successive weighings, intervals
in 1 hour, not to differ by more than 0.5% from the lowest mass. The parts for the helium pycnometry test were pulverized in an agate mortar grinder mill until a grain size of less than 75 mm be attained, and controlled by sieving (100% of the material passing through the sieve # 200). At the end of the milling step, the mate-rial was homogeneously fractioned in order to obtain a fraction of approximately 3.6 grams.
The test specimen intended for the μ-CT test did not undergo any
special preparation.
2.4 Compressive strength test
For testing the axial compression strength of the (2x4) cm speci-mens, a servo electrical universal testing machine with a capacity of 30 kN was used, with a special universal joint suitable for the CP and a load cell with full scale of 10 kN.
For the (5 x 10) cm specimens, servo electrical universal testing machine with a capacity of 300 kN was used, with a special univer-sal joint suitable for the CP and a load cell with full scale of 300 kN. In both cases, the loading speed used was (0.25 ± 0.05) MPa/s ,
as speciied in NBR 7215 [8], with all test specimens being tested at 7 days, since the greatest gains in compressive strength of CP V occur until this age [10].
2.5 Helium and mercury pycnometry tests
The helium pycnometry tests were performed with the QUANTA-CROME STEREOPYCNOMETER - Model SPY-3, using the lower volume sample holder.
The mercury picnometry was performed in a volumetric lask with
a capacity of 100 mL. For the TS with dimensions of (5x10) cm, the
test was performed in two stages, the irst one being the fragments
from the upper part of the CP (part 1A) and the fragments from the lower part (part 2A).
Based on the real density and volumetric density igures, obtained
from the helium and mercury pycnometry tests respectively, the po-rosity of the material at the ages of 7 and 28 days was calculated.
2.6 Obtaining µ-CT images
A high-resolution microtomograph, model SkyScan 1172, was used to perform X-ray computed microtomography tests. This equipment has a CCD camera with a resolution of 10 Mp (mega-pixel), X-ray tube that operates within a voltage range of 20 to 100 kV and a power of up to 10 W. For the scanning of the images, a
resolution of (2000 x 1048) pixels and Al + Cu ilter. A rotation was
adopted at angles of up to 180 °, in steps of 0.40 °.
The readings were performed at 7 and 28 days. After the irst reading, the specimen was packed in PVC ilm and conditioned in a humid
chamber until 28 days, and a new reading was performed at this age. For each reading age, approximately 450 projections from the scanned portion of the sample were obtained. The NRecon soft-ware was used for the reconstruction of the images, being gener-ated 1000 sections on average. The CTAn software [12] was used to calculate the porosity of each section.
The percentages of porosity presented represent an overall mean of the porosity values obtained for sections generated from reading with the microtomograph (1042 sections for reading at 7 days and 1038 sections for reading at 28 days), and the error was calculated from the standard deviation between the readings of the sections,
within a 95% conidence interval.
3. Results and discussions
3.1 Compressive strength
Figure 3 shows the dispersion graph for the compressive strength
Figure 2
Cutting diagram of the CP (5x10) cm
Figure 3
results of the specimens. It is observed that TS that reached resistance greater than 40 MPa belong, for the most part, to the group with dimensions of (2x4) cm. The largest individual values of compressive strengths also belong to specimens of said group.
Table 4 presents the values for statistical reference of the compressive strengths. Note that the (2x4) cm and (5x10) cm test specimens presented very close values for the lowest re-sistance, however the maximum resistance value of the CP (2x4) cm was much higher. This also showed a higher mean resistance and a higher standard deviation of the results. For both CP groups, the median value was very close to the mean value, which indicates a distribution curve very close to the Normal distribution.
From the values of mean resistance and standard deviation, the coefficient of variation of Pearson (cv) was calculated, be-ing the largest value presented by the group of TS with di-mensions of (2x4) cm. The cv indicates the variability of the results (standard deviation) in relation to the mean. The lower the value, the more uniform the data.
For the analysis of the TS mean resistance values, the hy-pothesis test was applied, based on the Student’s T-probability distribution (or statistical test T) for independent samples. This test is used to assess whether there is a significant difference in the mean of a measure between two groups. The null hy-pothesis is that the mean is equal in both groups. The alter-native hypothesis is that the mean is different. If the p-value, probability of error in rejecting the null hypothesis, is less than 5%, the null hypothesis is rejected. That is, it is assumed that the mean is different in the two groups.
In the case of this study, the p-value found was 2.7%, indicat-ing that there is a significant difference between the compres-sive strength of the two groups, being the (2x4) cm cylinder resistance greater. Thus, although the average values of re-sistance are very close (difference of 1.11 MPa), the statistical difference between the resistances is quite significant.
For comparison, a new hypothesis test was performed using the Fisher-Snedecor probability distribution test (F test) for the comparison of variance. A p-value of 0.024 (2.4%) was ob-tained, again indicating that the variability of the (2x4) cm TS
is significantly greater than the (5x10) cm TS.
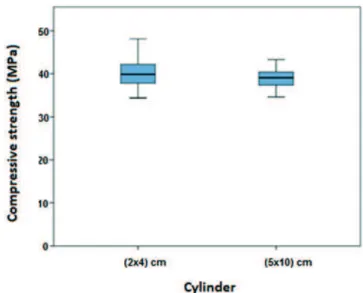
Figure 4 shows the boxplot1 of distribution of resistance for the
two specimens groups. It is possible to observe that the vari-ability of the resistance using the cylinder (2x4) cm is larger, in relation to the (5x10) cm cylinder.
Figure 5 shows the frequency distribution of the percentage of TS per compressive strength class. Note that the highest percentage assumed by the (5x10) cm TS was the class of 39 MPa. For the TS of (2x4) cm was the class of 41 MPa.
The higher average compressive strength and greater dis-persion in the results presented by the TS with dimensions of (2x4) cm are justified by the scale effect, that is, there is a decrease in the axial compressive strength with the increase of the size of the specimen. This effect is insignificant in large structures, but with great influence in small ones, as is the case of the specimens [13].
Table 4
Statistic referential of the specimens’ compressive
strength on the 7h day
Parameter (5x10) cm (2x4) cm
Minimum (MPa) 34.64 34.43
Maximum (MPa) 43.28 48.11
Mean (MPa) 38.86 39.97
Median (MPa) 39.05 39.87
Standard deviation 2.17 2.96 Coeficient of variation (%) 5.6 7.4
Figure 4
Boxplot
for compressive strength distribution
of cylinders
Figure 5
Frequency distribution of TS percentage per
compressive strength class
3.2 Porosity by He and Hg pycnometry and µ-CT
Table 5 presents the porosity percentages, calculated from the pycnometry techniques and the readings with the X-ray microtomograph.
The porosity of the samples, by the method of picnometry, was calculated from the values of real density and volumetric density, obtained by the helium and mercury pycnometry tests, respectively.
The porosity results, obtained by the μ-CT technique, were cal -culated from the global average of the porosity values obtained for each section generated by the reading with the microtomo-graph, being 1042 sections for reading at 7 days and 1038 sec-tions for reading at 28 days.
By the pycnometry technique, it was observed that the percent-ages of porosity obtained for the specimens with dimension of (2x4) cm were smaller than those presented by the TS with di-mension of (5x10) cm.
Although changes in the porosity of cementitious materials are normally expected with advancing age, caused by changes in its microstructure due to the process of hydration of the cement, the variation of the results, by the picnometry technique, was
not signiicant. This result can be a consequence of an accelera
-tion of hydra-tion process, caused by oven dried the samples, at a temperature of (105 ± 5) ºC. [14, 15]
However, the μ-CT, whose the TS analyzed did not undergo a dry -ing process, not only indicated a large reduction in the porosity of the material at 28 days, but also a higher percent porosity at the age of 7 days, compared to the result obtained by the picnometry technique for the (2x4) cm TS. At the age of 28 days, the porosity values between the techniques were very close.
According to Cervera et al. [16], to take into account the inluence
of temperature, many aging models have been based on the
con-cepts of “maturity” or “equivalent age” by deining an artiicial age for the cementitious material. This artiicial age may be higher or
lower than the actual age depending on whether the temperature history has accelerated or delayed the maturation process.
3.3 Evaluation of results
The greater variability in results and higher mean compressive strength presented by the smaller test specimens are in line with the behaviors reported in studies on the subject [7, 17-21], and can be explained especially by the theory Of Effect Size [19, 20]. Beyond that, it should be taken into account that the mechanical
strength of a cementitious matrix composite is signiicantly affected
by the porosity of its internal structure [21]. Thus, the lower porosity of the (2x4) cm TS corresponds to a higher average compressive strength, in relation to the TS of (5x10) cm.
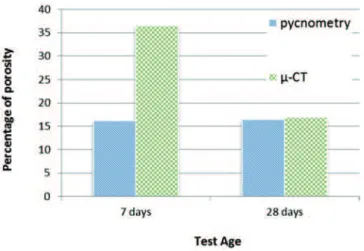
The comparison of the porosity results, obtained from the μ-CT
and pycnometry techniques, is presented in Figure 6. Although the porosity results, presented by the two techniques, were very differ-ent at the age of 7 days, at 28 days these were close. This behavior accentuate the hypothesis that the use of the drying temperature of the samples for the pycnometry test may have affected the pore structure of the material, especially at the age of 7 days, leading this to assume a pore structure characteristic of more advanced ages [15,16].
3.4 Microtomography images
Figure 7 shows images generated from the X-ray microtomograph readings at randomly selected ages of 7 and 28 days. Note that the geometry proposed for the test specimen allowed a satisfactory resolution to be obtained, and it is possible to visualize the reduc-tion in the porosity of the secreduc-tions at 28 days.
Table 5
Porosity percentage
Technique Specimen (cm) 7 days (%) 28 days (%)
Pycnometry
2x4 16.1 ± 0.5 16.4 ± 0.6
5x10 (1A) 18.3 ± 0.2 18.4 ± 0.1
5x10 (2A) 18.6 ± 0.2 19.4 ± 0.1
5x10 (1A + 2A) 18.6 ± 0.4 18.7 ± 0.2
µ-CT 2x4 36.4 ± 0.1 16.9 ± 0.1
1A – fragments from the upper-half of specimen ; 2A – fragments from the lower-half of specimen; 1A + 2A – Porosity calculated based on mean volumetric density values.
Figure 6
4. Conclusions
For the μ-CT equipment used in this study, the adoption of test
specimens with dimensions of (2x4) cm was fesible, indicating that studies on the pore structure of the cementitious composite can be performed in an intact whole structure. It should be noted that equipment with lower resolution and power than the one used in this study may not present satisfactory results for the TS dimen-sions considered.
According to the statistical tests, it was veriied that, in the test of
compressive strength, the test specimens of (2x4) cm presented greater variation of results and a higher average resistance, com-pared to the test specimens of (5x10) cm, although its average resistances are very close. Such behavior is compatible with the
results obtained by several studies on the inluence of dimensional
variation on test specimens.
The percentage of porosity, calculated from the density values ob-tained by the helium and mercury picnometry tests, was slightly lower for the test specimen of (2x4) cm. Since the compressive strength is affected by the porosity of the material, in an inversely proportional relation, the greater average resistance to compres-sion presented by this test body is consistent.
The study showed that the comparison of porosity results obtained from the techniques of picnometry and microtomography may be feasible [2, 23], however, the sample preparation process should be reevaluated, especially with regard to the use of temperature for drying the material at earlier ages, since the procedure was
feasible for the age of 28 days, but inluenced the results at 7 days.
The large number of studies addressing the pore microstructure of
cementitious materials, and especially the use of μ-CT, emphasizes
the need to elaborate a procedure for the preparation of specimens with reduced dimensions. Although there is no obligation to follow technical standards in research, and each researcher has the
free-dom to deine the procedures to be followed, trying to create a refer
-ence standard for microtomography studies can help the scientiic
community achieve greater advances, once that the scale effect, sample preparation and sampling technique have a direct correla-tion in the compressive strength and the pore structure of the
mate-rial, which can create great dificulties in comparing the results.
5. Acknowledgments
The authors thank CNPq and FAPEMIG for inancial support and
HOLCIM for the supply of the cement used in this research.
Figure 7
6. Bibliographical references
[1] V. Cnudde, M. Boone, J. Dewanckele, M. Dierick, L. Van Hoorebeke, P. Jacobs, 3D Characterization of sandstone by means of X-ray computed tomography. Geosphere, v.7, n.1, p. 54-61, February 2011.
[2] E.E. Bernardes, A.G. Magalhães, W.L. Vasconcelos, E.H.M. Nunes, Evaluation of the effect of varying the workability in the concrete pore structure by using X-ray microtomography. RIEM, 6 (4), august (2013), 582-597.
[3] M. Lánzon, V. Cnudde, T. Kock, J. Dewanckele, X-ray Mi-crotomography (µ-CT) to evaluate microstructure of mortars containing low density additions. Cement & Concrete Com-posites, 34 (9) (2012), 993-1000.
[4] S. Lu, E.N. Landis, D.T. Keane, X-ray Microtomographic studies of pore structure and permeability in Portland cement concrete. Materials and Structures, 39 (6) (2006), 611–620. [5] E. Gallucci, K. Scrivener, A. Groso, M. Stampanoni, G. Mar-garitondo, 3D experimental investigation of the microstruc-ture of cement pastes using synchroton X-ray microtomog-raphy (µCT), Cement and Concrete Research 37 (3) (2007), 360-368.
[6] N.N. Naik, K.E. Kurtis, A.P. Wilkinson, A.C. Jupe, S.R. Stok, Sulfate deterioration of cement-based materials examined by x-ray microtomography. Proc. SPIE 49th Annual Meet-ing, Optical Science and Technology: Developments in X-ray Tomography: IV. Denver, August 2– 6, 2004.
[7] E.N. Landis, E.N Nagy, D.T. Keane, Microtomographic Mea-surements of internal damage in Portland-cement-based composites. Journal of Aerospace Engineering, 10 (1) (1997), 2-6.
[8] ABNT – Associação Brasileira de Normas Técnicas. NBR 7215 (Incorpora a Errata nº 1 de 1997): Cimento Portland – Determinação da resistência à compressão. Rio de Janeiro, 1996.
[9] ABNT - Associação Brasileira de Normas Técnicas. NBR 5738: Concreto – Procedimento para moldagem e cura de corpos de prova. Rio de Janeiro, 2003
[10] ABNT - Associação Brasileira de Normas Técnicas. NBR 5733 /EB-2: Cimento Portland de alta resistência inicial. Rio de Janeiro, 1991.
[11] ABNT - Associação Brasileira de Normas Técnicas. NBR
7214: Areia Normal para ensaio de cimento – Especiicação.
Rio de Janeiro, 2012.
[12] SkyScan, Structural parameters measured by SkyScan CT-analyser software. August 1, 2009.
[13] C.V.G, Coura; M.T.G, Barbosa; F.A.I, Darwish, Análise da lei de Bažant e de Carpinteri na resistência à compressão do
concreto. Revista Internacional de Desastres Naturales, Ac-cidentes e Infraestructura Civil, v.8, n.1, mayo, 2008. [14] M. Alshaaer, H. Cuypers, G. Mosselmans, H. Rahier, J.
Wastiels, Evaluation of a low temperature hardening Inor-ganic Phosphate Cement for high-temperature applications. Cement and Concrete Research 41 (1) (2011), 38-45. [15] K.K. Aligizaki, Pore structure of cement-based materials:
testing interpretation and requirements. Modern concrete
technology series; v 12. London; New York Taylor & Fran -cis, 2006.
[16] M. Cervera; R. Faria, J. Oliver; T. Prato, Numerical modelling
of concrete curing, regarding hydration and temperature phe-nomena. Computers and Structures 80 (2002), 1511-1521. [17] S-T. Yi, E-I. Yang, J-C, Choi, Effect of specimen sizes,
specimen shapes and placement direction on compressive strength of concrete. Nuclear Engineering and Design, Janu-ary, 2006 v. 236, n.2, p.115-127.
[18] R.L. Day, M.V. Haque, Correlation between strength of small and standard concrete cylinders. ACI Materials Journal, v.90, n. 5, p. 452-462, 1993.
[19] J.R. Viso; J.R. Carmona; G. Ruiz, Shape and size effects on
the compressive strength of high-strength concrete. Cement and Concrete Research 38 (3) (2008), 386-395.
[20] C.V.G. Coura, M.T.G. Barbosa, F.A.I. Darwish, Análise da lei
de Bažant e de Carpinteri na resistência à compressão do
concreto. Revista Internacional de Desastres Naturales, Ac-cidentes e Infraestructura Civil, v8, n.1, mayo, 2008. [21] C.A. Gutschow, A avaliação da resistência do concreto em
estruturas acabadas através da extração e ensaio de teste-munhos de pequenos diâmetros. Dissertação de Mestrado. Universidade Federal do Rio Grande do Sul, Porto Alegre, 1995. 146 p.
[22] C. Lian, Y. Zhuge, S. Beecham, The relationship between porosity and strength for porous concrete. Construction and Building Materials, 25 (11), p. 4294-4298, 2011.