This paper proposes an automatic method based on the computing vision, implemented in a mobile platform, to inspect cracks in masonry and concrete. The developed algorithm for image processing performs this task from images of the cracks evolution. The contribution of this paper is the development of a mobile tool with quick response aiming to assist technicians in periodic visits when monitoring the crack opening in masonry and concrete. The obtained results show, successfully, the dimensional alterations of cracks detected by mobile phone in a faster and accurate way compared with the conventional measurement technique. Regardless the irregular shape of the cracks, the proposed method has the advantage of producing results statistically signiicant in measurement repetition by decreasing the subjectivity inherent to manual measurement technique.
Keywords: computational vision, image processing, mobile platform, cracks.
Este artigo propõe um método automático com base em visão computacional, implementado em uma plataforma móvel, para inspecionar is -suras em alvenaria e concreto. O algoritmo desenvolvido para processamento de imagem realiza esta tarefa a partir de imagens da evolução de issuras. A contribuição deste trabalho é o desenvolvimento de uma ferramenta móvel, com resposta rápida visando auxiliar os técnicos em visitas periódicas no monitorameto da abertura de issuras em alvenaria e concreto. Os resultados obtidos mostram, com sucesso, as alterações dimensionais de issuras detectadas pelo telefone celular de uma maneira mais rápida e precisa em comparação com a técnica de medição con -vencional. Independente da forma irregular das issuras, o método proposto tem a vantagem de produzir resultados estatisticamente signiicativos na repetição de medição, diminuindo a subjetividade inerente à técnica de medição manual.
Palavras-chave: visão computacional, processamento de imagem, plataforma móvel, issuras.
Image-based method for monitoring of crack opening
on masonry and concrete using Mobile Platform
Método com base em imagem para o monitoramento
da abertura de issura em alvenaria e concreto usando
plataforma móvel
A. P. MArtIns a
J. C. PIzolAto JunIor b
V. l. BelInI c
a Alecsander Pereira Martins, Universidade Estadual de Londrina (UEL) - Mestrado em Engenharia Elétrica na Universidade Estadual de Londrina (UEL), [email protected], Londrina, PR, Brasil;
b José Carlos Pizolato Jr,Universidade Federal de São Carlos (UFSCar) -Professor Adjunto do Departamento de Engenharia Elétrica da Universidade Federal de São Carlos (UFSCar), [email protected], São Carlos, SP, Brasil;
c Valdinei Luís Belini, Universidade Federal de São Carlos (UFSCar), Professor Adjunto do Departamento de Engenharia Elétrica da Universidade Federal de São Carlos (UFSCar), [email protected], São Carlos, SP, Brasil.
Received: 04 May 2012 • Accepted: 22 Feb 2013 • Available Online: 12 Jun 2013
Abstract
1 Introduction
On the last years there was an elevated increase on the civil construction ield (a 42.41% increase between 2004 and 2010), being able to keep the extension between 4% and 5% for the next years [1]. In the same rate grows the number of ediications that present structural alterations, for project upgrades and en -vironmental changes reasons. In this context, there is a growing concern with the inspection of the masonry and concrete struc-tures that may present modiication or visible damages along the time.
The cracks analysis is an important security issue to be valued on civil engineering structures inspections [2], [3] and [4]. The masonry constructions inspection allows observing the stabil-ity or the increase of the opening of crack that can indicate the necessity for structural repairs. The crack opening term involves the opening of one or more cracks on masonry and concrete. The crack opening alteration is a referential item on the techni-cian’s analysis on periodic structural inspections. The inspec-tion on the damaged structure is accomplished on different peri-ods to the identiication of possible cracks alterations.
A crack opening constant monitoring method is the use of the mechanical or electrical strain gages, installed between two damaged structures. On another method, the conventional mea-surement is obtained by an inspection technician, with a dimen-sional metrology instrument manually placed on the damaged structure. On the reading of a crack opening, the technician ob-serves on the instrument the measuring trait and the scale value correspondent to the crack opening.
The direct observation on conventional measuring is a very thorough and exhausting task, and it depends on the techni -cian’s experience. Besides that, factors as tiredness, fatigue and distractions can contribute to different crack dimensions registers from the actual dimension. Although this manual tech-nique is known and low priced, the time requested for measure-ment and the imprecision on the results have been motivating the researches for automatic methods.
The present paper’s objective is to contribute with a tool for comparative analysis of the crack opening on masonry and concrete. The purpose is to reduce the inspection technician’s workload, facilitating and presenting more exact and consistent results (smaller repeatability error).
Many works have been proposing the automation of the identii -cation and valuation of the increase rate of cracks on masonry. Some works have utilized video images, applying color contrast techniques between concrete and grout aggregates [5], and on the detection of crack on pavement artiicial neural networks were used [6]. However, other works have used image process -ing routines in order to identify cracks on masonry, with Fourier analysis application [7], and on cracks edges detection apply -ing image binarization techniques [8], [9] and [10]. Images of surfaces on masonry prepared with luorescence marker were analyzed for micro-cracks’ detection [11]. Spatial ilters on col -ored image were applied to perform the crack region separa-tion from the rest of the image [12]. The Sobel and Canny edge detectors, associated to the Fast Fourier transform [13], were used to identify the region occupied by masonry cracks. With an image processing algorithm applying the Hough transform,
the veriication of the crack’s length and width (opening) were obtained [14]. Canny’s edge detector and Otsu’s thresholding [15] were utilized to identify cracks on concrete tubes. Cam -eras’ optical measuring and Green-Lagrange’s expression [16] are tools that were applied to measurement on cracks. Texture ilters on the interest surface area [17] were used for crack iden -tiication. With webcams and images tools’ from Matlab software [18], it is possible to ind and measure the masonry’s cracks. On the math algorithm applying [19] occurs cracks’ detection by the difference of relections of thermographic light radiation from the masonry intact area. The cracks are also identiied by an algorithm applying a median ilter on the image [20]. The digital photogrammetry techniques [21] and [22] are utilized to measure the cracks’ dimensions and to estimate civil engineer-ing structural deformations.
Despite the accuracy and consistency of the results presented by the discussed proposals, the performance of most of the au-tomatic systems is presented utilizing a ixed platform to ac -complish the measurement. Speciically, the ixed platform is composed of a video camera to the image acquisition and a personal computer (PC) to execute the processing algorithms and image analysis. This requirement contributes to the partial restriction of the use of these methods in research laboratories or speciics environments.
The increase of the data processing and data storage capacity, associated to the integration of high resolution video cameras on the modern mobile phones with low prices, have been al-lowed the substantial enlargement of these sophisticated mobile devices’ applications. Accordingly, this article proposes the au-tomation of the masonry and concrete cracks dimensional com-paring (structural masonry or closure masonry), starting with the hardware and software integration in only one mobile platform. To reach such objective, this proposal used as mobile platform the mobile phone Samsung model Omnia WSGH-i677 UG, 1.4 GHz processor and 512 MB (RAM) and Windows Phone 7.5 operational system.
In this paper an important contribution is the reduction of the technician subjectivity on the monitoring of the crack opening and the uncertain statistics, when compared to the conven-tional method.
Although the mobile platforms processing capacity has in-creased during the last years, the image processing algorithm originally developed on PC software are still computationally more complex to be executed directly on mobile phones. In this context, the optimization of an image processing algorithm, typi -cally utilized on PC, in a way that it may be executed on a mobile phone, represents another important contribution of this work. The article is organized as follows. The Section 2 presents the necessary procedures on the conventional measurement on the evaluation of the masonry crack’s growth. The proposed moni-toring system is described on Section 3. The Section 4 presents the image digital processing and the Section 5 discusses the obtained results. The conclusions are on Section 6.
2. Conventional method
On a conventional procedure, the inspection technician veri-ies the growth of the crack opening through a period of time, by means of manual measurement. This kind of manual measuring on
the masonry crack opening, which may change the quantitative analysis. Other factor that could impose some dificult on the con -ventional measuring is the irregular forms of the cracks on ma-sonry. Besides that, with the quoted conventional instruments it is not possible to detect rapidly small variations on the crack open-ing, due to its resolution and to the used technique. As a result, it becomes necessary to make several measures in order to obtain a conclusive measure.
On the conventional measuring procedure there is an uncertain-ness associated to the handling of the instrument by the techni-cian. This way, the conventional measuring methods may gen-erate different readings between inspection technicians, for the same crack on masonry or concrete region. This inconsistency demands a higher number of repetitive measures to have more accurate values.
On the continuous crack monitoring method, the electric or me-chanical strain gages instrument is installed between the damaged structures [21], but demands the permanency of it between the periodic inspections.
With the purpose of reducing the inspection technician work load and the generation of more accurate results this proposal aims to automate the identiication of the crack opening on masonry and inspections is conducted by the technician that uses a measuring
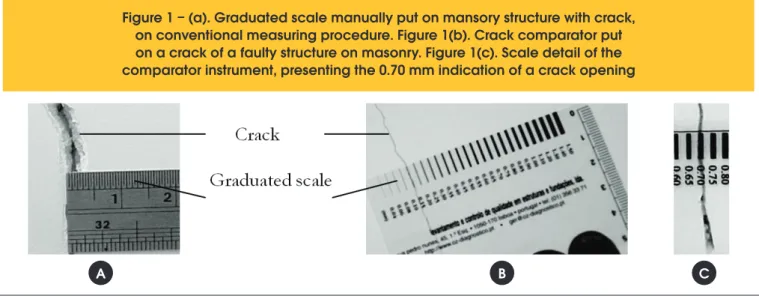
tool, such as a graduated scale or cracks’ comparator. Figure 1 shows one of the most used tools of the conventional method for measuring cracks opening. The main problems about those mea-suring by comparing methods could be enumerated as low accu-racy and traceability, subjectivity on reading and the dificulties on recording data [23].
Another dimensional instrument with better resolution applied on the conventional measuring procedures is the digital pachymeter, illustrated in the Figure 2(a).
On other conventional measuring procedure, the technician uti-lizes blades calibrator with thickness between 0.1 mm and 2.0 mm. In this procedure the technician must choose and insert the metallic blade in the crack opening, as shown in the Figure 2(b). Another inconvenient on the blades calibrator procedure is the constant insertion of metal blades. Besides the time spent on changing the blades for the measuring, the insertion of the blades may lead to further degradation on the crack opening area, which could cause both mistaken measures and compromising the in-spection process.
The conventional dimensional metrology instruments present subjectivity on the manual positioning during the measuring of
Figure 1 – (a). Graduated scale manually put on mansory structure with crack,
on conventional measuring procedure. Figure 1(b). Crack comparator put
on a crack of a faulty structure on masonry. Figure 1(c). Scale detail of the
comparator instrument, presenting the 0.70 mm indication of a crack opening
A
B
C
Figure 2 – (a). Digital pachymeter on a conventional procedure of a crack on
masonry conventional measuring. Figure 2(b). Calibrator instrument formed
by blades. This instrument on a conventional measuring allows a comparative
verification between the crack openingon mansory and the blade's thickness
A. P. MArtins | J. C. PizolAto Junior | V. l. Belini
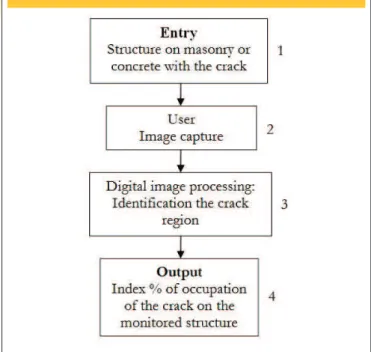
The proposed method objective is to achieve the percentual index of the crack area on the structure on masonry or concrete image. The block diagram in the Figure 3 shows the proposed method. The entry of the proposed method (block 1 in Figure 3) corre-sponds to a masonry or concrete structure with crack as shown in Figure 1 (masonry structure).
The block 2 on Figure 3 represents the capture of a cracked struc-ture’s image using a mobile phone, and this image is digitally pro-cessed on block 3. The digital processing inal result, whose algo -rithm will be detailed on Section 4, consists on the identiication of the pixels that represent a crack region on the image. Starting from this information it is possible to indentify a crack region on the image.
The block 4 of Figure 3 has as function calculating the percentual index of occupation of the crack on the monitored structure image. However, the proposed method is sensitive to sideways displace -ment and to the distance of the mobile phone to the structure with the crack being analyzed. Thereby, it was proposed the application of a support base for the positioning and alignment of the mobile phone’s photographic camera in relation to the crack region, as shown in Figure 4(a). Figure 4(b) illustrates in detail the structure’s directional guide and the acquisition system’s support base from Figure 4(a). This guide was proposed with the objective of aligning correctly the image acquisition system to the masonry structure. Thereby, the acquisition system’s support base allows keeping a constant positioning of the mobile phone camera in relation to the monitored structure on periodic inspections.
concrete. The next section presents the proposed method for the crack monitoring and the image acquisition.
3. Proposed methodology
This paper work fundaments itself on the application of digital pro-cessing techniques on images in the spatial domain using a mobile phone. As a result, the implemented algorithm works directly math-ematical morphology of the pixels on images previously converted to binary matrix.
Figure 3 – Block diagram of the proposed
method for the identification of crack growth
Figure 4 – Image acquisition of the proposed vision system. (a). mobile phone positioned on the support
base on a masonry structure. In this case a 200 mm focal length was
adjusted between the mobile phone's camera and the masonry structure.
(b). Masonry structure directional guide put on the support base of the proposed image acquisition system.
(c). Internal view of the proposed system's support base and the detail
of the opening for the device's camera localized behind the illumination
A comparative test for different distances between the masonry structure and the mobile phone camera (focal length) was made. The test allowed inding that, for distances bellow 120 mm occurs the distortion of the im -age seen on the mobile phone’s screen. This im-age distortion is noticed by the user, because it shows the cracks with bigger ends compared to the real dimension. There was also veriied that with focal length above 280 mm occurs the absence of the visualization of the crack beginning appearances, and bigger repeatability errors on measurements. In this case, the optimized focal length, in order to avoid distortions or crack identiications losses on the image, corresponds to 200 mm.
In Figure 4 it is illustrated the proposed acquisition system that uses the mobile phone on the crack on masonry image acquisition and processing.
Another characteristic of the proposed acquisition system is the illumination system with a lamp directed to the crack’s region, as illustrated in Figure 4(c). The implemented illumination system has as objective avoiding luminosity interferences, for example, the alteration of the environment light, shadows or relexes during the image capture process. The illumination system avoids bigger errors on the repeatability of reading of the proposed method. In Figure 4(c) it is possible to observe the details of the circular illumi-nation device positioned at the image acquisition system.
The mobile phone can easily be removed from the acquisition sys-tem in order to be utilized to its usual communicational applica-tions, as can be seen in Figure 4(a).
4. Digital image processing
The proposed digital processing is accomplished at the spatial plan of the image obtained from the structure on masonry or con-crete. This processing acts directly on the pixels’ morphology of image. Figure 5 illustrates the blocks diagram of the proposed im-age processing.
The block 1 in Figure 5 represents the cracked structure on ma-sonry or concrete image obtained by the acquisition system de-scribed on Section 3. A crack on masonry image illustrated in Fig-ure 6(a) is quantized on 256 gray levels.
On the block 2 of the block diagram from Figure 5, the image with 256 gray levels from Figure 6(a) is represented on the matrix form by the function f(x, y), when x and y represent, respectively, the coordinates for row and column in each pixel position.
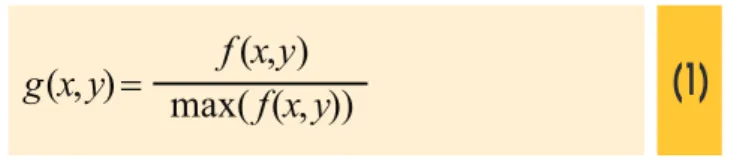
The block 3 in Figure 5 normalizes the pixels intensity values (0-255) for the interval between 0 and 1. This calculation is accom-plished based on the equation (1) and the new values are stored on the matrix g(x, y).
(1)
)
,
(
))
,
(
max(
)
,
(
x
y
f
x
f
y
x
y
g
Where: f(x, y) is the original intensity value(0≤ f(x, y) ≤ 255);
max(f(x, y)): is the highest value for the matrix f(x, y) and g(x, y) is the resultant matrix with normalized values (0≤ g(x, y) ≤ 1). The function of the block 4 in Figure 5 is to implement the bina-rization process of the matrix g(x, y). In this case, was applied the segmentation technique for image thresholding as described on [24] and mathematically described by the equation (2).
(2)
L
y
x
g
L
y
x
g
y
x
h
)
,
(
se
0
,
)
,
(
se
1
)
,
(
On the proposed method the image’s threshold L on equation (2) is adjusted by the user in the beginning of the crack detection pro -cess. The value is determined aiming to identify the beginning of the crack’s appearance in reason of the tonality on the structure on masonry or concrete. The surface of the structure that will be moni-tored must be prepared, and will be described on the next section. In the obtained results, the threshold value was equal 130 on all of the proposed method monitoring.
Figure 6(b) illustrates the binary image resultant of the process accom-plished by the block 4. The measuring of the interest pixels quantity is accomplished by the block 5 (Figure 5) that implements the equation (3).
(3)
q
m
p
n
N
n
M
m
Q
1
0
1
0
A. P. MArtins | J. C. PizolAto Junior | V. l. Belini
Where N and M represent the quantity of rows and columns on the image, and Q represents the quantity of interest pixels on the image.
Finally, the block 6 in Figure 5 calculates the percentual of the region occupied by crack on the input image. This percentual is obtained at the comparison between the quantity of crack pixels and the total pixels quantity on the image. This pixels compari -son is accomplished independent of the opening, length and index (quantity) of the cracks found on the input image.
The processing algorithm output information, which corresponds to the percentual of crack occupation of the structure on masonry, is exhibited directly on the mobile phone’s screen.
5. results and discussions
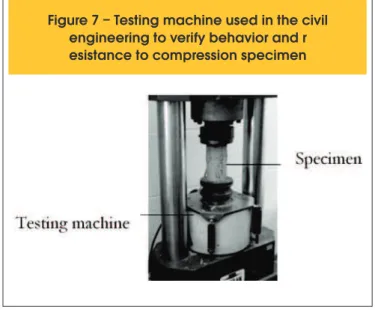
The performance and eficiency evaluation of the proposed meth -od was conducted by means of comparisons between measuring recorded by the mobile phone and those from the conventional method, on different crack openings. The comparisons between the proposed and the conventional method were accomplished on concrete specimen with standard shape, on a compression test machine. The proposed method may be applied on masonry and concrete structures. The objective of the experiment with speci -men and testing machine was to obtain cracks for di-mensional analysis in a faster way, in comparison to the collect on periodic inspections on masonry.
Different types of specimen composition may be used, once the experiments do not take into account the mechanical characteris -tics of the specimen. Figure 7 illustrates a specimen in the com -pression test machine.
The experiment with the testing machine was carried out on six cylindrical specimens, with a diameter of 100 mm and length of 200 mm with perpendicular faces. The surface monitored with the proposed system (masonry or concrete) was prepared by adding white acrylic paint on the specimen surface in order to facilitate the subsequent crack observation. In the experiment were recovered three specimens that presented bigger cracks focused on the
fron-tal region of the testing machine. The specimens were chosen aim-ing to facilitate the measuraim-ing by the conventional method and the positioning of the acquisition system, for the image capture on the proposed method. After the breaking beginning of the specimen, an advancement of compression’s axis of the testing machine, was applied gradually, which promoted proportional and observables crack increases on the specimen.
The conventional measuring of the crack opening was performed by two technicians, using initially a 0.5 mm resolution graduated scale. Due to the low scale resolution, other conventional mea-suring was accomplished utilizing a 0.01 mm resolution pachym-eter. On the comparison experiment were accomplished in each method (proposed and conventional) four measures, resulting in 22 average measures to be presented in this section. The techni-cians that performed the monitoring in a conventional method also used the proposed system on the same conditions and specimens.
Figure 6 – (a). Image of crack on masonry represented in Gray-level
with 256 levels of grey. 6(b). Image after binarization process
A
B
On the measuring comparison, the values of the proposed meth-od, that resulted the following graphics were collected, processed and presented to the user directly on the mobile phone’s screen. Figure 8 presents a graphic illustration external to the mobile phone, with the increase rates of the crack opening registered by the proposed system on three different specimens. The measuring values were obtained on 22 gaps of advancement application axis of compression of the testing machine. The measuring was accomplished on the three specimens after the appearance of the first crack.
The other results analysis in this section refers to the speci-men number three. This specispeci-men was chosen due to its best visual positioning of the cracks disposed in the testing ma-chine, because the specimen is not withdrawn after the begin-ning of the compression test. Another factor was the improve-ment of the comparison with the proposed method against the conventional method, due to the bigger amplitude of the crack opening observed.
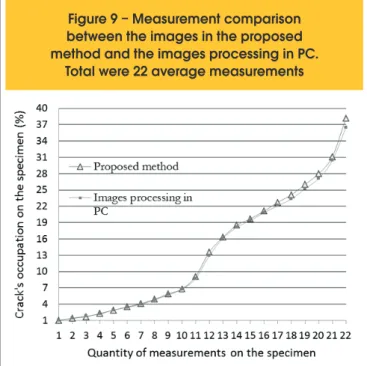
To validate the proposed method, the captured images were submitted to a comparative test with off-line processing on PC. In that comparison it was employed a toolbox image process -ing (Matlab) and a pixels count-ing algorithm. Figure 9 illus -trates the results comparision on PC image processing mea-suring and the proposed method.
The proposed method followed the referential measuring of the processed algorithm on the PC software and the difference between the methods represents a value below 1.4%.
On a periodic inspection, the technician verifies the increase or stabilization of the crack in relation to the period of time between monitoring, without the metric relation between the crack on masonry and the image. It is only considered the difference of occupation of the crack during the observed
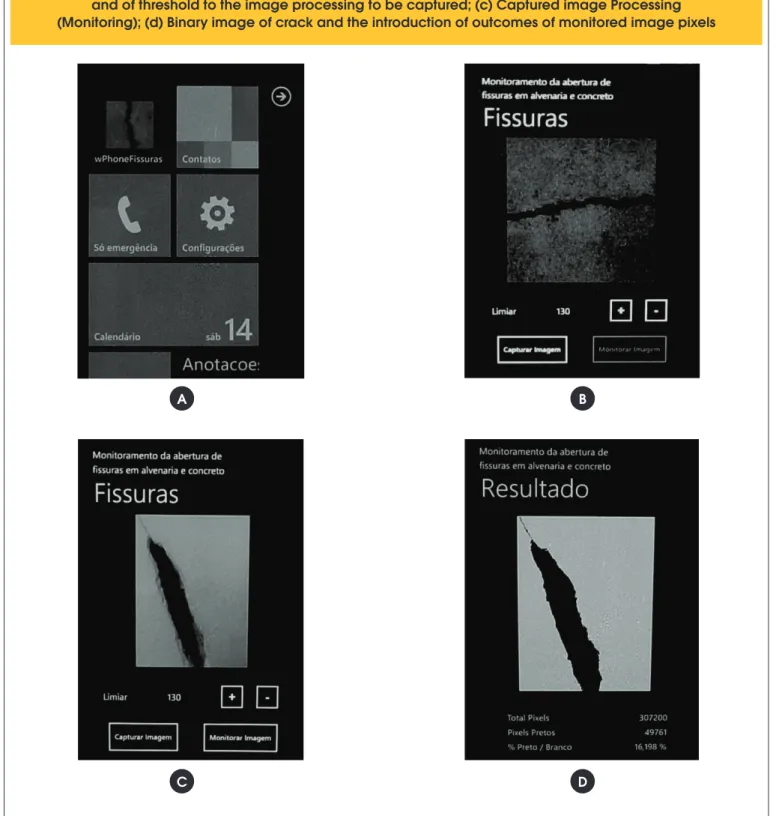
im-ages. Figure 10 presents the real mobile phone’s screens on the proposed method.
Figure 10 (c) presents a captured image of the masonry struc-ture with different dimensions on the crack opening. Figure 10 (d) presents the binary image with a total result of 307200 pixels, and 16.198% of crack occupation (black pixels) on the monitored image. Regardless the length, index and opening dimension, all the visible by eye cracks were processed by the proposed method.
Figure 11 presents a comparative analysis between measures presented by the use of a graduated scale, a digital pachym-eter and the proposed method. Due to the difference between the proposed method and the measures obtained with the use of a graduated scale (9% and 34%, respectively), the values adopted as reference on the conventional method were ob-tained with a digital pachymeter, with measuring variations be-tween 4.2% and 4.9%.
The same region of the specimen presenting crack opening was utilized on all measures, regardless the measuring meth-od. The use of the scale and pachymeter demanded more time to obtain the conventional measures, due to the two measures of the two technicians on each instrument. The successive measures were necessary to obtain the corresponding aver-ages for each phase of the cracks evolution, and are illustrated in Figure 11. In total seven cracks were observed during the period of the specimen compression on the testing machine. Along that procedure of compression, significant differences on the dimensions of the crack opening were observed. Different from the conventional technique, that demands extra calculations from the manual readings, the proposed method the percentual of crack occupations as the images were cap-tured. The 0.5 mm resolution of the graduated scale, associ-ated to the difficulty of preview (scale reading and positioning on the crack) contributed to produce measures with higher
er-Figure 8 – Area % occupied by cracks on the
specimen obtained in the proposed
method with the mobile phone device.
There were 22 average measurements on each one
of three specimen during the comparison experiment
Figure 9 – Measurement comparison
between the images in the proposed
method and the images processing in PC.
A. P. MArtins | J. C. PizolAto Junior | V. l. Belini
rors. The pachymeter, in turn, presented readings directly on the instrument screen, with the disadvantage of the necessity of manual positioning over the crack on the specimen. The re-peatability errors on the measuring of the pachymeter and on
Figure 10 – Processing of an image in the mobile phone with Windows Phone System: (a) system
selection of image capture to be processed (wPhoneFissuras); (b) System selection (Home screen)
and of threshold to the image processing to be captured; (c) Captured image Processing
(Monitoring); (d) Binary image of crack and the introduction of outcomes of monitored image pixels
A
C
B
D
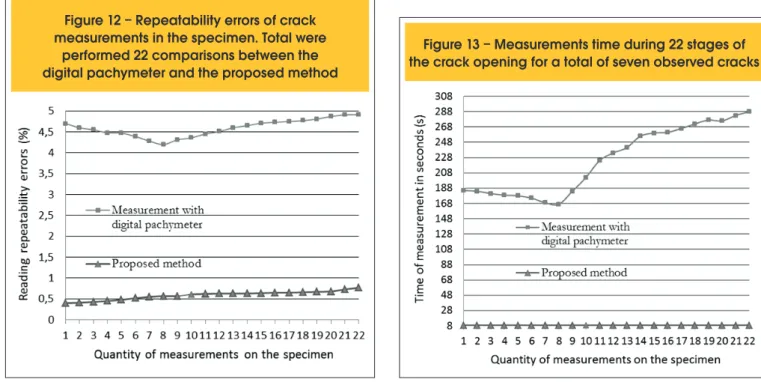
the proposed system, for each phase of the crack opening are illustrated in the Figure 12.
the automatical method independent of the amount of measures accomplished. The pachymeter presented a repeatability error between 4.2% and 4.9%. In particular, these errors were higher during the beginning of the only crack opening observed, on each the crack dimensions are close to the pachymeter resolution. Starting from the 9th measuring with the pachymeter there is an
in-crease on the repeatability error due to a bigger index of cracks on
Figure 11 – Measurement comparison
between the proposed method, conventional
method with graduated scale and digital
pachymeter in 22 measurements in the specimen
Figure 12 – Repeatability errors of crack
measurements in the specimen. Total were
performed 22 comparisons between the
digital pachymeter and the proposed method
Figure 1
3 – Measurements time during 22 stages of
the crack opening for a total of seven observed cracks
the evaluated specimen. On the other hand, the proposed method gathered better results due to its capacity to detect and count minors quantities of pixels for the same phase of increase of the cracks on the specimen, presenting a 0.42% and 0.77% repeatability error. A performance evaluation for the proposed method (Figure 13) shows that it was necessary nine seconds to capture and process an image with up to seven cracks on the specimen against an av-erage of 235 seconds for the conventional method. Those dura-tions correspond to 22 measures collected on the same specimen. It is observed in Figure 13 that the time demanded by the conven-tional measuring until the 8th measure is contrary to the increaseof the only crack opening observed on the specimen. It is also observed that the time demanded by the measuring of the 9th and
22th measures is directly proportional to the increase of the index
of cracks identiied on the specimen.
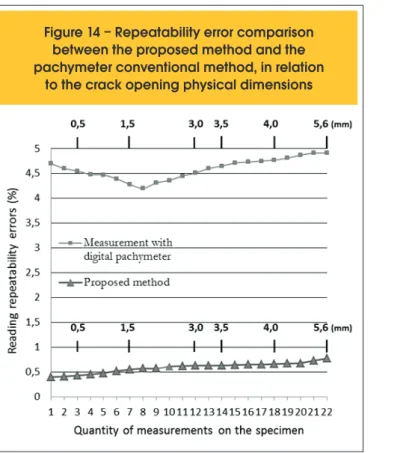
The comparison of the repeatability error in relation to the dimen-sions of the cracks is illustrated in Figure 14. It is noticed that the errors presented by the digital pachymeter outweigh the ones found in the automatical method. The outcomes in Figure 14 indi-cate that, as the only observed crack grows in dimension until the 8th measure, smaller are the errors registered by the conventional
method. That behavior occurred due to the higher facility to view the crack increase, along the compression test.
In Figure 14, as the new cracks arise in initial phase, the error becomes higher. In these cases, the error for the conventional method increased from 4.2% to 4.9% between the 9th and 22th
measures. On the other hand, the error exhibited by the proposed method increased slightly at the end of measures, due to the high-er quantity of pixels that the crack occupied. Howevhigh-er, that impreci -sion remained below 1% during all measures.
6. Conclusions
A. P. MArtins | J. C. PizolAto Junior | V. l. Belini
Figure 14 – Repeatability error comparison
between the proposed method and the
pachymeter conventional method, in relation
to the crack opening physical dimensions
by means of an image processing algorithm in a mobile platform. The comparative experiments were accomplished between the vi -sion system proposed and the conventional crack opening mea-suring method. In the comparing, it was used the compression test on specimen, for the faster acquisition of different cracks dimen-sions. The results demonstrated that the proposed dimensional crack monitoring method overcame in various aspects the conven-tional technique. The vision system presented in this work, which uses a mobile phone for the image acquisition and processing, produced the following results:
n Smaller subjectivity on the identiication of alterations on the crack
region, without depend of the technician’s experience on reading and interpreting procedures of the metrology instruments;
n More accurate and reliable results, regardless the index of the
cracks found and of the observed crack opening dimensions;
n The percentual index of the cracks area is obtained directly on
the mobile phone’s screen as the images are captured and pro-cessed, differently of the conventional method that demands exhaustive measuring and off-line calculations to achieve the results;
n The shorter measuring time, constant and independent of the length, form and index of crack found, represented other attrac -tive results;
n With the proposed method is possible to share the data obtained on the cracks monitoring by means of mobile communication. The use of a mobile phone with the support base offers repeatability on the positioning of the proposed method in the crack area analy-sis. An advantage of the support portable base (light and small) is the mobility, especially interesting when different analysis must be conducted on different environment with masonry structures.
The cracks monitoring on this present work may also be ap-plied on the analysis of the behavior of different concrete com-posts submitted to mechanical trials, with a crack evolution observation.
7. Acknowledgements
The authors would like to thank the Department of Electrical En-gineering of both the State University of Londrina (UEL) and the Federal University of São Carlos (UFSCar) for their technical support for conducting the present research and experiments.
8. references
[01] CBIC - CÂMARA BRASILEIRA DA INDÚSTRIA DA CONSTRUÇÃO, Informativo Econômico Construção Civil: Desempenho e Perspectivas, Banco de Dados, Brasília – DF, disponível em:
http://www.cbicdados.com.br/iles/textos/064.pdf, Dezembro 2011, p.6.
[02] PARK, H. S.; LEE, H. M.; ADELI, H.; Lee, I. A new approach for health monitoring of structures: terrestrial laser scanning, Computer-Aided Civil and Infrastructure Engineering, v. 22, n. 1, 2007, p.19–30.
[03] YAMAGUCHI, T.; HASMUTO S. Practical Image Measurement of Crack Width for Real Concrete Structure. Eletronics and Communications in Japan, v. 92, n.10, 2009, p. 1–12.
[04] CHEN, B.; Liu, W. Mobile agent computing paradigm for building a lexible structural health monitoring sensor network, Computer-Aided Civil and Infrastructure Engineering, 2010, v. 25, n.7, p. 504–16.
[05] GUDMUNDSSON, H.; CHATTERJI, S.; JENSEN, A. D.; THULOW, N.; CHRISTENSEN, P. The Measurement of paste content in hardened concrete using automatic image analyzing technique, Concrete Research. 1979, v.9, p. 607–612.
[06] KASEKO, M.S.; LO, Z.P.; RITCHIE, S.G. Comparison of traditional and Neural Classiier for Pavement-Crack Detection, Journal of Transportation Engineering – ASCE, 1994, v.120, n.4, p. 552–569.
[07] ISSA, M.A.; HAMMAD, A.M. Assessment and Evaluation of Fractal Dimension of Concrete Fracture Surface Digitized Images. Cement and Concrete Research, 1994, v.24, n.2, p. 325–334.
[08] TILLOTSON, H. T.; SNAITH M. S.; HUANG, Y. Detecting cracks by image analysis on a parallel computer, in Proceedings of the International Computing Congress, ASCE, Boston, 1998, p.11–23.
[09] CHEN, L. C.; JAN, H. H.; HAUNG C. W. Mensuration of Concrete Cracks Using Digital Close-range Photographs, in Proceedings of the 22th Asian Conference on Remote Sensing, Singapore, 2001, p.1248–1253.
[11] AMMOUCHE, A.; RISS, J.; BREYSSE, D.; MARCH AND, J. Image analysis for the automated study of microcracks in concrete, Cement and Concrete Composites, 2001, v.23, p.267–278.
[12] SCHUTTER, G. D. Advanced monitoring of cracked structures using video microscope and automated image analysis. NDT&E International, 2002, v.35, p.209–212.
[13] QADER, A.L.; ABUDAYYEH, O.; KELLY, M.E. Analysis of edge-detection techniques for crack identiication in bridges, Journal of Computing In Civil Engineering, v. 17, n. 4, p. 255–263, 2003.
[14] SOHN, H.G.; Lim, Y.M.; YUM, K.H.; KIM, G.H. Monitoring Crack Changes in Concrete Structures, Computer- Aided Civil and Infrastructure Engineering, 2005, v.20 p.52–61.
[15] SINHA, S. K.; FIEGUTH P. W. Automated detection of cracks in buried concrete pipe images. Automation in Construction, 2006, v.15 p.58–72.
[16] LECOMPTE, D.;VANTOMME, J.; SOL, H. Crack Detection in a Concrete Beam using Two Different Camera Techniques, Structural Health Monitoring, 2006, v.5, p.59–68.
[17] YAMAGUCHI, T.; NAKAMURA, S.; SAEGUSA, R.; HASHIMOTO, S. Image-based Crack Detection for Real Concrete Surfaces, IEEJ Transactions On Electrical and Electronic Engineering, 2008, v.3, n.1, p.128–135.
[18] BERNSTONE, C.; HEYDEN, A. Image analysis for monitoring of crack growth in hydropower concrete structures, Measurement, 2009, v.42, p.878–893. [19] SHAM, F. C.; XU, W. T.; LO, T. Application of lash
thermography for crack identiication in concrete materials, Insight - Non-Destructive Testing and Condition Monitoring, 2010, v.52, n.9, p.494–497. [20] FUJITA, Y.; HAMAMOTO, Y. A robust automatic
crack detection method from noisy concrete surfaces, Machine Vision and Applications, 2011, v.22,
p.245–254.
[21] BARAZZETTI, L.; SCAIONI, M. Crack Measurement: Development, Testing and Applications of an Automatic Image-Based Algorithm, ISPRS Journal of Photogrammetry and Remote Sensing, Lecco, Italy, 2009, p.285–296.
[22] BARAZZETTI, L.; SCAIONI, M. Development and Implementation of Image-based Algorithms for Measurement of Deformations in Material Testing, Sensors, 2010, v.10, p.7469-7495.
[23] AVAK, R.; SCHWUCHOW R.; MARCEL, F. Concrete- crack monitoring using digital image processing techniques, Bautechnik, 2007, v.84, n.6, p.403-408. [24] GONZALEZ, R. C.; WOODS, R. Digital Image