*e-mail: [email protected]
INTRODUCTION
Metallic materials for use at high temperatures are usually iron, nickel or cobalt based alloys. The oxides formed on these alloys in oxidizing environments are not suficiently protective above 500 °C. Hence, chromium and/ or aluminium are added to these alloys to establish more protective oxides (scales) of chromium dioxide or alumina. Protection of the alloys by the chromium dioxide or alumina layer can be compromised by spalling or cracking of the oxides, often caused by growth or thermal stresses. The use of reactive elements, especially rare earths (RE) to improve high temperature oxidation resistance of chromium dioxide and alumina forming alloys is quite well documented. 1-14 The improvements are in the form of reduced oxidation rates and increased scale adhesion. The RE can be added to the alloy in elemental form or as oxide dispersions. It can also be applied as an oxide coating to the alloy surface. 3-7,15 Various mechanisms have been proposed to explain the effect of reactive elements in improving oxidation resistance and the most widely accepted mechanism attributes it to segregation of the reactive elements to the interface or to the oxide scale grain boundaries and blocking of Cr ion diffusion though the oxide scale 8-11 Studies carried out by Seo et al., about the effect of addition of Ce, La and Y to a Fe-22Cr-0.5Mn alloy on the oxidation behavior of the alloy at 800 °C, indicated that Y was the most effective element to reduce the growth rate of the oxide scale. 12 In recent years a number of studies have been carried out to exploit the beneits of rare earth additions on oxidation behavior of chromium dioxide and alumina forming alloys. 13,14,16-21 Most studies reporting the reactive element effect in chromium dioxide forming alloys were carried out at or below 800 °C. A limited number of
studies have reported this effect at temperatures above 950 °C, probably attributable to formation of volatile CrO3. To throw more light on reactive element effect at a higher temperature and after prolonged periods when CrO3 formation is likely, this paper reports the effect of Y2O3 coating on oxidation behavior of Fe-20Cr alloy at 1000 °C for 200h.
METHODS AND MATERIALS
The Fe-20Cr alloy (composition in wt-% - 19.7Cr, 0.79Mn, 0.02Si and balance Fe) was prepared in a vacuum induction furnace and the cast ingot was forged at 980 °C. Rectangular specimens with total area of approximately 4 cm2 were cut from the forged bar and its surfaces prepared by grinding with SiC paper to mesh size 220. The specimens were then degreased with acetone, dried and weighed in an analytical balance. A dispersion of Y2O3 powder (99.99% purity) in ethanol was prepared and sprayed with an airbrush on to the different sides of the specimens at room temperature. The Y2O3 ilm coated specimens were then dried in air. The coating did not peel or dislodge indicating adequate adhesion. The coated specimens were again weighed. All the oxidation measurements were carried out in triplicate. Two sets of oxidation measurements were carried out. The irst consisted of heating the bare and Y2O3 coated specimens in air in a mufle furnace at 1000 °C for 200 h. The mass gain per unit area of the different specimens was determined. The second set of measurements was cyclic oxidation wherein each cycle consisted of heating the bare and Y2O3 coated specimens for 7 h at 1000 °C followed by cooling to room temperature. This was repeated 15 times. The mass gain per unit area of the bare and Y2O3 coated specimens was recorded after
High Temperature Oxidation Behavior of Yttrium Dioxide Coated Fe-20Cr Alloy
Marina Fuser Pillisa*, Olandir Vercino Correaa, Lalgudi Venkataraman Ramanathana
aMaterials Science and Technology Center, Instituto de Pesquisas Energéticas e Nucleares – IPEN,
Av. Prof. Lineu Prestes, 2242, CEP 05508-000, São Paulo, SP, Brazil
Received: July 7, 2015; Revised: February 2, 2016; Accepted: March 11, 2016
Long term isothermal and cyclic oxidation behavior of yttrium dioxide (Y2O3) coated Fe-20Cr alloy was studied. Oxidation tests were carried out in air for periods of up to 200 hours at 1000°C and the oxidation behavior of the alloy was evaluated gravimetrically. The Y2O3 coating reduced markedly the mass gain of the alloy. Energy dispersive spectroscopic analysis of scale sections on oxidized Y2O3 coated specimens revealed a Cr rich layer close to the metal/oxide interface and the presence of Y and Cr near the oxide/air interface, indicating diffusion of Cr through the Y2O3 layer. Further evidence of this diffusion was seen as change in colour of the Y2O3 coating from white to green after prolonged oxidation. X-ray diffraction analysis of the scale revealed perovskite-type YCrO3.This study attributes the increased oxidation resistance of the Y2O3 coated Fe-20Cr alloy to increased oxygen ion diffusion through the Cr2O3 scale due to YCrO3 formation and grain boundary segregated Y ion blocking alloy cation diffusion.
each cycle. The oxidation products on the specimen surfaces were examined using a scanning electron microscope and micro-regions on the oxidised specimen surfaces analyzed using an energy dispersive spectrometer (EDS). The chemical composition of the oxide scales was determined by x-ray diffraction (XRD) analysis.
RESULTS AND DISCUSSION
The average mass gains of the bare and Y2O3 coated Fe-20Cr alloy specimens after oxidation at 1000 °C for 200 h were 1.74 and 0.52 mg/cm2 respectively. The mass gains were due to formation of oxides of elements from the alloy and a marked decrease in mass gain of the Y2O3 coated specimen is evident. The morphological features of the three bare specimen surfaces after oxidation were identical. The surface of one of these specimens is shown in Fig.1a and it reveals undulating mounds incrusted with ine cuboids of a mixture of oxides. An EDS spectrum of this surface is shown in Fig.1b and it reveals the presence of Cr and Mn, besides oxygen. A cross section of the same specimen is shown in Fig. 1c and it reveals voids at the metal/oxide interface and near the oxide/air interface. EDS analyses at regions 1 and 2 in Fig.1c indicate Fe, Cr and Mn in quantities shown in Table 1. Region 2, close to the oxide/air interface has a high Mn content.
The XRD spectrum of the oxide on the oxidised bare specimen is shown in Fig. 2 and it reveals the oxide phases Cr2O3 and MnCr2O4. The EDS and XRD analyses data indicate that the oxide layer on the oxidised bare specimen consists mainly of Cr2O3 with MnCr2O4 spinel in the oxide near the oxide/air interface. The formation of and the location of the spinel suggests diffusion of Mn through the Cr2O3 layer, corroborating Wild’s observation based on Auger spectroscopic measurements that the Mn ion diffuses faster than the Cr ion in a Cr2O3 lattice.
22 Hua et al., reported the formation of an outer layer of Mn2O3 over a layer of a Mn-Cr spinel and this however was not observed in our study, due possibly to the lower Mn content. 16
The surface features of the three Y2O3 coated specimens oxidised for 200 h at 1000 °C were also identical and a micrograph of one of these specimens, shown in Fig.3a, reveals cuboid clusters of the Y2O3 coating. The EDS spectrum of this surface is shown in Fig.3b and it reveals the presence of O and Cr besides Y. A cross section of the same specimen is shown in Fig. 3c. This reveals a compact dark grey layer
Figure 1: Scanning electron micrographs and the EDS spectrum of uncoated Fe-20Cr alloy specimen oxidized for 200h at 1000ºC.(a) The surface; (b) the EDS spectrum of the surface; (c) cross section of the specimen.
Table 1: EDS analysis results of regions 1 and 2 in Fig.1c.
Region Elements (wt%)
O Cr Mn Fe
1 27.55 70.18 1.01 1.25
close to the alloy and EDS analyses at regions 1 and 2 revealed the elements shown in the Table 2. Region 1 is rich in Cr suggesting Cr2O3 formation by reaction of Cr from the alloy with O in the Y2O3 layer. Region 2 revealed Cr and Mn, besides Y, also suggesting diffusion of Cr and Mn through the inner Cr2O3 layer.
The XRD spectrum of the oxidised Y2O3 coated specimen is shown in Fig. 4 and it reveals YCrO3 in the scale, a perovskite oxide that formed from the reaction between Cr2O3 and Y2O3. No Mn containing phase was detected, due
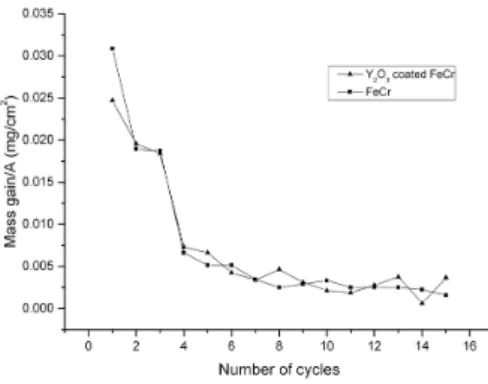
possibly to the Mn content in region 2 of Fig. 3c being very small. Considering the elements detected in regions 1 and 2 of Fig. 3c, it is evident that the YCrO3 phase forms at regions between region 1 and region 2. That is, the Cr which diffused through the Cr2O3 layer towards the Y2O3 layer forms Cr2O3 within the Y2O3 layer and these in turn react to form YCrO3. Figure 5 shows the average mass gain after each oxidation cycle of the bare and Y2O3 coated specimens. Every point in this igure represents the average value of mass gained by three specimens at the end of a speciic cycle of oxidation. The average mass gains of the bare and the coated specimens were very high during the irst four cycles and thereafter remained almost unchanged. None of the specimens spalled, even after 15 cycles. The higher mass gains during the irst four cycles of oxidation is indicative of a transient stage and formation of MnCr2O4, besides Cr2O3. Evidence of this is shown henceforth in the EDS and XRD analyses results of these specimens. After the 7th cycle the mass gains are almost constant indicating steady growth of the Cr2O3 layer.
Figure 2: XRD spectrum of uncoated Fe-20Cr alloy specimen
oxidized for 200h at 1000 ºC.
Figure 3: Scanning electron micrographs and the EDS spectrum of Y2O3 coated Fe-20Cr alloy specimen oxidized for 200h at 1000ºC. (a) The surface; (b) the EDS spectrum of the surface; (c) cross-section.
Table 2: EDS analysis results of regions 1 and 2 in Fig.3c.
Region Elements (wt%)
O Cr Mn Fe Y
1 32.4 66.6 - 1.0
The surface features of the three bare specimens after 15 cycles of oxidation were identical and Fig 6a shows the features of one of the specimens. Some thermal stress induced cracks can be seen but there is no evidence of spalling. The EDS spectrum of this surface is shown in Fig. 6b and it reveals that the oxide is rich in Cr and contains Mn, similar to that observed on specimens that were oxidised for 200 h at 1000 °C. Fig. 6c shows the cross section of this specimen and it reveals voids at the metal/oxide interface. The results of EDS analyses at regions 1 and 2 are shown in Table 3. Region 1 is a Cr rich oxide with traces of Fe and region 2, close to the oxide/gas interface reveals Mn, besides Fe and Cr. XRD analysis of the bare specimen surface after 15 cycles of oxidation revealed Cr2O3 and MnCr2O4, similar to that observed on the surface of the specimen that was oxidised for 200 h at 1000 °C.
The surface features of the three Y2O3 coated specimens after 15 cycles of oxidation were identical and as shown in Fig. 7a. No spalling was observed and the morphology of the surface oxide was similar to that of the specimen oxidised for 200 h at 1000 °C (Fig. 3a). The EDS spectrum of the surface in Fig 7a is shown in Fig. 7b. The elements Y and Cr were detected, indicating Cr diffusion to the outer layer. The cross section of the cyclically oxidised Y2O3 coated specimen is
shown in Fig. 7c. The results of EDS analysis at regions 1, 2 and 3 are shown in Table 4. Region 1 revealed Cr with some Fe, while regions 2 and 3 in the Y2O3 coating revealed Y and Cr as foreseen. The Cr content in region 3 is less than that in region 2, indicating its diffusion from the substrate through the Y2O3 layer. The results of XRD analysis of the oxide scale on the Y2O3 coated specimen oxidised cyclically revealed the phases Cr2O3, Y2O3 and YCrO3, quite similar to that on the specimen that was oxidised for 200 h at 1000 °C. Macroscopic observations of the Y2O3 coated specimens oxidised cyclically revealed that after each cycle, increasing areas of the coating became dark and eventually green. This colour change is due to chromium diffusion through the Y2O3 coating, evidence of which can be seen in Table 4.
GENERAL DISCUSSION
Oxidation of iron-chromium alloys at temperatures above 950 °C and under high oxygen pressures leads not only to formation of Cr2O3 on the surface of the alloy but reaction of the Cr2O3 with O2 to form volatile CrO3.
23 At 1000 °C and at constant oxygen pressure, mass loss caused by conversion of Cr2O3 to CrO3 is constant with time. Hence the observed mass gains of the bare and the Y2O3 coated specimens oxidised for 200h at 1000 °C indicate that the rate of Cr2O3 formation is higher than the rate of conversion of Cr2O3 to CrO3. The mass gain of the bare specimens oxidised at 1000 °C for 200 h was signiicantly higher than that of the Y2O3 coated specimens oxidised under the same conditions. This indicates that the higher mass gain of the bare specimen compared with the Y2O3 coated specimen is due to formation of signiicantly more Cr2O3 in the former and that the Y2O3 coating affects markedly the oxidation rate of the Fe-20Cr alloy. The micrographs, the EDS spectra and XRD data of the bare specimens oxidised for 200 h at 1000 °C reveal that the oxide formed was intact and its growth due to predominant alloy cation diffusion, demonstrating thus parabolic growth behaviour. The growth of oxide on the Y2O3 coated specimens oxidized for 200 h at 1000 °C was also parabolic, but due to predominant oxygen ion diffusion as shown below.
The structure and composition of the oxide formed on specimens oxidised for 200 h at 1000 °C and cyclically were identical. The scale on the bare and coated specimens
Table 4: EDS analysis results of regions 1, 2 and 3 in Fig.7c.
Region Elements (wt%)
O Cr Fe Y
1 29.92 66.58 3.5
-2 23.88 25.14 - 50.98
3 24.00 13.59 - 62.41
Figure 4: XRD spectrum of Y2O3 coated Fe20Cr alloy specimen
oxidized for 200 h at 1000 ºC.
Figure 5: Mass gain per unit area after each cycle of 7 h at 1000
°C followed by cooling to room temperature of uncoated and Y2O3
coated Fe-20Cr specimens.
Table 3: EDS analysis results of regions 1 and 2 in Fig.6c.
Region Elements (wt%)
O Cr Mn Fe
1 32.58 66.73 - 0.69
Figure 6: Scanning electron micrographs and the EDS spectrum of Fe-20Cr alloy specimen after 15 cycles of oxidation for 7 h at 1000 °C.
(a) The surface; (b) the EDS spectrum of the surface; (c) the cross-section.
Figure 7: Scanning electron micrographs and the EDS spectrum of Y2O3 coated Fe-20Cr alloy specimen after 15 cycles of oxidation for
did not spall even after 15 cycles of oxidation. Oxidation of Y2O3 coated Fe-20Cr specimens can be considered to consist of an initial transient stage during which a thin layer of Cr2O3 forms on the alloy surface. Formation of this layer has been reported to be aided by Y2O3 acting as nucleation sites. 24,25 This stage is followed by oxidation at a much lower rate with Cr diffusing through the Cr2O3 layer to form Cr2O3 in the Y2O3 coating. These two oxides react to form perovskite-type oxide YCrO3 which increases in quantity with time at temperature. In this study the scale on the Y2O3 coated Fe-20Cr specimen oxidised for 200 h at 1000 °C consisted of Cr2O3, Y2O3 and YCrO3. Chevalier and Larpin also detected Y2O3, Cr2O3 and YCrO3 in the scale on Y2O3 coated Fe-30Cr alloy oxidised at 1000 °C for 100 h and also in an equimolar powder mixture of Y2O3 and Cr2O3 heated for 288 h at 1000 °C, the latter indicating that formation of YCrO3 phase is a very slow process.
26
The lower oxidation rate of the Y2O3 coated alloy compared to the bare alloy is due to formation of YCrO3 which brings about an increase in oxygen ion vacancies in the chromia scale and consequent increase in diffusion of oxygen ions to the scale/alloy interface. 25, 27 Other studies have also reported the reduced oxidation rates of Y containing or Y2O3 coated Fe-Cr alloys to formation of YCrO3 and/or YCrO4.
26, 28-34 It has also been reported that below 1100 °C oxidation is dominated by short circuit diffusion. 35 That is, the oxide scale grain boundaries are fast diffusion paths for migrating ions. In Y containing or Y2O3 coated alloys, the Y ion in the oxide scale segregates to the grain boundaries and its radius (1.02 Å) being larger than the Cr and Fe ions (0.615 Å and 0.78 Å respectively) blocks the path of the diffusing alloy cations, decreasing thereby the oxidation rate of the alloy. 6, 36 Hence, the inluence of the Y
2O3 coating in reducing the oxidation rate of chromia forming alloys is twofold. It increases oxygen ion vacancies and thereby oxygen ion diffusion in the YCrO3 compound. It also decreases Cr ion diffusion rate along Cr2O3 grain boundaries due to the presence of the segregated Y ions. Indirect proof of segregation of Y ions to the Cr2O3 grain boundaries is evident from the marked
reduction in the rate of Cr2O3 formation on the Y2O3 coated specimen compared to that on the bare specimen oxidised at 1000 °C. Increase in oxidation resistance of chromia forming alloys in the presence of Y has been also explained by the interface segregation mechanism. 37 Seo et al., showed using depth proiling studies on Y containing Fe-22Cr-0.5Mn alloy specimens oxidised at 800 °C that Y segregated at the alloy/oxide interface and suppressed outward Cr ion diffusion.12 This mechanism may be valid to a greater extent when the reactive element is added to the alloy.
CONCLUSIONS
1. The oxide layer formed on Fe-20Cr alloy oxidised isothermally at 1000 °C for 200 h and cyclically between 1000 °C and room temperature consisted of mainly Cr2O3. This oxide layer contained MnCr2O4 near the oxide/air interface.
2. The oxide layer formed onY2O3 coated Fe-20Cr alloy oxidised at 1000 °C for 200 h and cyclically contained YCrO3.
3. Compared to the uncoated alloy a marked decrease in mass gain of the coated alloy was observed and attributed to formation of the YCrO3 phase.
4. The oxide on the specimen surfaces did not spall during the cyclic oxidation tests.
5. During the cyclic oxidation tests, the Y2O3 coating remained adhered to the substrate and its colour changed gradually from white to dark green with increase in duration of oxidation.
6. The effect of Y2O3 coating in reducing the oxidation rate is twofold. It increases oxygen ion diffusion in the YCrO3 compound and segregation of Y ion to scale grain boundaries with resultant reduction in diffusion rate of alloy cations.
REFERENCES
1. Hou PY, Stringer J. The effect of surface-applied reactive metal
oxides on the high temperature oxidation of alloys. Materials Science and Engineering. 1987;87:295-302.
2. Rhys-Jones TN, Grabke HJ, Kudielka H. The effects of
various amounts of alloyed cerium and cerium oxide on the
high temperature oxidation of Fe-10Cr and Fe-20Cr alloys.
Corrosion Science. 1987;27(1):49-63. Doi: http://dx.doi. org/10.1016/0010-938X(87)90119-3
3. Ecer GM, Singh RB, Meier GH. The influence of superficially
applied oxide powders on the high-temperature oxidation behavior
of Cr2O3-forming alloys. Oxidation of Metals. 1982;18(1-2):55-81.
4. Stringer J. The reactive element effect in high temperature corrosion. Materials Science and Engineering A. 1989;120:129-137.
5. Pillis MF, Ramanathan, LV. High temperature oxidation of rare earth chromite coated Fe-20Cr and Fe-20Cr-4Al alloys.
Materials Research. 2007;10 (3):279-282.
6. Pillis MF, Araújo, EG, Ramanathan, LV. Effect of rare earth additions on oxidation behavior of AISI304L stainless steel.
Materials Research. 2006;9(4):375-379.
7. Pillis MF, Araújo, EG, Ramanathan, LV. Effect of addition
of rare earth oxide concentrates on oxidation resistance of
AISI304L. Materials Science Forum. 2006; 530-531:99-104.
8. Yurek GJ, Przybylski K, Garratt-Reed AJ. Segregation of Y to grain-boundaries in Cr2O3 and NiO scales formed on an ODS alloy. Journal of Electrochemical Society. 1987;134(10):2643-2644. doi: http://dx.doi.org/10.1149/1.2100264
9. Cotell CM, Yurek GJ, Hussey RJ, Mitchell DF, Graham MJ. The
influence of grain-boundary segregation of yttrium in chromium
dioxide on the oxidation of Cr metal II. Effects of temperature
and dopand concentration. Oxidation of Metals. 1990;34(3-4):
201-216. Doi http://dx.doi.org/10.1007/BF00665015 10. Przybylski K, Garratt-Reed AJ, Yurek GJ. Grain-boundary
segregation of yttrium in chromia scales. Journal of
11. Papaiacovou P, Hussey RJ, Mitchell DF, Graham MJ. The effect of CeO2 coatings on the oxidation behavior of Fe-20Cr alloys in O2 at 1173K, Corrosion Science. 1990;30 (4-5):451-460.
12. Seo HS, Jin G, Jun JH, Kim DH, Kim KY. Effect of reactive elements on oxidation behavior of Fe-22Cr-0.5Mn ferritic stainless
steel for a solid oxide fuel cell interconnect, Journal of Power Sources. 2008;178(1):1-8. Doi: http://dx.doi.org/10.1016/j.
jpowsour.2007.12.026
13. Amano T. Rare earth application for heat-resisting alloys.
Journal of Rare Earths. 2010;28:12-21. Doi: http://dx.doi. org/10.1016/S1002-0721(10)60371-7
14. Wang L, Du X, Gan Y, Liu L, Ye X, Jiang L. Effect of rare
earths on oxidation resistance of heat resistant steel. Journal of Rare Earths. 2010;28:489-491. doi: http://dx.doi.org/10.1016/ S1002-0721(10)60305-5
15. Ghosh D, Mukherjee S, Das S, High temperature oxidation behaviour of yttria (Y2O3) coated low alloy steel. Surface Engineering. 2014; 30(7):524-528. DOI: http://dx.doi.org/10.
1179/1743294414Y.0000000271
16. Hua B, Pu J, Lu F, Zhang J, Chi B, Jian L, et al. Development of a Fe-Cr alloy for interconnect application in intermediate
temperature solid oxide fuel cells. Journal of Power Sources.
2010;195(9):2782-2788. doi: http://dx.doi.org/10.1016/j. jpowsour.2009.08.077
17. Guo P, Zeng C, Shao Y. Effect of LaCrO3 coating on high temperature oxidation of type 316 stainless steel. Journal of Rare Earths. 2011;29(7):698-701. doi: http://dx.doi.org/10.1016/ S1002-0721(10)60525-X
18. Zhang YD, Zhang C, Lan H, Hou PY, Yang ZG. Improvement of
the oxidation resistance of Tribaloy T-800 alloy by the addition of yttrium and aluminium, Corrosion Science.
2011;53(3):1035-1043. doi: http://dx.doi.org/10.1016/j.corsci.2010.11.038 19. Kim SH, Huh JY, Jun JH, Favergeon J. Thin elemental coatings
of yttrium, cobalt, and yttrium/cobalt on ferritic stainless steel
for SOFC interconnect applications. Current Applied Physics.
2010;10 (Suppl 2)S86-S90. doi: http://dx.doi.org/10.1016/j.
cap.2009.11.049
20. Ramanathan LV, Pillis MF, Fernandes SMC. Role of rare earth
oxide coating on oxidation resistance of chromia-forming alloys. Journal of Materials Science. 2008; 43(2):530-535. DOI: http:// dx.doi.org/10.1007/s10853-007-1855-8
21. Pillis MF, Correa OV, Araujo EG, Ramanathan LV. Oxidation behavior of FeCr and FeCrY alloys coated with an aluminium
based paint. Materials Research. 2008;11(3): 251-256. http:// dx.doi.org/10.1590/S1516-14392008000300004
22. Wild RK. High temperature oxidation of austenitic stainless steel
in low oxygen pressure. Corrosion Science. 1977;17(2):87-93.
23. Birks N, Meier GH. Introduction to High Temperature Oxidation of Metals. London; Edward Arnold; 1983.
24. Diaz LM, Zhu J, Holcomb GR, Jablonski PD, Alman DE, Sridhar S. Fundamental studies on the transient stages of scale growth in Fe-22 wt% Cr alloys. Defect and Diffusion Forum.
2009;283-286:425-431. DOI: http://dx.doi.org/10.4028/www.
scientific.net/DDF.283-286.425
25. Saito Y, Onay B, Maruyama T. The reactive element effect
(REE) in oxidation of alloys. Journal de Physique IV.
1993:3:C9-217-C9-230. http://dx.doi.org/10.1051/jp4:1993920 26. Chevalier S, Larpin JP. Formation of perovskite type phases
during the high temperature oxidation of stainless steels coated with reactive element oxides. Acta Materialia. 2002;50(12):3105-3114. doi: http://dx.doi.org/10.1016/S1359-6454(02)00106-4
27. Harris DJ, Harding JH, Watson GW. Computer simulation of the
reactive element effect in NiO grain boundaries. Acta Materialia. 2000;48(12):3039 -3048. doi: http://dx.doi.org/10.1016/S1359-6454(00)00131-2
28. Riffard F, Buscail H, Caudron E, Cueff R, Issartel C, Perrier S.
In-situ characterization of the oxide scale formed on
yttrium-coated 304 stainless steel at 1000°C.Materials Characteristics. 2002;49(1):55-65. doi: http://dx.doi.org/10.1016/S1044-5803(02)00278-4
29. Seybolt AU. High temperature oxidation of chromium containing Y2O3.Corrosion Science. 1966;6(6):263-266.
30. Ramanarayanan TA, Mumford JD, Chun CM, Petkovic RA.
Transport through chromia films. Solid State Ionics. 2000;136-137:83-90. DOI: http://dx.doi.org/10.1016/S0167-2738(00)00355-6
31. Stroosnijder MF, Sunderkotter JD, Cristóbal MJ, Jenett H, Isenbugel K, Baker MA. The influence of Yttrium ion implantation
on the oxidation behavior of powder metallurgically produced
chromium. Surface Coatings Technology. 1996;83(1-3):
205-211.
32. Tonghe Z, Jindong X, Chengzhou J, Jun C, Hong X, Jing L, et al. Influence of the structure of implanted steel with Y, Y+C and Y+Cr on the behaviors of wear, oxidation and corrosion
resistance. Surface Coatings Technology.1995;72(1): 93-98.
doi: http://dx.doi.org/10.1016/0257-8972(94)02337-9
33. Stroosnijder MF. Ion implantation for high temperature corrosion
protection. Surface Coatings Technology.
1998;100-101(1-3):196-201.
34. Cristóbal MJ, Gibson PN, Stroosnijder MF. A study of the initial
stages of oxidation of yttrium-implanted chromium using X-ray
diffraction and absorption spectroscopy. Corrosion Science.
1996;38(6):805-822. doi: http://dx.doi.org/10.1016/0010-938X(95)00168-J
35. Polman EA, Fransen T, Gellings PJ. The reactive element effect:
ionic processes of grain boundary segregation and diffusion in chromium oxide scales. Journal of Physics Condensed Matter. 1989;1(28):4497-4510.
36. Hussey RJ, Graham MJ. The influence of reactive-element coatings on the temperature oxidation of pure-Cr and high-Cr-content alloys. Oxidation of Metals. 1996;45 (3-4):349-374.
DOI http://dx.doi.org/10.1007/BF01046989
37. Hou PY, Stringer J. The effect of reactive element additions on