J Pediatr (Rio J). 2013;89(5):505---509
www.jped.com.br
ORIGINAL ARTICLE
Secular trends in sex ratios at birth in South America over the
second half of the 20th century
夽
Victor Grech
PhD. Consultant Pediatrician, Department of Pediatrics, Mater Dei Hospital, Malta
Received 1 November 2012; accepted 9 January 2013 Available online 11 July 2013
KEYWORDS Birth rate; Infant; Newborn; Sex ratio; South America; Live births; Birth rate/trends
Abstract
Objectives: Latitude gradients have been found in the male-female ratio at birth (M/F: male divided by total births), which is anticipated to be 0.515.
Methods: Annual national male and female live births by country were obtained for South America from the World Health Organization (WHO) and analysed with contingency tables. The continent was arbitrarily divided into two regions: a region 10◦above the Equator to 20◦below
the Equator, and a second area 20◦below the Equator.
Results: This study analyzed 147,773,689 live births. An overall increasing trend in M/F was found for the region >20◦ (p < 0.0001) for the entire period. For the aggregate, a significant
decrease was present for the period 1950-74 (p = 0.01) followed by a significant increase there-after (p < 0.001). A latitude gradient was also noted, with more males being born in cooler (more Southern > 20◦S) latitudes (p < 0.0001). There were 3,765,648 male births in excess of
what was anticipated.
Conclusion: The M/F ratio is increasing in South America, unlike the decline present in Europe and North America. This study also showed that M/F latitude gradients are similar to those previously reported in North America, with more males being born in cooler latitudes, contrary to the trends reported in Europe. The interplay of several poorly understood factors is likely. © 2013 Sociedade Brasileira de Pediatria. Published by Elsevier Editora Ltda. All rights reserved.
PALAVRAS-CHAVE Taxa de nascimentos; Lactente;
Recém-nascido; Proporc¸ão entre os gêneros;
Tendências seculares das proporc¸ões de nascimentos entre gêneros na América do Sul durante a segunda metade do século XX
Resumo
Objetivos: Analisar as tendências seculares e gradientes de latitude na proporc¸ão masculino-feminina ao nascimento (M/F: masculinos divididos por total de nascidos vivos) no Continente Sul Americano.
夽 Please cite this article as: Grech V. Secular trends in sex ratios at birth in South America over the second half of the 20th century.
J Pediatr (Rio J). 2013;89:505---9.
E-mail:victor.e.grech@gov.mt
América do Sul; Nascidos vivos; Taxa de nascimen-tos/tendências
Métodos: Os dados sobre nascidos vivos masculinos e femininos em âmbito nacional, durante um ano por país, foram obtidos da Organizac¸ão Mundial da Saúde e analisados com tabelas de contingência. O continente foi arbitrariamente dividido em duas regiões: a primeira: de 10◦
acima da linha do Equador até 20◦abaixo da linha Equador (10◦N-20◦S), e uma segunda abaixo
de 20◦da linha do Equador (> 20◦S).
Resultados: O estudo analisou 147.773.689 nascidos vivos. Encontrou-se uma tendência cres-cente M/F na maioria dos países próximos ao Equador (10◦ N-20◦ S) (p = 0,004). A análise
do período entre 1950 e 1974 não mostrou diferenc¸a, porém após este período (1974-1996) encontrou-se um aumento M/F (p = 0,03). Um aumento na proporc¸ão M/F foi encontrado em todo o período na região > 20◦S (p < 0,0001). Também foi observado um gradiente de latitude,
nascendo mais lactentes masculinos em latitudes mais frias (mais ao sul, > 20◦S) (p < 0,0001). Conclusão: A proporc¸ão M/F está crescendo na América do Sul, diferentemente do presente declínio na Europa e na América do Norte. Este estudo também mostra que os gradientes de latitude para a proporc¸ão M/F são semelhantes àqueles anteriormente publicados na América do Norte, nascendo mais bebês masculinos nas latitudes mais frias, ao contrário das tendên-cias publicadas na Europa. É provável o inter-relacionamento de vários fatores ainda pouco entendidos.
© 2013 Sociedade Brasileira de Pediatria. Publicado por Elsevier Editora Ltda. Todos os direitos reservados.
Introduction
In mammals, sex is determined at conception, and male births occur slightly in excess.1 The male to female ratio
of live births is generally expressed as the ratio of male live births divided by total live births. Although this would be more accurately abbreviated as M/T (male births divided by total births), it is widely (albeit technically incorrectly) abbreviated as M/F, and this will be used throughout. For humans, M/F is anticipated to be 0.515.2The reason for this
discrepancy is uncertain, but a plethora of factors have been proposed.3
It has been demonstrated that M/F varies by geograph-ical location, exhibiting a latitude gradient.4 This gradient
is different in Europe and North America, with more males born towards the south of Europe, in contrast with the North American continent, where more males are born towards the north of the continent.2
Several studies have also shown that M/F varies through time. The most striking findings have been a decline in M/F over the second half of the 20th century in various industri-alized countries.5
This study identified the secular trends in M/F in South America from a World Health Organization (WHO) dataset for the second half of the 20th century. Trends by geo-graphical latitude were also analysed. The null hypothesis was that there were no significant geographical or temporal differences in M/F.
Methods
Data sources
Annual male and female live births had been obtained directly from WHO in 2000. The original sources were con-tacted (Drs. Galea and Inoue --- personal communication) and
the data was made available as an official, comma-delimited file directly from WHO. This was imported into Microsoft Excel, which was then used for collation and analysis.
Data was available for South American countries as shown in Table 1. Data for Guyana and French Guiana were unavail-able.
South America may be divided into an area that spans from Honduras atcirca10◦ above the equator to 20◦ below
the Equator, and a second area 20◦ below the Equator and
further south (Table 1). Thus, only small parts of Bolivia and Brazil extend south and only small parts of Chile and Paraguay extend north of this arbitrary division.
Statistics
Excel was used for data entry, overall analysis, Pearson cor-relations and charting. The quadratic equations of Fleiss were used for exact calculation of 95% confidence inter-vals for ratios.6Chi-squared tests and chi-squared tests for
trends for male and female births were used throughout. The latter were applied using the Bio-Med-Stat Excel add-in for contingency tables. This add-in is based on the original work on this subject which led to the development of the Cochran-Armitage test (Dr. Peter Slezák, Institute of Normal and Pathological Physiology, Slovak Academy of Sciences, personal communication). A p-value≤0.05 was considered significant.
Results
Sex ratios at birth in South America 507
Table 1 Total male and female live births for South American countries and chi-squared for trend analysis of the male to female ratio (male divided by total births).
10◦N-20◦S Years Total males Total females chi-squared p M/F
Honduras 1960-82 337,633 311,321 19.4 < 0.0001 Decreasing
Nicaragua 1950-80 1,165,190 1,092,721 21.2 < 0.0001 Decreasing
Costa Rica 1955-95 1,399,975 1,336,144 0.2 0.621 ns
Panama 1957-87 804,604 771,563 9.4 0.002 Increasing
Columbia 1955-86 804,604 771,563 9.4 0.002 Increasing
Venezuela 1950-94 8,935,021 8,569,753 0.6 0.430 ns
Suriname 1971-90 66,136 63,900 0.6 0.427 ns
Ecuador 1958-91 3,426,138 3,321,029 0.3 0.599 ns
Peru 1958-83 6,091,806 5,810,754 1143.1 < 0.0001 Decreasing
Brazil 1979-95 20,287,666 19,433,053 1.6 0.210 ns
>20◦S Years Total males Total females chi P M/F
Paraguay 1979-80 378,698 351,387 2.8 0.096 ns
Uruguay 1950-85 1,080,347 1,042,270 1.2 0.265 ns
Chile 1955-94 5,612,609 5,385,378 0.4 0.515 ns
Argentina 1955-96 12,741,429 12,200,047 5.7 0.017 Increasing
M/F, male births divided by total births; NS, not significant.
Countries were grouped as described in Table 1 (above and below 20◦ latitude), and five-year trends for live births
are shown in Table 2.
For the region 10◦ N-20◦ S (top part of table) data was
available for some (but not all countries) up to 1995, and hence, the absolute values for male, female and total births are smaller for the last 3 columns for this region in Table 2. For the region >20◦ S, data was only available for some
countries (not all) up to 1996. Hence, the last two columns are blank and for the last column with data, the male, female and total births are smaller for the last column for this region in Table 2.
An increasing trend in M/F was found for the region >20◦
(r=0.3, chi=24, p<0.0001) for the entire period. Overall, for the aggregate (the entire continent), a significant decrease was present for the period 1950-74 (r=-0.3, chi=5.9, p=0.01) followed by a significant increase thereafter (r=0.5, chi=60, p<0.001).
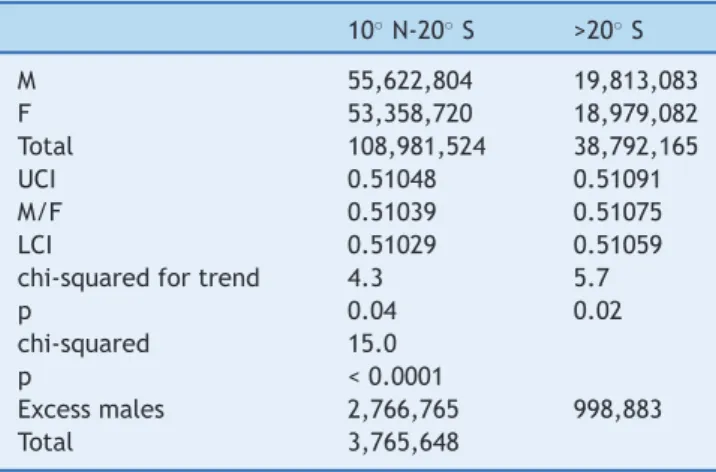
A comparison of totals for the two areas also showed a latitude gradient, with more males being born in cooler (more Southern, > 20◦S) latitudes (p < 0.0001 [Table 3]).
The male births in excess of that which would be antic-ipated based on an M/F of 0.515 were calculated (using simple proportion) at 3,765,648 (Table 3).
Discussion
Studies that analysed data prior to 1950 observed generally increasing trends in M/F. For example, it was demon-strated that M/F was rising in Scandinavia before 1950, and decreased thereafter.7This was notably true in Finland, with
a rise in M/F from 1751 to 1948, and in Denmark.8,9
A declining M/F has been observed in many industrialized countries since 1950, since the more fragile male fetus may be spontaneously aborted at a higher rate than the more robust female fetus when exposed to hypothetical deleteri-ous environmental factors.10
Adverse environmental factors or traumatic experi-ences that affect entire populations have both been shown to lower M/F. For example, M/F declines after warfare,11earthquakes,12and a multiplicity of
environmen-tal disasters.13It appears that such events promote stressed
pregnant women to spontaneously abort male fetuses to a greater extent than female fetuses.14 M/F has been
pro-posed as a potential surrogate sentinel health indicator.15
Despite these adverse factors, males are invariably born in excess of females,16 implying an even higher conception
rate of males.
A study in Europe has shown a higher incidence of male births in southern Europe, which is warmer, than in north-ern Europe.4However, a study over a longer time span that
also incorporated the North American continent not only did not confirm the European trend, but also demonstrated that more males are born in the higher and cooler latitudes of the Northern American continent than in the southern parts of that continent.2
The South American data presented in this study is in accordance with the latitude gradient described in North America, and contrary to the latitude gradient observed in Europe.2 Moreover, in contrast with North America
and Europe, M/F is increasing in South America.5 A
sim-ple calculation shows that, for the available years, there was a male birth rate in excess of the anticipated M/F of 0.515, resulting in a female birth deficit of at least 3,765,648.
Grech
V
Table 2 5 year total live births. Countries allocated as per Table 1.
10◦N-20◦S 1950-54 1955-59 1960-64 1965-69 1970-74 1975-79 1980-84 1985-89 1990-94 1995-99
M 725,478 3,071,509 4,783,209 5,222,124 5,517,285 6,590,219 11,035,634 8,569,095 9,112,465 995,786
F 692,979 2,937,077 4,579,908 5,001,977 5,307,818 6,339,781 10,610,606 8,215,357 8,723,075 950,142
Total 1,418,457 6,008,586 9,363,117 10,224,101 10,825,103 12,930,000 21,646,240 16,784,452 17,835,540 1,945,928
UCI 0.51228 0.51159 0.51118 0.51107 0.50997 0.50996 0.51003 0.51078 0.51115 0.51243
M/F 0.51146 0.51119 0.51086 0.51077 0.50968 0.50968 0.50982 0.51054 0.51092 0.51173
LCI 0.51063 0.51079 0.51054 0.51046 0.50938 0.50941 0.50961 0.51030 0.51068 0.51103
> 20◦S 1950-54 1955-59 1960-64 1965-69 1970-74 1975-79 1980-84 1985-89 1990-94 1995-99
M 143,973 2,029,194 2,169,230 2,218,864 2,351,687 2,599,872 2,632,286 2,474,446 2,511,307 682,224
F 138,442 1,955,716 2,084,128 2,121,729 2,252,650 2,472,287 2,524,486 2,372,354 2,405,342 651,948
Total 282,415 3,984,910 4,253,358 4,340,593 4,604,337 5,072,159 5,156,772 4,846,800 4,916,649 1,334,172
UCI 0.51164 0.50971 0.51048 0.51166 0.51121 0.51301 0.51088 0.51098 0.51122 0.51219
M/F 0.50979 0.50922 0.51000 0.51119 0.51075 0.51258 0.51045 0.51053 0.51078 0.51135
LCI 0.50795 0.50873 0.50953 0.51072 0.51030 0.51214 0.51002 0.51009 0.51033 0.51050
Entire continent 1950-54 1955-59 1960-64 1965-69 1970-74 1975-79 1980-84 1985-89 1990-94 1995-99
M 869,451 5,100,703 6,952,439 7,440,988 7,868,972 9,190,091 13,667,920 1,104,3541 11,623,772 1,678,010
F 831,421 4,892,793 6,664,036 7,123,706 7,560,468 8,812,068 13,135,092 10,587,711 11,128,417 1,602,090
Total 1,700,872 9,993,496 13,616,475 14,564,694 15,429,440 18,002,159 26,803,012 21,631,252 22,752,189 3,280,100
UCI 0.51193 0.51071 0.51086 0.51115 0.51025 0.51073 0.51013 0.51075 0.51109 0.51211
M/F 0.51118 0.51040 0.51059 0.51089 0.51000 0.51050 0.50994 0.51054 0.51089 0.51157
LCI 0.51043 0.51009 0.51032 0.51064 0.50975 0.51027 0.50975 0.51033 0.51068 0.51103
Sex ratios at birth in South America 509
Table 3 Summary statistics and significance testing.
10◦N-20◦S >20◦S
M 55,622,804 19,813,083
F 53,358,720 18,979,082
Total 108,981,524 38,792,165
UCI 0.51048 0.51091
M/F 0.51039 0.51075
LCI 0.51029 0.51059
chi-squared for trend 4.3 5.7
p 0.04 0.02
chi-squared 15.0
p < 0.0001
Excess males 2,766,765 998,883
Total 3,765,648
Countries allocated to the above two regions as per Table 1. F, female; LCI, lower confidence interval; M, male; M/F, male births divided by total births; UCI, upper confidence interval.
Conflicts of interest
The author declares no conflicts of interest.
Acknowledgements
Dr. Mie Inoue and Dr. Gauden Galea from the World Health Organization.
References
1. Parkes AS. The mammalian sex ratio. Hum Reprod. 1926;2:1---51. 2. Grech V, Savona-Ventura C, Vassallo-Agius P. Research point-ers: unexplained differences in sex ratios at birth in Europe and North America. BMJ. 2002;324:1010---1.
3. James WH. The human sex ratio. Part 1: a review of the litera-ture. Hum Biol. 1987;59:721---52.
4. Grech V, Vassallo-Agius P, Savona-Ventura C. Declining male births with increasing geographical latitude in Europe. J Epi-demiol Community Health. 2000;54:244---6.
5. Grech V, Vassallo-Agius P, Savona-Ventura C. Secular trends in sex ratios at birth in North America and Europe over the sec-ond half of the 20th century. J Epidemiol Community Health. 2003;57:612---5.
6. Fleiss JL. Statistical methods for rates and proportions. 2nded.
New York: John Wiley and Sons; 1981. p. 14---5.
7. Fellman J, Eriksson AW. Temporal trends in the secondary sex ratio in Nordic countries. Biodemography Soc Biol. 2011;57:143---54.
8. Jalavisto E. Sex ratio at birth and its dependence upon birth order and parental age. Ann Chir Gynaecol Fenn. 1952;41: 129---37.
9. Møller H. Trends in sex-ratio, testicular cancer and male reproductive hazards: are they connected? APMIS. 1998;106: 232---9.
10. James WH. Evidence that mammalian sex ratios at birth are partially controlled by parental hormone levels around the time of conception. J Endocrinol. 2008;198:3---15.
11. Zorn B, Sucur V, Stare J, Meden-Vrtovec H. Decline in sex ratio at birth after 10-day war in Slovenia: brief communication. Hum Reprod. 2002;17:3173---7.
12. Fukuda M, Fukuda K, Shimizu T, Møller H. Decline in sex ratio at birth after Kobe earthquake. Hum Reprod. 1998;13:2321---2. 13. Lyster WR. Altered sex ratio after the London smog of 1952 and
the Brisbane flood of 1965. J Obstet Gynaecol Br Commonw. 1974;81:626---31.
14. Byrne J, Warburton D. Male excess among anatomically nor-mal foetuses in spontaneous abortions. Am J Med Genet. 1987;26:605---11.
15. Davis DL, Gottlieb MB, Stampnitzky JR. Reduced ratio of male to female births in several industrial countries: a sentinel health indicator? JAMA. 1998;279:1018---23.