Non-Antibiotic Selectable Markers for Transgenic Plants
Hsin-Mao Wu1., Yi-Chia Kuan2., Chia-Han Chu3., Wen-Hwei Hsu2, Wen-Ching Wang1,3*
1Institute of Molecular and Cellular Biology and Department of Life Science, National Tsing Hua University, Hsinchu, Taiwan,2Institute of Molecular Biology, National Chung Hsing University, Taichung, Taiwan,3Biomedical Science and Engineering Center, National Tsing Hua University, Hsinchu, Taiwan
Abstract
Lysine racemase, a pyridoxal 59-phosphate (PLP)-dependent amino acid racemase that catalyzes the interconversion of lysine enantiomers, is valuable to serve as a novel non-antibiotic selectable marker in the generation of transgenic plants. Here, we have determined the first crystal structure of a lysine racemase (Lyr) fromProteus mirabilisBCRC10725, which shows the highest activity toward lysine and weaker activity towards arginine. In addition, we establish the first broad-specificity amino acid racemase (Bar) structure fromPseudomonas putida DSM84, which presents not only the highest activity toward lysine but also remarkably broad substrate specificity. A complex structure of Bar-lysine is also established here. These structures demonstrate the similar fold of alanine racemase, which is a head-to-tail homodimer with each protomer containing an N-terminal (a/b)8barrel and a C-terminalb-stranded domain. The active-site residues are located at
the protomer interface that is a funnel-like cavity with two catalytic bases, one from each protomer, and the PLP binding site is at the bottom of this cavity. Structural comparisons, site-directed mutagenesis, kinetic, and modeling studies identify a conserved arginine and an adjacent conserved asparagine that fix the orientation of the PLP O3 atom in both structures and assist in the enzyme activity. Furthermore, side chains of two residues ina-helix 10 have been discovered to point toward the cavity and define the substrate specificity. Our results provide a structural foundation for the design of racemases with pre-determined substrate specificity and for the development of the non-antibiotic selection system in transgenic plants.
Citation:Wu H-M, Kuan Y-C, Chu C-H, Hsu W-H, Wang W-C (2012) Crystal Structures of Lysine-Preferred Racemases, the Non-Antibiotic Selectable Markers for Transgenic Plants. PLoS ONE 7(10): e48301. doi:10.1371/journal.pone.0048301
Editor:Daniel S. Sem, Concordia University Wisconsin, United States of America
ReceivedJuly 17, 2012;AcceptedSeptember 24, 2012;PublishedOctober 31, 2012
Copyright:ß2012 Wu et al. This is an open-access article distributed under the terms of the Creative Commons Attribution License, which permits unrestricted use, distribution, and reproduction in any medium, provided the original author and source are credited.
Funding:This work was supported by grants from National Science Council (NSC-100-2325-B-007-001, NSC99-2811-B-007-006, NSC98-2313-B-007-005-MY3, NSC98-3112-B-007-004, NSC101-2321-B-007-004) and National Research Program for Biopharmaceuticals (NRPB 100ID1012), Taiwan. This work was also partially supported by Toward Word-Class University Project from National Tsing Hua University, Taiwan. The funders had no role in study design, data collection and analysis, decision to publish, or preparation of the manuscript.
Competing Interests:The authors have declared that no competing interests exist.
* E-mail: [email protected]
.These authors contributed equally to this work.
Introduction
Certain bacteria synthesize D-amino acids, e.g., D-Ala, D-Glu, D-Val, and D-Phe, for metabolic processes [1,2]. Interconversion of D- and L-amino acid enantiomers occurs not only in bacteria [3,4,5] but also in eukaryotes [6,7].
Two types of amino acid racemases are known: pyridoxal 59 -phosphate (PLP)-dependent [6] and PLP-independent enzymes [8]. Alanine racemase (Alr, E.C. 5.1.1.1), which catalyzes the interconversion of D- and L-Ala, is the best characterized of the prokaryotic and eukaryotic PLP-dependent enzymes. Several Alr crystal structures have been determined, and the structures are compact homodimers with each protomer containing an (a/b)8
barrel and a C-terminal domain having three b-sheets
[9,10,11,12,13,14]. The dimeric interface contains the active-site cleft, which is formed by residues from the (a/b)8 barrel of one
protomer and residues from the C-terminal domain of the other protomer. Structural and site-directed mutagenesis studies of
Bacillus stearothermophilus Alr (BsAlr, PDB code: 1L6G) have identified two catalytic residues: Lys39 from one subunit and Tyr265 from the other subunit [13,15,16,17]. When alanine is absent, the C4A atom of PLP forms an aldimine bond with the
Lys39 Nfof BsAlr, whereas PLP forms an aldimine bond with the amino nitrogen of the alanine substrate during catalysis [9,13].
A constricted entryway has been characterized inMycobacterium tuberculosisAlr (MtAlr; PDB code: 1XFC) [18] that is believed to be the active site. The entryway is formed by three layers of residues (outer layer: Asp357, Lys178, and Ala241; middle layer: Arg3169, Ile362, Arg2969, and Asp177; inner layer: Tyr2719, Tyr364, Tyr2909, and Ala176) (prime symbol represents the residue from the other subunit of a dimer). After the entryway, PLP is found at the base of the cavity, and importantly, the strict Alr specificity for alanine is defined by the relatively small separation (,2.7 A˚ ) between two innermost layer tyrosines: MtAlr, Tyr2719and Tyr364;Streptococcus pneumoniaeAlr (SpAlr, PDB code: 3S46 [19]), Tyr2639and Tyr352; BsAlr, Tyr2659and Tyr354[18].
In addition to Alrs, a PLP-dependent racemase is found to possess a broad amino-acid specificity (broad specificity amino acid racemase, Bar, E.C. 5.1.1.10 [20,21]). Moreover, several microorganisms, includingProteus vulgaris[22],P. putida[23],Proteus spp.and Escherichia spp. [24], have lysine racemization activities, although the genes encoding lysine racemases and the lysine
racemases themselves have not been isolated. Recently, lyr
con-structed from the genetic material of garden soil microbes [25]. By screening a P. mirabilis BCRC10725 genomic library, a lyr was found that complemented a lysine-auxotrophicP. mirabilismutant cultured on M9-containing agar supplemented with D-lysine [26]. Of note, the sequences of Bar and Lyr contain conserved lysine and tyrosine residues at positions equivalent to the catalytic residues of BsAlr (Bar: Lys75, Tyr3019; Lyr: Lys74, Tyr2999), despite their otherwise limited sequence identity (28% between Bar and BsAlr; 24% between Lyr and BsAlr). Furthermore, theP. mirabilis
BCRC10725lyrsequence is identical withP. mirabilisATCC29906 gene (NCBI accession number: ZP 03840526), which is annotated as a putative alanine racemase. According to a phylogenetic study that used Molecular Evolutionary Genetics Analysis, 24 pro-karyotic amino acid racemases from 18 species have been classified into different groups: Group I contains Alrs from Gram-negative bacteria, Group II contains Alrs from Gram-positive bacteria, and Group III are non-Alr racemases, which have evolutionarily diverged from group I and II Alrs [26]. Lyr and Bar are therefore Group-III racemases. Expression and biochemical characteriza-tion of recombinant Lyr has shown that its preferred substrate is lysine [26]. Notably, Lyr is also active against arginine, whereas Bar racemizes arginine, lysine, methionine, serine, cysteine, leucine, and histidine [27], a useful feature for biotechnological applications.
It is interesting thatlyr has been successfully used as a non-antibiotic selectable marker gene for plant transformation lately [28] since L-lysine is toxic to tobacco and Arabidopsis while D-lysine supports their growth [28]. Such a non-antibiotic selection system for transgenic plants is much desirable due to the ecological concerns and food safety issues in this modern world. To further developlyr- orbar-based marker genes with desired properties, we determined the three-dimensional structures ofP. putidaDSM84 Bar andP. mirabilis Lyr, which are the first structures for lysine-preferred racemases. In addition, the first liganded Bar-lysine structure was also established. All structures contain PLP, which confirms their PLP-dependent nature, and the positions of their catalytic lysines and tyrosines are similar to those in Alr structures. Site-directed mutagenic, kinetic, and modeling studies character-ized the Lyr/Bar PLP-binding residues and the residues re-sponsible for their substrate specificities.
Results and Discussion
Bar and Lyr Structures
The final Lyr and Bar structures had R values of 22.0%
(Rfree= 26.0%) and 15.8% (Rfree= 21.5%), respectively. Refine-ment statistics are given in Table 1. The asymmetric unit in the Bar crystal contains two molecules. With the exception of the positions for the first 25 residues, those of all other main-chain and side-chain atoms are well defined. Non-peptide electron density near Lys75 was fit with an aldimine bond between the Lys75 Nf and the PLP C4A. The average B-factor is 37.4 A˚2. The Bar molecule contains two domains: an N-terminal (a/b)8
barrel, which contains PLP, and a b-stranded C-terminal
domain (Figure 1A). Two Bar molecules associate to form an AB-type dimer, and their positions are related by a non-crystallographic two-fold axis (Figure 1B). The subunits have
essentially the same fold (root mean square deviation
(RMSD) = 0.219 A˚ for equivalent Ca positions).
We next solved the Lyr structure by molecular replacement with the Bar structure as the template. One Lyr molecule is found in the asymmetric unit. With the exception of those for the first 36 residues, the positions of all main-chain and side-chain atoms are well defined. The average B-factor is 29.2 A˚2.
Molecular Lyr and Bar have the same domain structure, and PLP is found in an equivalent position in the two molecules (Figure 1C). Two Lyr molecules associate to form a dimer related by a two-fold crystallographic axis. In the Bar and Lyr dimers, the two protomers are arranged in a head-to-tail manner, stabilized by multiple interactions between N-terminal-domain residues in one monomer and C-terminal-N-terminal-domain residues in the other protomer (Figure 1B, D). The tertiary
structures of the Lyr and Bar protomers are similar
(RMSD = 0.89 A˚ for Ca positions).
Structural Comparisons
When the Lyr or Bar structure was used as the query, the top-scoring proteins (Z scores.38) returned by DALI were Alrs, even though the sequence identities for the Alrs and Lyr, and the Alrs and Bar are low (20227% identity for Lyr; 23231% identity for Bar). The tertiary folds of Lyr, Bar, and the Alrs are similar [29], and the protomers in each racemase are oriented head-to-tail.
Superposition of Lyr, Bar, SpAlr, BsAlr, and SlAlr confirmed their structural similarity (Figure 2A). The C-terminal domains superimpose relatively well (Q-scores within 0.68–0.95 for Ca
positions) [30]. However, the Capositions of a few regions in the
N-terminal domains (corresponding to residues 1082121,
1492155, and 1912195 in Lyr) have lower structural similarities between our structures and Alrs (Q-scores within 0.45–0.60). Moreover, the Capositions in the g3-b10 loop between the N-and C-terminal domains have the greatest deviation (Q-scores within 0.38–0.45) and show that the hinge angles between the monomer domains are slightly different (Figure 2A), which are also discovered in Alr structures [14,19]. Lyr Lys74 and Bar Lys75 reside in theb2-a2 loop and bind PLP via an aldimine bond as has been found for the corresponding lysines and PLP in the Alrs (Figure 2B). The combined sequence and secondary structure alignments of Lyr, Bar, and the three Alrs demonstrate that this loop along with b2, a2, b11, b11–b12, and b12 share similar secondary structural elements (Figure 3). Additionally, the Ca
atoms in the sequences of these regions in Lyr and Bar superimpose very well with those in the Alrs (Q-scores within 0.85–0.95). Therefore, Lyr, Bar, and the Alrs probably originated from a common ancestor involved in racemization of amino acids for the synthesis of cell building blocks.
Racemase Active Sites
The Alr active-site cleft is located at the dimeric interface and contains the two conserved catalytic residues, a lysine from one subunit and a tyrosine from the other subunit (SpAlr: Lys40and Tyr2639; BsAlr: Lys39 and Tyr2659; SlAlr: Lys38 and Tyr2709 [9,11,31]). Sequence alignment of Lyr, Bar, and the Alrs showed that the two catalytic residues are conserved in Lyr and Bar (Figure 2B). Furthermore, superpositioning the Lyr, Bar, SpAlr, BsAlr, and SlAlr structures showed that the two catalytic residues are situated at nearly identical positions within all five structures (Figure 1, 2, 3).
Most of the Alr PLP-binding residues are also conserved in Lyr and Bar (Table 2). Two conserved arginines (Lyr: Arg173 and Arg260; Bar: Arg174and Arg261; SpAlr: Arg136and Arg218; BsAlr:
Arg136and Arg219; SlAlr: Arg136and Arg224) in the (a/b)8barrel
to the corresponding arginine (Lyr: Asn174; Bar: Asn175) makes contacts with the arginine guanidinium moiety in Lyr and Bar,
suggesting that these Asn/Arg interactions stabilize the orientation of PLP.
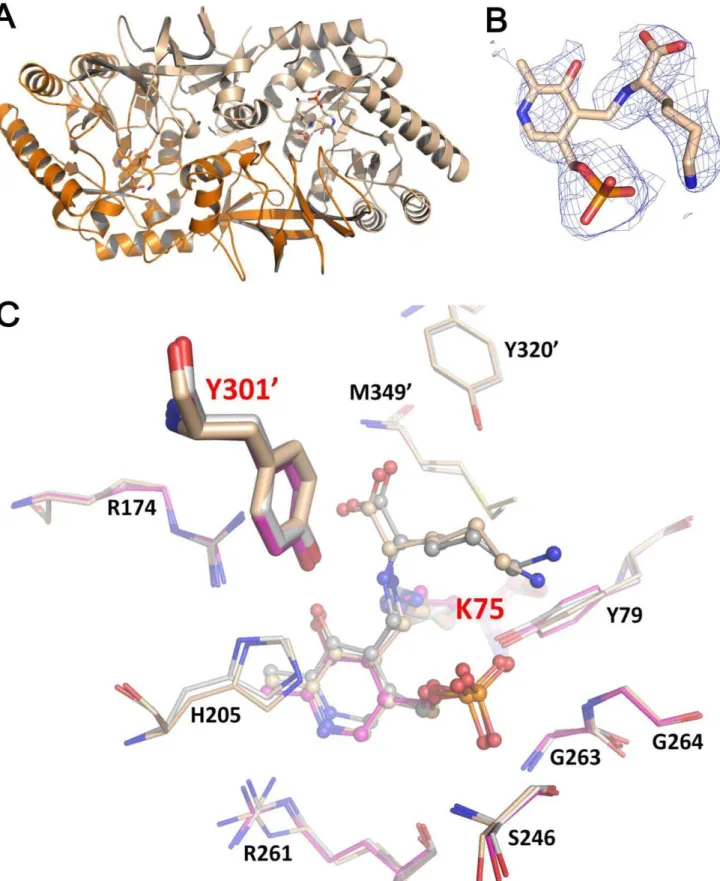
Figure 1. Bar and Lyr Structures.(A) Monomeric Bar. The N- and C-termini are labeledNandC, respectively, in blue. Thea-helices andb-strands are labeledaandb, respectively, and are numbered. The internal aldimine linkage between PLP and K75 is shown as stick. (B) Dimeric Bar. The electron density map for the aldimine bond between PLP and K75, and the other catalyst Y3019(prime denotes the residue from the other subunit) are shown in the lower panel. (C) Monomeric Lyr. The N- and C-termini are labeledNorC, respectively, in blue. Thea-helices andb-strands are labeled
aandb, respectively, and are numbered. The internal aldimine linkage between PLP and K74 is shown as stick. (D) Dimeric Lyr. The electron density map for the aldimine bond between PLP and K74, and the other catalyst Y2999are shown in the lower panel. The omitFo–Fcelectron density maps are contoured at 1.0s. Oxygen, nitrogen, and phosphate atoms are colored red, blue, and orange, respectively.
doi:10.1371/journal.pone.0048301.g001
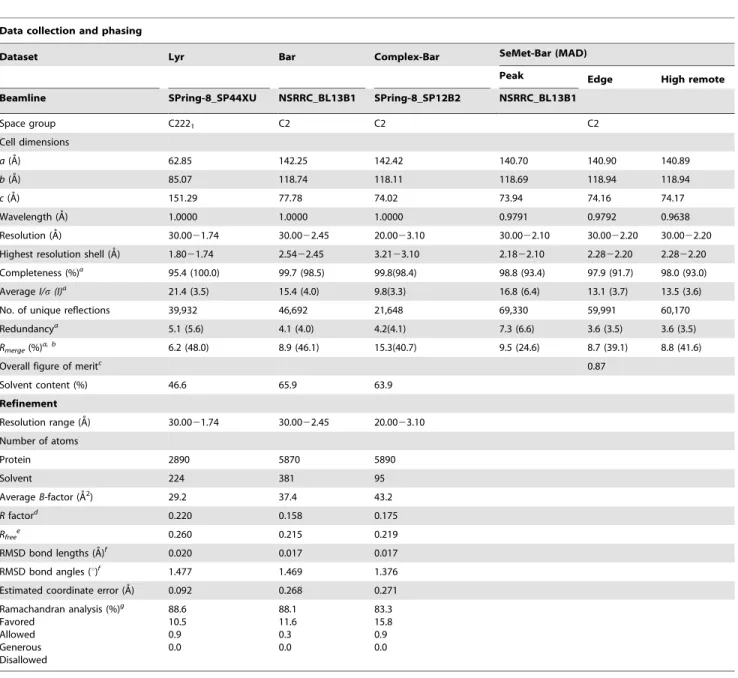
Table 1.X-ray Data and Refinement Statistics.
Data collection and phasing
Dataset Lyr Bar Complex-Bar SeMet-Bar (MAD)
Peak Edge High remote
Beamline SPring-8_SP44XU NSRRC_BL13B1 SPring-8_SP12B2 NSRRC_BL13B1
Space group C2221 C2 C2 C2
Cell dimensions
a(A˚) 62.85 142.25 142.42 140.70 140.90 140.89
b(A˚) 85.07 118.74 118.11 118.69 118.94 118.94
c(A˚) 151.29 77.78 74.02 73.94 74.16 74.17
Wavelength (A˚) 1.0000 1.0000 1.0000 0.9791 0.9792 0.9638
Resolution (A˚) 30.0021.74 30.0022.45 20.0023.10 30.0022.10 30.0022.20 30.0022.20
Highest resolution shell (A˚) 1.8021.74 2.5422.45 3.2123.10 2.1822.10 2.2822.20 2.2822.20
Completeness (%)a
95.4 (100.0) 99.7 (98.5) 99.8(98.4) 98.8 (93.4) 97.9 (91.7) 98.0 (93.0)
AverageI/s(I)a 21.4 (3.5) 15.4 (4.0) 9.8(3.3) 16.8 (6.4) 13.1 (3.7) 13.5 (3.6)
No. of unique reflections 39,932 46,692 21,648 69,330 59,991 60,170
Redundancya
5.1 (5.6) 4.1 (4.0) 4.2(4.1) 7.3 (6.6) 3.6 (3.5) 3.6 (3.5)
Rmerge(%)a, b
6.2 (48.0) 8.9 (46.1) 15.3(40.7) 9.5 (24.6) 8.7 (39.1) 8.8 (41.6)
Overall figure of meritc 0.87
Solvent content (%) 46.6 65.9 63.9
Refinement
Resolution range (A˚) 30.0021.74 30.0022.45 20.0023.10
Number of atoms
Protein 2890 5870 5890
Solvent 224 381 95
AverageB-factor (A˚2) 29.2 37.4 43.2
Rfactord
0.220 0.158 0.175
Rfreee
0.260 0.215 0.219
RMSD bond lengths (A˚)f
0.020 0.017 0.017
RMSD bond angles (u)f
1.477 1.469 1.376
Estimated coordinate error (A˚) 0.092 0.268 0.271
Ramachandran analysis (%)g Favored
Allowed Generous Disallowed
88.6 10.5 0.9 0.0
88.1 11.6 0.3 0.0
83.3 15.8 0.9 0.0
aValues in parentheses refer to statistics in the highest-resolution shell. bRmerge=S|I
obs2,I.|/SIobs. cFigure of merit = |F
best|/|F|. d
R=S|Fobs-Fcalc| /SFobs,whereFobsandFcalcare the observed and calculated structure-factor amplitudes, respectively. eRfreewas computed using 5% of the data assigned randomly.
fRoot mean square deviation. g
Lyr and Bar Substrate Binding Cavities
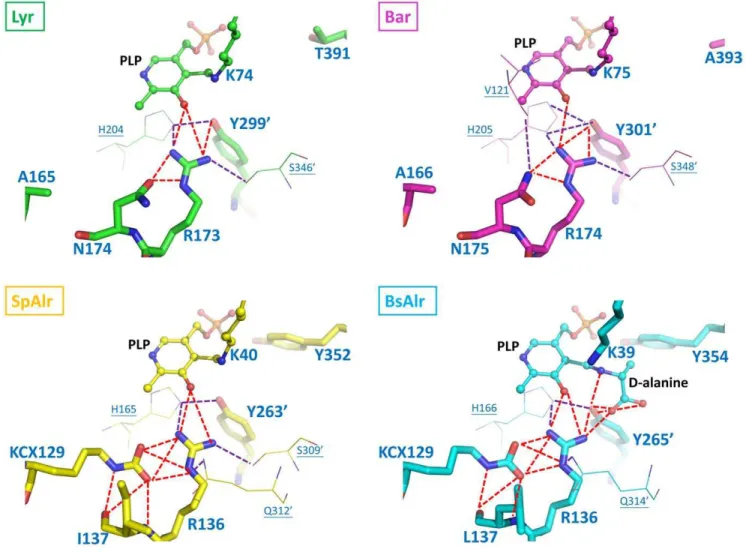
A funnel-like cavity (Figure S1) consisting of inner and outward layers is seen for Lyr or Bar (Figure 5), an arrangement that is also found in MtAlr [18]. An inner-layer tyrosine located in a-helix 10 (Tyr352in SpAlr; Tyr354 in BsAlr) interacts with the PLP O3P–an interaction believed to be necessary for substrate specificity [32]. Together with the catalytic tyrosine, these two tyrosine residues (SpAlr: Tyr352 and Tyr2639; BsAlr: Tyr354and Tyr2659), which are separated by ,2.7 A˚ , are strictly conserved and orient the alanine substrate and PLP properly. Thea-helix 10 Tyr is not, however, present in Lyr and Bar, but is replaced by Thr391 in Lyr and Ala393in
Bar (Figure 425). Two water molecules contact the PLP O3P
in Lyr and Bar, filling the space occupied by the tyrosine and PLP in SpAlr and BsAlr (Figure 4). Given the relatively larger space between Thr391 and PLP in Lyr, and Ala393 and PLP in Bar as compared with those in the Alrs, a substrate larger than an alanine may better fit the space.
ForE. coliAlr, negatively and positively charged residues are found on the opposite sides of the surface of its cavity surface (Asp164, Glu165and Arg2809, Arg3009) [33]. This array may help properly orientate the substrate for catalysis [33]. Super-positioning the corresponding residues in Lyr (Glu208, Asp209, Arg3249, and Lys3449), Bar (Glu209, Asp210, Arg3269, and Lys3469), SpAlr (Asp170, Glu171, Arg2889, and Arg3079), and BsAlr (Asp171, Glu172, Arg2909, and Arg3099) revealed that the charge distribu-tion is similar in the four racemases (Figure 5, see also Figure
S1), which supports the suggestion that these residues orient the substrate for catalysis.
Effects of Mutations on Enzymatic Activity
To evaluate the roles of Arg173, Asn174, and Thr391in Lyr and Arg174, Asn175, and Ala393 in Bar (corresponding to Arg136, Leu137, and Tyr354 in BsAlr, respectively), we performed site-directed mutagenesis and characterized the effects of the mutations had on racemase activity. The conserved Arg173 in Lyr (Arg174in Bar) was replaced with an alanine or a lysine. Asn174 in Lyr (Asn175in Bar) was replaced with a leucine to mimic Leu137 in BsAlr. Thr391in Lyr (Ala393in Bar) was replaced with a tyrosine to mimic the conserved Alr tyrosines (Figure 4; Tyr354in BsAlr and Tyr352 in SpAlr). Each mutant was expressed as a (His)6
-tagged protein inE. coliand purified by Ni-affinity chromatogra-phy. CD analysis of each mutant revealed nearly identical profile to that of the wild-type enzyme (Figure S2). The racemase activity of each mutant toward L-Lys, L-Arg, and L-Ala was measured.
R173A and R173K were inactive (Table 3) as were the corresponding Bar mutants R174A and R174K, supporting the importance of a conserved arginine at this position. Possibly, the Lyr Arg173 guanidinium group orients the PLP pyridine ring, to position the PLP-Tyr2999 interaction for catalysis. The positive electrostatic field of the guanidinium group may also help lower the pKa value of the Tyr2999phenolic hydroxyl (pKa = 8.0–9.0) for effective catalysis.
Figure 2. Superposition of Lyr, Bar, BsAlr, SpAlr and SlAlr.Lyr, Bar, BsAlr (PDB code: 1L6G), SpAlr (PDB code: 3S46), and SlAlr (PDB code: 1VFS) are colored green, magenta, cyan, yellow, and slate, respectively. (A) Superpositioning of the protomers. The variation of hinge angles between the monomer domains is indicated by the double-headed arrow. (B) The two conserved catalytic residues, PLP, and substrates are shown as stick models. Oxygen, nitrogen, and phosphate atoms are colored red, blue, and orange, respectively.
A replacement of the neighboring asparagine with a leucine (N174L in Lyr and N175L in Bar) abolished racemization activity, which supports our hypothesis that this asparagine helps orient the PLP pyridine ring, revealing a comparable role
as KCX found in Alr in conjunction with Arg173 in Lyr and
Arg174 in BAR.
Mutation of the inner-layer Thr391of Lyr to tyrosine, which is positioned similarly to the conserved tyrosines in Alrs (Tyr354in BsAlr), reduced the activity of Lyr towards L-Lys to 53% (Table 3). The L-LysKmvalue for this mutant was greater than that for Lyr,
whereas thekcatvalue for the mutant with L-Lys as the substrate
was 42% of Lyr (Table 4). Consequently, racemase activity for the mutant was significantly reduced (,50% residual activity, Table 3). A larger Km value towards L-Arg was also measured (Table 4), suggesting that the T391Y mutation might reduce the binding affinity for substrates with bulky side chains. In contrast, the kcat
values were comparable with L-Arg as the substrate, indicating that the transaldimination rate of PLP and L-Arg was unaffected by the mutation. No detectable activity was found when L-Ala was the substrate, implying that alanine still could not access the Lyr-T391Y active site.
The Bar A393Y mutant exhibited detectable, although reduced activity towards L-Lys (55% residual activity, Table 3). The kcat value for the mutant with L-Lys as the substrate was
reduced (44% residual activity, Table 4), and the Km value
increased 1.6-fold resulting in an overall reduction in activity. A393Y also was less activity toward L-Ala (25% residual activity) as compared with the wild-type enzyme (Table 3) and was inactive toward L-Arg. The tyrosine replacement at residue 393 in Bar therefore significantly reduced racemization activity,
particularly when L-Arg was the substrate. Interestingly,
Enterococcus gallinarum VanT, the C-terminal domain of which shows 31% sequence identity with BsAlr, is a serine racemase that has an asparagine at the site equivalent to position 393 in
Bar [32]. Together, these results support the possibility that the residue at this site is critical in defining substrate specificity.
We also generated the Lyr triple mutant A165K/N174L/ T391Y (Bar, A166K/N175L/A393Y) to mimic the correspond-ing residues in Alrs. However, no activity was detected towards L-Ala, L-Lys, or L-Arg. Superpositioning of Lyr and the Alrs revealed a subtle difference in the active-site frameworks (Figure 5, see also Figure S1), which might explain the inability of the triple mutant to racemize L-Ala.
Of note, the nearby Bar residue Tyr396in the same helix (a10), for which the phenolic ring also points toward the cavity, has been identified as a valuable engineering site by Kino and colleagues [27]. Substitution of Bar Tyr396with a cysteine or histidine greatly increased racemization activity toward tryptophan [27]. When the
corresponding Lyr site was mutated (S394RY), the activity
towards L-Lys was reduced to 31% that of Lyr, whereas activity towards L-Arg increased 2.1-fold [26]. Thus, this site may be also important for catalytic activity in Bar and Lyr. We generated the Lyr double mutant T391Y/S394Y, which exhibited significantly reduced specific activity towards L-Lys (6% residual activity) and toward L-Arg (0.9% residual activity) (Table 3). The kcat value
when L-Lys was the substrate decreased by 22-fold, whereas the
Kmvalue decreased by only 1.6-fold (Table 4). Given these results,
it is likely that the Thr391 and Ser394 side chains, which point toward the entryway, might help accommodate or orient the substrate to effect transaldimination with PLP. An even greater change inkcat(28-fold) and in Km (5-fold) was found when L-Arg
was the substrate, suggesting that Thr391and Ser394in Lyr (Ala393 and Tyr396in Bar) contribute to the binding and orientation of the substrate and therefore to catalytic activity. By considering specificity constants ((kcat/Km)Lys/(kcat/Km)Arg) in comparing
mutations of Lyr and Bar, T391Y has no significant change in substrate specificity (,2.9 fold) but T391Y/S394Y does enhance the Lys specificity over Arg (,15.0 fold). This implies that Ser394 Figure 3. Sequence Alignment of Bar, Lyr, SpAlr, BsAlr, and SlAlr.The catalytic residues, PLP-binding residues, and the mutation sites are identified with a red star, blue circle, and m (green), respectively. The relative conservation of each residue was drawn by the web-server WEBLOGO (http://weblogo.berkeley.edu/).
doi:10.1371/journal.pone.0048301.g003
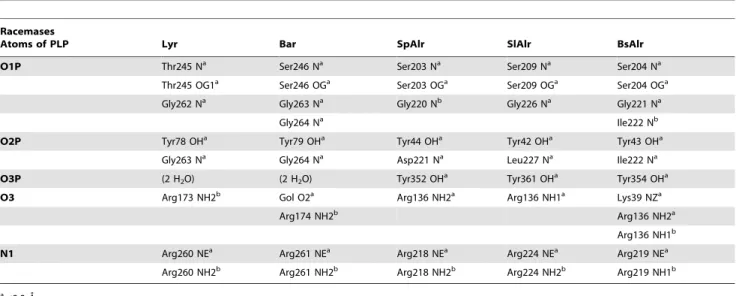
Table 2.Contacts between PLP and Its Binding Residues in the Five Racemases.
Racemases
Atoms of PLP Lyr Bar SpAlr SlAlr BsAlr
O1P Thr245 Na Ser246 Na Ser203 Na Ser209 Na Ser204 Na
Thr245 OG1a Ser246 OGa Ser203 OGa Ser209 OGa Ser204 OGa
Gly262 Na Gly263 Na Gly220 Nb Gly226 Na Gly221 Na
Gly264 Na Ile222 Nb
O2P Tyr78 OHa Tyr79 OHa Tyr44 OHa Tyr42 OHa Tyr43 OHa
Gly263 Na Gly264 Na Asp221 Na Leu227 Na Ile222 Na
O3P (2 H2O) (2 H2O) Tyr352 OHa Tyr361 OHa Tyr354 OHa
O3 Arg173 NH2b Gol O2a Arg136 NH2a Arg136 NH1a Lys39 NZa
Arg174 NH2b Arg136 NH2a
Arg136 NH1b
N1 Arg260 NEa Arg261 NEa Arg218 NEa Arg224 NEa Arg219 NEa
Arg260 NH2b Arg261 NH2b Arg218 NH2b Arg224 NH2b Arg219 NH1b
a,3.3 A˚ . b3.3–3.5 A˚ .
may be more important than Thr391 for defining the substrate specificity in Lyr.
Docked Lyr and Bar Models
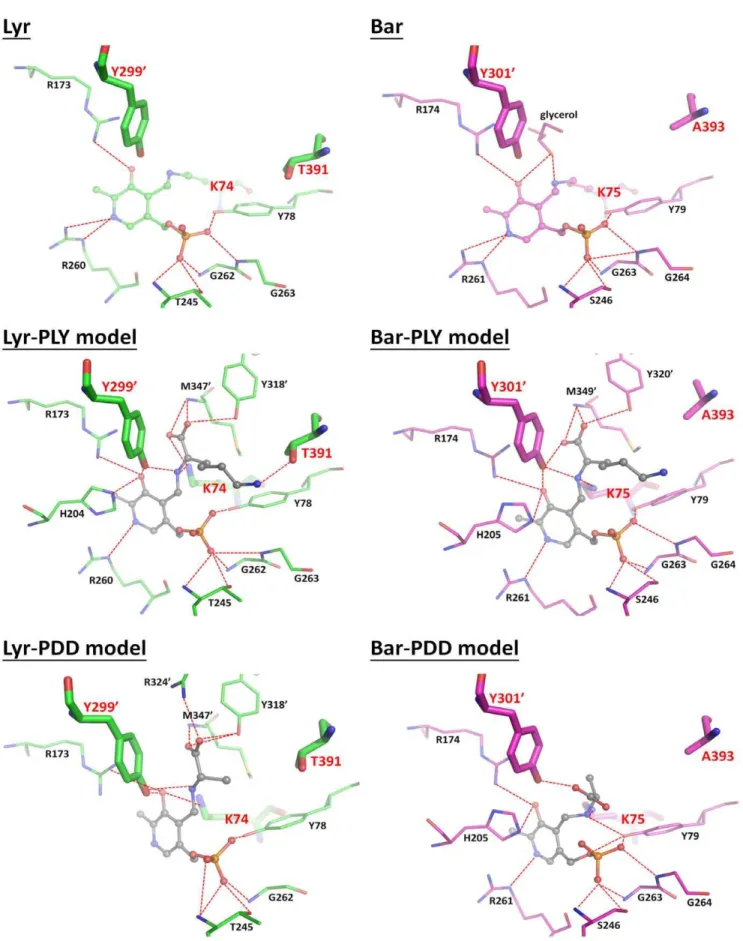
We used anin silicodocking method to generate the Lyr and Bar aldimine complexes: Lyr-PLP-D-Lys (Lyr-PLY), Lyr-PLP-D-Ala (Lyr-PDD), Bar-PLP-D-Lys PLY), and Bar-PLP-D-Ala (Bar-PDD). The top docked poses with minimum RMSDs are shown in Table S22S5. In Lyr-PLY (Figure 6), a few residues closely interact with cross-linked D-Lys: (i) the catalytic residues Lys74and Tyr2999contact the D-Lys amino nitrogen; (ii) Tyr3189and Met3479 interact with the D-Lys carboxyl oxygens; and (iii) Thr391interacts with the D-Lys side-chain Nf. Similar structural features are also found in Bar-PLY, except for a polar interaction between Ala393 and D-Lys (Figure 6).
Conversely, Lyr-PDD and Bar-PDD (Figure 6) contain many fewer polar interactions between D-Ala and PLP. In Lyr-PDD, Lys74does not hydrogen bond with the amino nitrogen of D-Ala.
Instead, D-Ala is positioned closer to Arg3249, which is why L-Ala is not racemized by Lyr (Table 3). In Bar-PDD, D-Ala is closer to
the PLP phosphate, which might also reduce its accessibility to the catalytic residue, Tyr3019, and therefore decrease racemase activity.
The Bar-Lys Complex Structure and Proposed Catalytic Mechanism
The complex-Bar structure was established (Figure 7A, B) by co-crystallizing Bar with L-lysine. The final Bar-L-lysine structure had
R values of 17.5% (Rfree= 21.9%). The apo and liganded Bar
structures share the same two-domain architecture and are both composed of the AB-type dimer. Superposition of the apo- and
complex-form reveals a RMSD of 0.34 A˚ for the Ca atoms,
demonstrating an overall identical conformation. Moreover, structural comparison of complex-Bar structure and Bar-PLY docking model shows that the reactive intermediates (PLP-lysine) are situated at the comparable position and surrounded by identical residues to form resembling hydrogen-bonding networks (Figure 7C), suggesting the feasibility of the docking approach utilized here.
Figure 4. The Hydrogen-bonding Networks in the Binding Pockets of Lyr, Bar, SpAlr, and BsAlr.The carbon atoms of Lyr, Bar, SpAlr, and
BsAlr are shown in green, magenta, yellow, and cyan, respectively. The views are those obtained by superpositioning the structures. The aldimine linkages involving PLP and K74 in Lyr, PLP and K75 in Bar, PLP and K40 in SpAlr, and PLP andD-Ala in BsAlr are shown as ball-and-stick models. Protein residues are shown as stick models. Oxygen, nitrogen, and phosphate atoms are colored red, blue, and orange, respectively. The hydrogen bonds between a ligand and the four residues KCX129, R136, L137, and Y2659in BsAlr are shown as dashed red lines, and other hydrogen bonds are shown as dashed purple lines.
Two different mechanisms have been previously proposed for the reversible racemization of Alr enzymes: (1) the classical two-base mechanism [9] that describes the involvement of the quinonoid intermediate in the proton transfer between the two catalytic bases; and (2) a revised mechanism that proposes the substrate carboxylate group directly involved in the proton transfer based on the observation of a positively charged arginine (Arg219) situated by the pyridine nitrogen atom of PLP in structures of Alr-L-ala and Alr-D-ala [13]. Given the intimate contact between Arg219and the pyridine nitrogen atom of PLP, it is not likely that a quinonoid intermediate proposed in the classical two-base mechanism could be formed. Instead, the substrate carboxylate group that is located in proximity to the two catalytic bases (Lys39 and Tyr2659), proposed in the revised mechanism, is most plausible to serve as the critical moiety to mediate the proton transfer between the two catalytic bases.
The determined Bar-Lys complex structure also shows that the positive guanidium group of Arg261 (corresponding to Arg260of Lyr) is close to the pyridine nitrogen atom of PLP (Figure 7C), hence may not favor the formation of the quinonoid intermediate proposed in the classical two-base mechanism. Moreover, the carboxylate group of L-lysine is situated at a position, allowing hydrogen-bonding interactions with both catalytic bases, re-spectively. Our docking models (Figure 6) are also in good agreement with the liganded Bar-Lys structure. These results together suggest the importance of the substrate carboxylate involved in the catalytic racemization for Lyr and Bar (FigureS3). In conclusion, the determined structures of apo and L-Lys-liganded Bar present the internal and external aldimine linkages, respectively, as well as the anchored substrate in Bar. The apo Lyr structure has also been established within the internal aldimine
linkage. Based on these structures, site-directed mutagenesis, kinetic, and modeling studies, a coordinated response between residues from a-helix 10 and those from the most peripheral region of the binding pocket (corresponding to Glu208and Asp209, and Arg3249 and Lys3449 of Lyr) is essential for lysine-preferred racemases to ensure the substrate orientation, entry and specific binding, hence PLP-dependent catalysis. Our results also shed light on the evolution of PLP-dependent amino acid racemases that retain a converged funnel-like pocket having an outward layer that help anchor the substrate while a base platform for an efficient catalytic racemization. Structural and biochemical investigations in this study provide the key basis to figure out the enzymatic mechanism of Lyr and Bar, which helps to develop and improve the non-antibiotic selection system for transgenic plants.
Materials and Methods
Cloning, Expression, and Purification
P. mirabilis BCRC10725lyrwas PCR amplified from chromo-somal DNA using gene specific primers (Table S1). Polymerase
chain reaction (PCR) was performed withpfu DNA polymerase
using a RoboCyclerHGRADIENT 96 (Stratagene, La Jolla, CA,
USA). Initial denaturation was performed at 95uC for 6 min followed by 30 cycles of denaturation at 95uC for 1 min, annealing at 55uC for 45 s, and primer extension at 72uC for 90 s. The amplified product was inserted into pET21a (Novagen, Inc., USA) to generate pET21a-lyr. Escherichia coli BL21(DE3) cells were transformed with pET21a-lyr, and expression oflyrwas induced by addition of 0.5 mM isopropyl-b-D-thiogalactopyranoside (IPTG)
(final concentration). An overnight culture ofE. coli BL21(DE3) carrying pET-lyr or mutants was inoculated into 500 ml of LB Figure 5. Crucial residues of binding cavities (See also Figure S1).(A) Crucial residues of Lyr, Bar, SpAlr and BsAlr in the binding cavities. (B) Superposition of binding cavities in Lyr (green), Bar (magenta), SpAlr (yellow), and BsAlr (cyan), respectively. Crucial residues are displayed as stick models. The ligands presented in binding pockets of all structures are drawn as ball-and-stick models. Oxygen, nitrogen, and phosphate atoms are colored red, blue, and orange, respectively.
doi:10.1371/journal.pone.0048301.g005
Table 3.Racemization Activities toward L-Lys, L-Arg, or L-Ala by Wild-type Lyr and Bar, and Their Mutants.
Enzymes L-Lys L-Arg L-Ala
Specific activity
(U/mg) Ratioa
Specific activity
(U/mg) Ratio
Specific activity
(U/mg) Ratio
Wild-type Lyr 2813697 100% 568628 20% ND
Lyr-R173A ND ND ND
Lyr-R173K ND ND ND
Lyr-N174L ND ND ND
Lyr-T391Y 1498666 53% 527641 19% ND
Lyr-T391Y/S394Y 17069 6% 2666 0.9% ND
Lyr-A165K/N174L/T391Y ND ND ND
Wild-type Bar 2397697 100% 1957670 82% 192615 8%
Bar-R174A ND ND ND
Bar-R174K ND ND ND
Bar-N175L ND ND ND
Bar-A393Y 1316626 55% ND 4462 2%
Bar-A166K/N175L/A393Y ND ND ND
aThe conversion yield of D-Lys from L-Lys was defined as 100% for wild-type Lyr and Bar. ND: Not detectable.
medium containing ampicillin (100mg/ml) and incubated at 37uC until an OD600 of 0.7 was reached. Expression of the gene was
induced by the addition of 0.5 mM IPTG and incubated at 17uC for 16 h. The cells were harvested by centrifugation at 10,0006g
for 10 min and resuspended in 50 ml of 100 mM potassium phosphate buffer (pH 8.0) containing 150 mM NaCl and dis-rupted by sonication. The cell debris was pelleted at 10,0006g at 4uC for 10 min and the resulting supernatant was loaded onto a precharged nickel affinity column (HisBind Quick Column,
Novagen, Madison, WI, USA). The His6-tagged proteins were
eluted from the column using a buffer containing 150 mM NaCl, 100 mM imidazole and 100 mM potassium phosphate buffer (pH 8.0). The purified Lyr was verified by SDS-PAGE analysis. Protein concentration was assayed by the Bradford method using bovine serum albumin as the standard [34].
Pseudomonas putida DSM84 bar was PCR amplified from chromosomal DNA using gene specific primers (Table S1) and inserted into pET21a to generate pET21a-bar. The expression and purification of Bar were as described above.
Site-Directed Mutagenesis
pET21a-lyrand pET21a-barserved as the templates for overlap extension PCR amplification [35] of mutated genes using the primers listed in Table S1. Each amplified mutated gene was
cloned into an XbaI-XhoI site in pET21a. The recombinant
plasmids were individually introduced intoE. coliNovaBlue orE. coliBL21(DE3). After isolating each plasmid, the presence of the desired mutation was confirmed by DNA sequencing.
Circular Dichroism Analysis
All circular dichroism (CD) measurements described here were made by using 1.0 mm cells. Spectra were recorded at 25uC on AVIV 62A DS spectropolarimeter (Aviv Associates, Lakewood, NJ). The concentration of proteins used for wavelength scanning of CD measurement was 0.08 mg/ml. All spectra were recorded from 195 to 260 nm. Three spectra were recorded and averaged for each protein.
Enzyme Assay
Lyr and Bar racemase activities were measured using a 0.5 ml mixture of 0.5–1.0 U of purified enzyme, 100 mM CHES-NaOH
(pH 9.0), 100 mM of an L-amino acid enantiomer, and 30mM
PLP. Each mixture was incubated at 50uC for 10 min, and the reactions were terminated by heating at 100uC for 10 min. The chiralities of the amino acids were characterized by high-performance liquid chromatography using a Chirobiotic T column (4.06150 mm, Advanced Separation Technologies, USA) at a flow
rate of 0.5 ml/min. The mobile phase was 50% ethanol/50%
NaH2PO4(pH 4.5). The detection wavelength was 210 nm. One
unit of racemase activity was defined as the amount of enzyme that produced 1mmole of the amino acid enantiomeric product from the enantiomeric reagent per min.
A steady-state kinetics study of the purified enzymes was performed at 50uC with a reaction mixture that contained
100 mM CHES-NaOH (pH 9.0), 30mM PLP, and an amino
acid enantiomer (concentration, 10–150 mM). The Km and kcat
values were determined by plotting the initial velocity as a function of substrate concentration and fitting the plots to the Michaelis-Menten equation.
Crystallization
Crystallization was performed by the sitting-drop vapor-diffusion method at 20uC. Equal volumes of a protein sample and the reservoir solution were mixed. Initial crystallization screening was automated using a robot Oryx8 (Douglas Instru-ments, UK) and the reagents of seven sets of crystallization kits: Crystal Screen I and II kits (Hampton Research), Index kit (Hampton Research), Clear Strategy Screen I and II kits (Molecular Dimension), Wizard kit (Emerald), and JB Screen classic HTS I and II kits (Jena Bioscience).
Crystals of Lyr (2.5 mg/ml) were grown in 0.1 M sodium acetate (pH 4.5), 0.2 M lithium sulfate, 30% (w/v) polyethylene glycol (PEG) 8000. Optimized crystals used for diffraction were grown in 0.1 M sodium acetate (pH 4.6), 0.05 M lithium chloride, 29% (w/v) PEG 8000. The crystal diffracted to 1.74 A˚ , belonged to space group C2221, and had unit cell dimensions ofa= 62.85, b= 85.07, c= 151.29 A˚ . The asymmetric unit contained one molecule.
Crystals of Bar (4.7 mg/ml in 10% (v/v) glycerol) were grown in 0.1 M Tris-HCl (pH 8.5), 2.0 M ammonium sulfate. The crystal diffracted to 2.45 A˚ , belonged to space group C2, and had unit cell dimensions ofa= 142.25,b= 118.74,c= 77.78 A˚ . The asymmetric unit contained two molecules.
Crystals of selenomethionine-derivative Bar (SeMet-Bar)
(8.1 mg/ml in 10% (v/v) glycerol) were initially grown in 0.1 M Tris-HCl (pH 8.5), 0.2 M sodium acetate, 25% (w/v) PEG 3350. The random microseed matrix screening method [36] was used to obtain crystals suitable for diffraction. The volumes of the protein sample, reservoir solution, and microseed solution were 0.5ml,
0.4ml, and 0.1ml, respectively. Optimized crystals were grown in
0.1 M Tris-HCl (pH 8.5), 0.2 M lithium sulfate, 1.26 M ammo-nium sulfate. The SeMet-Bar crystal belonged to space group C2
and had unit cell dimensions of a= 140.89, b= 118.94,
c= 74.17 A˚ . The asymmetric unit contained two molecules. Crystals of the complex Bar protein (6.1 mg/ml within 4 mM L-lysine) were obtained from the condition using 0.1 M bicine Table 4.Kinetic Parameters for Wild-type Lyr and Bar, and Their Mutants.
L-Lys L-Arg
Specificity constants
kcat(min–1) Km(mM) kcat/Km(A) kcat(min–1) Km(mM) kcat/Km(B) (A)/(B)
Wild-type Lyr 3326668 21.860.5 152.6 650635 14.961.0 43.6 3.5
Lyr-T391Y 13846148 37.665.3 36.8 610612 47.761.7 12.8 2.9
Lyr-T391Y/ S394Y 154611 34.364.1 4.5 2363 75.566.2 0.3 15.0
Wild-type Bar 35456377 25.460.6 139.6 2228614 14.561.2 153.7 0.9
Bar-A393Y 14566131 33.963.5 42.9 – – – –
Figure 6. Protein-ligand interactions in crystal structures and docked models (See also Figure S4 and Table S2, S3, S4, S5).Residues of Lyr and Bar are colored green and magenta, respectively. The docked substrates presented as the external aldimine form inside Lyr and Bar are colored gray. The hydrogen bonding is labeled by red dashed lines. Oxygen, nitrogen, and phosphate atoms are colored red, blue, and orange, respectively.
Figure 7. Bar-PLP-L-lysine complex structure.(A) The dimeric Bar is presented as cartoon presentation (chain A, wheat and chain B, orange). PLP and L-lysine are drawn as stick models. (B) The omitFo-Fcelectron density map shows PLP, substrate (L-lysine), and the external aldimine linkage, contoured at the 1.0-slevel. (C) Structural comparison of the binding pockets for apo Bar (magenta), L-lysine-liganded Bar (wheat) structures and Bar-PLY (gray) docking model. PLP, substrate L-Lys and catalytic K75 are shown as ball-and-stick models, whereas catalytic Y3019from the other protomer is drawn as heavy sticks. The rest of surrounding residues are shown as thin sticks. Oxygen, nitrogen, and phosphate atoms are colored in red, blue, and orange, respectively.
(pH 9.0), 0.1 M sodium chloride, and 20% (w/v) polyethylene glycol monomethyl ether (PEG-MME) 550. The Bar-complex crystal diffracted to 3.10 A˚ and belonged to space group C2 with the unit cell dimensionsa= 142.42,b= 118.11,c= 74.02 A˚ . There were also two molecules per asymmetric unit.
X-ray Data Collection and Processing
Crystals were flash frozen in a stream of liquid nitrogen and then screened and characterized using an RU-300 rotating-anode X-ray generator (Rigaku/MSC Inc., USA) at the Macromolecular X-ray Crystallographic Laboratory of National Tsing Hua University, Taiwan. The Lyr dataset was collected at the SPring-8 BL44XU beamline, Japan, with a Bruker-AXS DIP-6040 detector. Bar and SeMet-Bar datasets were collected at the SPXF beamline BL13B1 at the National Synchrotron Radiation Research Center, Taiwan, with an ADSC Quantum-315r CCD area detector. The multi-wavelength anomalous dispersion (MAD) dataset for a single SeMet-Bar crystal was collected at three
wavelengths: peak (0.9791 A˚ ), selenium K-edge inflection
(0.9792 A˚ ), and high remote (0.9638 A˚). The complex-Bar dataset was collected at the SPring-8 BL12B2 beamline, Japan, with the ADSC Quantum-210r CCD area detector. All datasets were indexed, integrated, and scaled using HKL-2000 [37]. Data collection statistics are shown in Table 1.
Structure Determination and Refinement
Thirteen selenium atoms were located in the asymmetric crystal unit of SeMet-Bar by the program PHENIX [38]. PHENIX was also used for phasing, density modification, and automated model building. The final model included 93.9% of the residues. The first 25 residues of Bar contained the signal peptide and were removed by auto-cleavage. Crystallographic refinement used the maximum-likelihood target function module in REFMAC5 [39,40]. The apo-and complex-form Bar structures were constructed by MOLREP [39,40,41] and were refined using REFMAC5 coupled with ARP/ wARP [42], which automatically added water molecules.
The Lyr structure was constructed by the molecular re-placement program in PHENIX with the Bar protomer (50% identity) as the template. Crystallographic refinement used the maximum-likelihood target function as implemented in RE-FMAC5 and coupled to ARP/wARP.
For the Lyr, Bar, complex-Bar and SeMet-Bar structures, 2 Fo-Fc and Fo-Fc maps were produced and inspected after each automated refinement cycle to manually refine the structures with the aid of COOT [43]. The validities of the Lyr, Bar and complex-Bar structures were assessed by PROCHECK [44].
The atomic coordinates and structure factors have been deposited in the Protein Data Bank, Research Collaboratory for Structural Bioinformatics, Rutgers University, New Brunswick, NJ (http://www.rcsb.org/pdb/) under the accession codes 4DZA (Lyr), 4DYJ (Bar), and 4FS9 (Bar-L-lysine).
Structural and Sequence Comparisons
The Lyr and Bar structures were compared with all protein structures in the DALI server (http://ekhidna.biocenter.helsinki. fi/dali_server/). The structures of Lyr, Bar, complex-Bar, BsAlr [13], SpAlr [19],Streptomyces lavendulaeAlr (SlAlr, PDB code: 1VFS;
[12], and E. coli diaminopimelate decarboxylase (PDB code:
1KO0) (no reference), were superimposed by LSQMAN in O [45] to determine the pair-wise RMSD of the Caatom positions. Q-score, a common measure to present the three-dimensional similarity, was applied to structural comparisons and ranged from 0, where no similarity exists, to 1 where structures are identical [30,46,47]. ESPript was used for the combined sequence and
secondary structure alignments and figure preparation [48]. PyMol (http://www.pymol.org) was used to prepare the figures containing structures.
Structural Modeling
Discovery Studio v3.0 (Accelrys Inc., USA) was used to prepare, energy minimize, and refine the Lyr and Bar structures prior to docking D-Ala and D-Lys into Bar and Lyr, respectively, and for molecular dynamics. The default parameters of ChiRotor were used [49] for optimizing both protein side-chain conformations. Energies of the protein models were further minimized using CHARMm [50].
To prepare PLP-D-alanine (PDD) and PLP-D-Lys (PLY) models, D-Ala and D-Lys coordinates were extracted from the BsAlr (PDB code: 1L6G) [13] andE. coliD-lysine-diaminopimelate decarboxylase-ligand complexes (PDB code: 1KO0), respectively. LibDock [51] was used in conjunction with its default settings to generate conformations for ligand-containing Lyr and Bar. Hot spots were then aligned to select docked poses, which were thenin situ minimized by Discovery Studio 3.0 ‘‘Conjugate Gradient’’ [52] to improve the quality of the conformations. All poses were scored, and the top 100-scoring poses were retained for subsequent analyses. Approximately 28% of the poses were retained from the generated 255 poses for each model (Bar: Bar-PDD, Bar-PLY; Lyr: Lyr-PDD, Lyr-PLY). Two additional scoring functions, Potential of Mean Force [53] and LigScore2 scoring [54,55], were used to compensate for an unfair penalty imposed on the binding-affinity measurement, which resulted because hydrogen atoms were eliminated during LibDock docking. The consensus score for the docked ligands in each protein-ligand model was calculated. Then, CDOCKER [56] with CHARMm forcefield was used to further refine the docked models.
The phosphate moiety in each cognate ligand (PDD or PLY) was fixed in place because its position was superimposable with those in the Alr crystal structures that were complexed with PLP (PDB codes: 1SFT [9], 1BD0 [10], 1L6G [13], 1VFS [12]) as a consequence of an extensive hydrogen-bonding network. When the RMSD of the phosphate in a docked model deviated by#1 A˚ with that of the reference pose (Table S2, S3, S4, S5), the docked model was selected for further study. According to the established mechanism of BsAlr (PDB code: 1L6G [13]), both catalysts (Lys39 and Tyr2659) were close to the Caatom of the alanine substrate within hydrogen bonding distances and responsible for the racemization reaction. Hence, the distances between the atom Caof docking ligands and reactive atoms of two conserved catalyst (Lys:N and Tyr’:O) of Lyr and Bar will be constrained to the extensive hydrogen bonding distance (,4 A˚ ) (Table S22S5).
To estimate the practicability of the proposed docking pro-cedure, we attempted to self-dock the co-crystal structures complexed with PLP-D-alanine (PDB code: 1L6G [13]) and PLP-D-lysine (PDB code: 1KO0). Top five docked poses with
minimum RMSD#1 A˚ were derived. On average, the RMSD of
self-docked poses for PLP-D-alanine and PLP-D-lysine are 0.65 A˚ and 0.84 A˚ respectively (Figure S4). This suggests that the proposed docking approach is viable.
Supporting Information
respectively, are drawn as ball-and-stick models. Spheres of the conserved tyrosine catalysts are colored as magenta. Spheres of positively charged, negatively charged, polar, and non-polar residues are colored as blue, red, pink, and yellow, respectively. Oxygen, nitrogen, and phosphate atoms are colored red, blue, and orange, respectively.
(TIF)
Figure S2 CD spectra of recombinant proteins. (A) The wavelength scanning results of Lyr wild-type and mutant proteins. (B) The wavelength scanning results of Bar wild-type and mutant proteins.
(TIF)
Figure S3 Scheme of the proposed catalytic mechanism of Lyr and Bar.The substrate, lysine, is colored in red. Catalytic bases are shown as Lys75 and Tyr3019 of Bar (corresponding to Lys74and Tyr2999of Lyr).
(TIF)
Figure S4 Related to Figure 6: Top five results of the self-docking tests. (A) Self-docking test of 1KO0, a complex structure within PLP and D-lysine. The top five results of docking poses are shown as stick and colored green. (B) Self-docking test of 1L6G, a complex structure within PLP and D-alanine. The top five results of docking poses are shown as stick and colored cyan. The reference pose is shown as ball-and stick and colored gray. Oxygen, nitrogen, and phosphate atoms of reference and docking poses are colored red, blue, and orange, respectively.
(TIF)
Table S1 Oligonucleotide primers used in this study.
(DOC)
Table S2 Related to Figure 6: Docking results for PLP-D-alanine ligand and Lyr protein.
(DOC)
Table S3 Related to Figure 6: Docking results for PLP-D-alanine ligand and Bar protein.
(DOC)
Table S4 Related to Figure 6: Docking results for PLP-D-lysine ligand and Lyr protein.
(DOC)
Table S5 Related to Figure 6: Docking results for PLP-D-lysine ligand and Bar protein.
(DOC)
Acknowledgments
We thank for Dr. Jai-Shin Liu’s excellent research assistance. We are grateful for access to the Macromolecular X-ray Crystallographic Center at the National Tsing Hua University Instrument Center at Hsinchu, National Tsing Hua University, Taiwan; to the BL13B1 beamline at the NSRRC, Taiwan; to the SP12B2 Taiwan beamline at SPring-8, Japan, and to the Osaka University BL44XU beamline, at SPring-8, Japan for data collection. We also thank the staff at NSRRC for their excellent support.
Author Contributions
Conceived and designed the experiments: H-MW Y-CK C-HC W-CW. Performed the experiments: MW Y-CK C-HC. Analyzed the data: H-MW Y-CK C-HC W-HH W-CW. Wrote the paper: H-H-MW W-CW.
References
1. Caparros M, Pisabarro AG, de Pedro MA (1992) Effect of D-amino acids on structure and synthesis of peptidoglycan in Escherichia coli. J Bacteriol 174: 5549–5559.
2. Schleifer KH (1975) Chemical structure of the peptidoglycan, its modifiability and relation to the biological activity. Z Immunitatsforsch Exp Klin Immunol 149: 104–117.
3. Lilley PE, Stamford NP, Vasudevan SG, Dixon NE (1993) The 92-min region of the Escherichia coli chromosome: location and cloning of the ubiA and alr genes. Gene 129: 9–16.
4. Esaki N, Walsh CT (1986) Biosynthetic alanine racemase of Salmonella typhimurium: purification and characterization of the enzyme encoded by the alr gene. Biochemistry 25: 3261–3267.
5. Oikawa T, Tauch A, Schaffer S, Fujioka T (2006) Expression of alr gene from Corynebacterium glutamicum ATCC 13032 in Escherichia coli and molecular characterization of the recombinant alanine racemase. J Biotechnol 125: 503– 512.
6. Uo T, Yoshimura T, Tanaka N, Takegawa K, Esaki N (2001) Functional characterization of alanine racemase from Schizosaccharomyces pombe: a eucaryotic counterpart to bacterial alanine racemase. J Bacteriol 183: 2226– 2233.
7. Ono K, Yanagida K, Oikawa T, Ogawa T, Soda K (2006) Alanine racemase of alfalfa seedlings (Medicago sativa L.): first evidence for the presence of an amino acid racemase in plants. Phytochemistry 67: 856–860.
8. Choi SY, Esaki N, Ashiuchi M, Yoshimura T, Soda K (1994) Bacterial glutamate racemase has high sequence similarity with myoglobins and forms an equimolar inactive complex with hemin. Proc Natl Acad Sci USA 91: 10144– 10147.
9. Shaw JP, Petsko GA, Ringe D (1997) Determination of the structure of alanine racemase from Bacillus stearothermophilus at 1.9-A resolution. Biochemistry 36: 1329–1342.
10. Stamper GF, Morollo AA, Ringe D (1998) Reaction of alanine racemase with 1-aminoethylphosphonic acid forms a stable external aldimine. Biochemistry 37: 10438–10445.
11. Morollo AA, Petsko GA, Ringe D (1999) Structure of a Michaelis complex analogue: propionate binds in the substrate carboxylate site of alanine racemase. Biochemistry 38: 3293–3301.
12. Noda M, Matoba Y, Kumagai T, Sugiyama M (2004) Structural evidence that alanine racemase from a D-cycloserine-producing microorganism exhibits resistance to its own product. J Biol Chem 279: 46153–46161.
13. Watanabe A, Yoshimura T, Mikami B, Hayashi H, Kagamiyama H, et al. (2002) Reaction mechanism of alanine racemase from Bacillus
stearothermo-philus: x-ray crystallographic studies of the enzyme bound with N-(59-phosphopyridoxyl)alanine. J Biol Chem 277: 19166–19172.
14. LeMagueres P, Im H, Dvorak A, Strych U, Benedik M, et al. (2003) Crystal structure at 1.45 A resolution of alanine racemase from a pathogenic bacterium, Pseudomonas aeruginosa, contains both internal and external aldimine forms. Biochemistry 42: 14752–14761.
15. Watanabe A, Kurokawa Y, Yoshimura T, Kurihara T, Soda K, et al. (1999) Role of lysine 39 of alanine racemase from Bacillus stearothermophilus that binds pyridoxal 59-phosphate. Chemical rescue studies of Lys39–.Ala mutant. J Biol Chem 274: 4189–4194.
16. Watanabe A, Yoshimura T, Mikami B, Esaki N (1999) Tyrosine 265 of alanine racemase serves as a base abstracting alpha-hydrogen from L-alanine: the counterpart residue to lysine 39 specific to D-alanine. J Biochem 126: 781–786. 17. Sun S, Toney MD (1999) Evidence for a two-base mechanism involving tyrosine-265 from arginine-219 mutants of alanine racemase. Biochemistry 38: 4058–4065.
18. LeMagueres P, Im H, Ebalunode J, Strych U, Benedik MJ, et al. (2005) The 1.9 A crystal structure of alanine racemase from Mycobacterium tuberculosis contains a conserved entryway into the active site. Biochemistry 44: 1471–1481. 19. Im H, Sharpe ML, Strych U, Davlieva M, Krause KL (2011) The crystal structure of alanine racemase from Streptococcus pneumoniae, a target for structure-based drug design. BMC Microbiol 11: 116.
20. Inagaki K, Tanizawa K, Tanaka H, Soda K (1984) Purification and properties of amino acid racemase from Aeromonas punctata subsp. caviae. Prog Clin Biol Res 144A: 355–363.
21. Lim YH, Yokoigawa K, Esaki N, Soda K (1993) A new amino acid racemase with threonine alpha-epimerase activity from Pseudomonas putida: purification and characterization. J Bacteriol 175: 4213–4217.
22. Huang HT, Kita DA, Davisson JW (1958) Racemization of Lysine by Proteus Vulgaris. J Am Chem Soc 80: 1006–1007.
23. Chang YF, Adams E (1974) D-lysine catabolic pathway in Pseudomonas putida: interrelations with L-lysine catabolism. J Bacteriol 117: 753–764.
24. Huang HT, Davisson JW (1958) Distribution of lysine racemase in bacteria. J Bacteriol 76: 495–498.
25. Chen IC, Lin WD, Hsu SK, Thiruvengadam V, Hsu WH (2009) Isolation and characterization of a novel lysine racemase from a soil metagenomic library. Appl Environ Microbiol 75: 5161–5166.
27. Kino K, Sato M, Yoneyama M, Kirimura K (2007) Synthesis of DL-tryptophan by modified broad specificity amino acid racemase from Pseudomonas putida IFO 12996. Appl Microbiol Biotechnol 73: 1299–1305.
28. Chen IC, Thiruvengadam V, Lin WD, Chang HH, Hsu WH (2010) Lysine racemase: a novel non-antibiotic selectable marker for plant transformation. Plant Mol Biol 72: 153–169.
29. Schneider G, Kack H, Lindqvist Y (2000) The manifold of vitamin B6 dependent enzymes. Structure 8: R1–6.
30. Krissinel E, Henrick K (2004) Secondary-structure matching (SSM), a new tool for fast protein structure alignment in three dimensions. Acta Crystallogr D Biol Crystallogr 60: 2256–2268.
31. Au K, Ren J, Walter TS, Harlos K, Nettleship JE, et al. (2008) Structures of an alanine racemase from Bacillus anthracis (BA0252) in the presence and absence of (R)-1-aminoethylphosphonic acid (L-Ala-P). Acta Crystallogr F Struct Biol Cryst Commun 64: 327–333.
32. Patrick WM, Weisner J, Blackburn JM (2002) Site-directed mutagenesis of Tyr354 in Geobacillus stearothermophilus alanine racemase identifies a role in controlling substrate specificity and a possible role in the evolution of antibiotic resistance. Chembiochem 3: 789–792.
33. Wu D, Hu T, Zhang L, Chen J, Du J, et al. (2008) Residues Asp164 and Glu165 at the substrate entryway function potently in substrate orientation of alanine racemase from E. coli: Enzymatic characterization with crystal structure analysis. Protein Sci 17: 1066–1076.
34. Bradford MM (1976) A rapid and sensitive method for the quantitation of microgram quantities of protein utilizing the principle of protein-dye binding. Anal Biochem 72: 248–254.
35. Chiu WC, You JY, Liu JS, Hsu SK, Hsu WH, et al. (2006) Structure-stability-activity relationship in covalently cross-linked N-carbamoyl D-amino acid amidohydrolase and N-acylamino acid racemase. J Mol Biol 359: 741–753. 36. Patrick DSS, Stefan AK, Richard AB, Naomi EC, Peter FMB (2011) Random
Microseeding: A Theoretical and Practical Exploration of Seed Stability and Seeding Techniques for Successful Protein Crystallization. Cryst Growth Des web publication.
37. Otwinowski Z, Minor W (1997) Processing of X-Ray Diffraction Data Collected in Oscillation Mode. Method Enzymol 307–326.
38. Adams PD, Grosse-Kunstleve RW, Hung LW, Ioerger TR, McCoy AJ, et al. (2002) PHENIX: building new software for automated crystallographic structure determination. Acta Crystallogr D Biol Crystallogr 58: 1948–1954.
39. Collaborative Computational Project, Number 4 (1994) The CCP4 suite: programs for protein crystallography. Acta Crystallogr D Biol Crystallogr 50: 760–763.
40. Murshudov GN, Vagin AA, Dodson EJ (1997) Refinement of macromolecular structures by the maximum-likelihood method. Acta Crystallogr D Biol Crystal-logr 53: 240–255.
41. Vagin A, Teplyakov A (1997) MOLREP: an Automated Program for Molecular Replacement. J Appl Cryst 30: 1022–1025.
42. Lamzin VS, Wilson KS (1993) Automated refinement of protein models. Acta Crystallogr D Biol Crystallogr 49: 129–147.
43. Emsley P, Lohkamp B, Scott WG, Cowtan K (2010) Features and development of Coot. Acta Crystallogr D Biol Crystallogr 66: 486–501.
44. Laskowski RA, MacArthur MW, Moss DS, Thornton JM (1993) PROCHECK: a program to check the stereochemical quality of protein structures. J Appl Cryst 26: 283–291.
45. Jones TA, Zou JY, Cowan SW, Kjeldgaard M (1991) Improved methods for building protein models in electron density maps and the location of errors in these models. Acta Crystallogr A 47: 110–119.
46. Chu CH, Lo WC, Wang HW, Hsu YC, Hwang JK, et al. (2010) Detection and Alignment of 3D Domain Swapping Proteins Using Angle-Distance Image-Based Secondary Structural Matching Techniques. PLoS One 5.
47. Krissinel E (2007) On the relationship between sequence and structure similarities in proteomics. Bioinformatics 23: 717–723.
48. Raghuraman A, Mosier PD, Desai UR (2006) Finding a needle in a haystack: development of a combinatorial virtual screening approach for identifying high specificity heparin/heparan sulfate sequence(s). J Med Chem 49: 3553–3562. 49. Spassov VZ, Yan L, Flook PK (2007) The dominant role of side-chain backbone
interactions in structural realization of amino acid code. ChiRotor: a side-chain prediction algorithm based on side-chain backbone interactions. Protein Sci 16: 494–506.
50. Brooks BR, Bruccoleri RE, Olafson BD, States DJ, Swaminathan S, et al. (1983) Charmm - a Program for Macromolecular Energy, Minimization, and Dynamics Calculations. J Comput Chem 4: 187–217.
51. Diller DJ, Merz KM Jr (2001) High throughput docking for library design and library prioritization. Proteins 43: 113–124.
52. Fletcher R, Reeves CM (1964) Function Minimization by Conjugate Gradients. Comput J 7: 149–&.
53. Muegge I, Martin YC (1999) A general and fast scoring function for protein-ligand interactions: a simplified potential approach. J Med Chem 42: 791–804. 54. Mayo SL, Olafson BD, Goddard WA (1990) Dreiding - a Generic Force-Field
for Molecular Simulations. J Phys Chem 94: 8897–8909.
55. Krammer A, Kirchhoff PD, Jiang X, Venkatachalam CM, Waldman M (2005) LigScore: a novel scoring function for predicting binding affinities. J Mol Graph Model 23: 395–407.