Solar
Module
Modeling, Simulation And Validation Under
Matlab / Simulink
*, **M.Diaw, ** M. L.Ndiaye, * M. Sambou, * I Ngom, **MBaye A.
*Department of physical University, Cheikh Anta Diop of Dakar SenegalLaboratory of Hydraulic and Fluid Mechanics
** Electrical Engineering Department of the Polytechnic High School of Dakar Senegal Laboratory International Center for Solar Energy Training
ABSTRACT
Solar modules are systems which convert sunlight into electricity using the physics of semiconductors. Mathematical modeling of these systems uses weather data such as irradiance and temperature as inputs. It provides the current, voltage or power as outputs, which allows plot the characteristic giving the intensity I as a function of voltage V for photovoltaic cells. In this work, we have developed a model for a diode of a Photovoltaic module under the Matlab / Simulink environment. From this model, we have plotted the characteristic curves I-V and P-V of solar cell for different values of temperature and sunlight. The validation has been done by comparing the experimental curve with power from a solar panel HORONYA20W type with that obtained by the model.
Keywords: physics of semiconductors, Matlab / Simulink environment, solar modules
I.
INTRODUCTION
The use of renewable energies, particularly photovoltaic systems is growing more and more. These renewable energy sources are essential for the electrification of isolated areas that are not connected to distribution system. The photovoltaic system is the most used in the field of renewable energy [1]. It generates electricity in direct current, without major impact on the environment. However, to understand the operation of the photovoltaic system and estimate its production based on climatic conditions, it is necessary to represent it by a mathematical model based on a PV cell. The model can theoretically simulate the behavior of the photovoltaic system with respect to certain parameters such as sunlight, temperature and resistance. Researchers have developed different models of photovoltaic systems. Among them, the single diode model is the simplest model. It offers a good compromise between simplicity and accuracy. It is by the way the most widely used : [2], with both series and parallel resistors to represent effect of irradiance and temperature on the PV module; [3], to allow the interaction with a power converter [4] to find the best Current (I) voltage (V) equations for the single PV model and the effects of the series and parallel resistance; [1] to investigate I-V and P-V characteristics of a 36W solar module; [5], to compare the data sheet values and characteristics of the PV module in Standard Test Conditions with experimental current (I) Voltage (V)characteristics of Solarex MSX60 module; [6] in a photovoltaic grid connected system modeling by a lumped circuit
GUI model is designed with Simulink block libraries. [11] presents a new Matlab/Simulink model of a PV module and a maximum power point tracking (MPPT) system for high efficiency InGaP/InGaAs/Ge triple junction solar cell. In this paper, we present a one diode mathematical model with four parameters. This model characterizes a PV module by representing the current - voltage and voltage - power curves under different irradiance and temperature. Outputs of the model have been validated to that measured on the Honora PV module of 20 W.
II.
THEORY AND APPLICATION
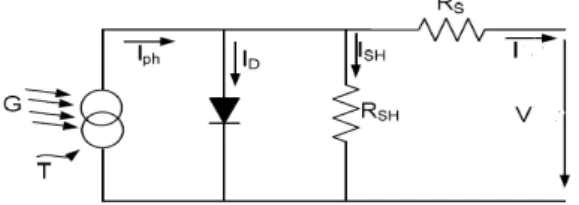
Photovoltaic cell models have long been a source for the description of photovoltaic cell behaviors. The most common model used to predict energy production in photovoltaic cell modeling is the single diode circuit model [11], shown in Fig. 1. This model includes a current source Iph, which
depends on solar radiation and cell temperature, a diode which the inverse saturation current ID
depends mainly on the operating temperature, a series resistance Rs characterizes the losses by the
Joule effect of the inherent resistance of the semiconductor and losses through the collection grids and poor ohmic contacts of the cell. The high strength semi-conductor electrodes appreciably lower voltage and output current varies very slightly, which will limit the conversion efficiency and a shunt resistance Rsh, taking into account the resistive
losses.
Fig. 1. Equivalent Electrical circuit of the single diode model.
The current–voltage relationship of a photovoltaic cell is given by Eq. 1:
(1) I represents the output current
Iph is the photocurrent, it is proportional to the
incident flux. According to [13] its expression is (Eq 2)
(2) (2)
Where
(3)
ISC: Short Circuit Current
K0: Current Proportionality constant. (K0=2.2*10 -3 0
C).
G: Irradiance (W/m2).
Gnom: Nominal Irradiance. (Gnom =1000W/m2).
ID (Eq 4) is the direct current of the diode. It has the
same magnitude as ISH for low voltages it becomes
very large around Voc, the Open Circuit Voltage
(4)
represents the reverse saturation current of the diode without irradiance. I0 is calculated by the eq
(5)
(5)
Where
T: is the cell operating temperature.
K: the Boltzmann universal constant (k = 1.38e-23 J/K)
q: the electric charge (1.6 10-19 C)
n: the ideality factor (1.2) Isc: short Current
V: Operating Voltage (V)
Eg: Energy Band Gap (Eg =1.12 eV)
ISH (Eq. 6) represents the current in the shunt
resistance. It is the ratio of the voltage of the diode VD and series resistance .
(6)
ISH is very low because the shunt resistor RSH is
generally very large, so that it is independent of the voltage. It has been neglected for the rest of our study. The model used in our study is represented as follow (Fig.2).
Fig. 2. Equivalent Electrical circuit of the single diode model.
Substituting equations 2 and 4 in Eq (1) we get:
(7) According to Eq (7), the load current I depends on
2-1 Determination Of Current Load I
The current load of the cell is calculated by solving Eq (7) using the iterative Newton Raphson method. If I is a solution of equation (7), we set:
(8) We have to solve
(9) From a starting value, solution, we try
(10)
If the equation is true, is the right value. If not, we set
(11)
And replace in equation
(12)
We develop the first member in Taylor series at the first order
(13)
(14)
(15)
And the next value
(16)
The iterative final equation is given as follow
(17) In this equation, i is the time index (hour). , ,
are measured values, is a unknown constant with low value to be calculated using the STC (Standard tests Conditions)
2-2 Determination Of Rs.
The electro-physical output rating of P-V modules are given at specific conditions. These Conditions are called Standard Test Conditions (STC) they are given in the table 1.
Table 1: Standard test condition Parameter
Symbol
Value
Unit Irradiance at
normal incidence G
1000
Wm2 Cell temperature T 25 oC Solar spectrum AM 1. 5 -
G, T are fixed to the values indicated the table 1 corresponding to the STC (Standard tests Conditions). For different values of Rs, equation
(17) is solved against Vi. The resulting I-V curves
are adjusted to the constructor experimental curve at three points: open circuit, maximum, and short circuit [4]. Final Rs is the value corresponding to the
best fit.
2-3 Calculation Of Output Power
The electric power corresponding to each step i is estimated by Eq (18).
(18) The P-V characteristic is obtained by plotting P
against V.
The maximum power Pmax is the top of the curve
P-V
III.
SIMULATIONS OF I-V CURVES P-V
CURVES AND VALIDATION
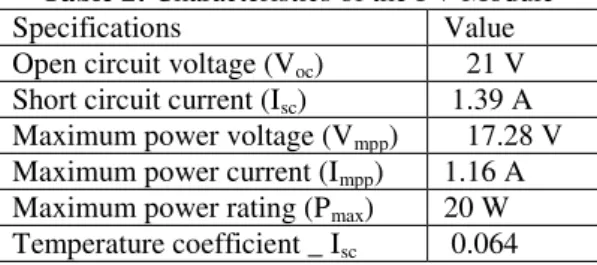
The PV- module of the type HORONYA has been chosen for the simulation. It delivers a power of 20W is chosen. Its characteristics are given in table 2.
Table 2: Characteristics of the PV Module Specifications Value Open circuit voltage (Voc) 21 V
Short circuit current (Isc) 1.39 A
Maximum power voltage (Vmpp) 17.28 V
Maximum power current (Impp) 1.16 A
Maximum power rating (Pmax) 20 W
Temperature coefficient _ Isc 0.064
Equation (17) is solved iteratively by using MATLAB. Voltage (Vi) measured from the PV module at different time step i, irradiance values (Gi), and temperature (Ti) are inputs. I-V and P-V characteristic curves are then plotted
IV.
RESULTS AND DISCUSSIONS
In figure 3, we present an example of I-V characteristic (Fig 3(a)) and P-V characteristic (Fig 3(b)). I-V characteristic presents three zones AB, BC and CD.
AB: the current load is almost constant; the resistance load is low. The photovoltaic module behaves as a current source.
BC: the module delivers the highest power and its efficiency is maximum. It is neither a current source, nor a voltage source.*
Figure 3: characteristic of the module (a) I V, (b) P-V
4-1 Influence Of Sunshine
Temperatures are chosen from the STC conditions. For each of the decreasing irradiance values (1000, 900, 700, 500 W/m²) load current I and power P are calculated for different values of V. Characteristics curves I-V, and P-V are then plotted (Fig 4) : when the irradiance decreases, the short current Isc and the court circuit voltage Voc decreases
also, and by the way the power P.
Figure 4: The influence of Irradiance on the characteristic (a) I-V, (b) P-V
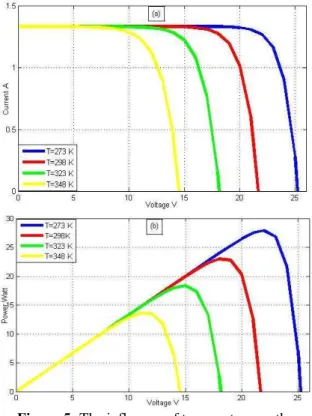
4-2 Influence Of Temperature
Irradiance is fixed to G = 1000W / m². Four Values of temperatures are selected: 0°C, 25°C, 50°C, and 75°C. The characteristic curves I-V and P-V are plotted for each of, these temperatures (Fig 5). When the temperature increases, voltage V (Fig 5a) and the power P (Fig 5b) decrease.
Figure 5: The influence of temperature on the characteristic (a) I-V,(b) P-V
4-3 Influence Of The Series Resistance
For three of Rs (0.01Ω, 0. 85Ω, 2 Ω, and 4 Ω) the I-V and P-V characteristics curves are plotted (Fig 6). Fig 6.a shows that Rs does not affect the
short circuit current Isc and the open circuit voltage Voc. As Rs increases, the slope of the characteristic
Figure 6: the influence of series resistance on the characteristic (a) I-V, (b) P-V
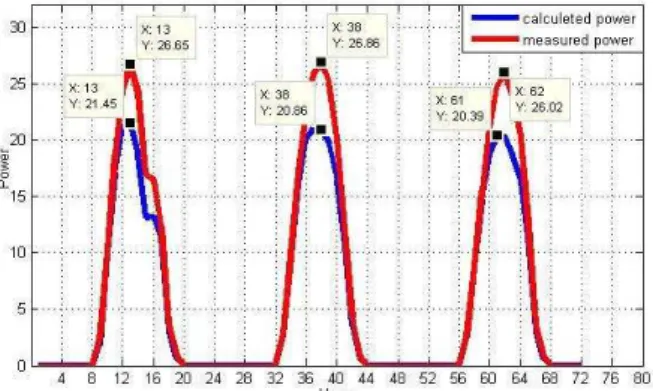
4-4 Validation
To validate our model, we compare the powers calculated by the model to that measured on the HORONYA 20W-type solar module for three days (Fig 7). We have noted an under estimation of the powers calculated by the model, particularly during the day in bright sunlight. This occurs because high values of Isc and Vco are used in
measured powers.
Figure 7: Comparison of the theoretical model and
the experimental data.
V.
CONCLUSION
We presents in this paper a one diode model equivalent with four parameters. Equation for load current is solved iteratively using Newton Raphson under Matlab Simulink environment. Inputs for the model are voltage, temperature, and sunlight; output is is the current supplied by the module. The parameters of the HORONYA photovoltaic module are used in the simulation. We have noted the following results: as the temperature or the Rs resistance increases, the power decreases; as the irradiance increases, the power increases. We have then compared the power calculated by the model to that measured on a 20W HORONYA PV module. During the high sunlight, the model underestimates the power. This comes from the high values of ISH and Voc used in the measured powers.
Further research can be made by taking into account
the RSH .Previous research will be conducted in the
HORONYA module by introducing in the model other environmental parameters such as the relative humidity, dust, ...
REFERENCE
[1]. Mathematical Modeling of Photovoltaic Module with Simulink. Pandiarajan, N. et Muthu, Ranganath.Jan 2011, International Conference on Electrical Energy Systems (ICEES 2011), pp. 3-5
[2]. detailed modeling of photovoltaic module using MATLAB. Bellia, Habbati, Youcef, Ramdani et Fatima, Moulay.2014), NRIAG Journal of Astronomy and Geophysics, pp. 53–61.
[3]. Krismadinataa*, Nasrudin Abd. Rahima.Photovoltaic module modeling using simulink/matlab. The 3rd International Conference on Sustainable Future for Human Security
[4]. Environment. Kumari, J. Surya et Babu, Ch. Sai . 1, February 2012, International Journal of Electrical and Computer Engineering (IJECE), Vol. 2, p. pp. 26~34. [5]. modelling and simulation of photovoltaic
module considering single - diode equivalent circuit model in matlab. Bonkoungou, Dominique, Koalaga, , Zacharie et Njomo, Donatien. 3, March 2013), nternational Journal of Emerging Technology and Advanced Engineering, Vol. 3, p. xxx.
[6]. Modeling and simulation of a grid connected PV system based on the evaluation of main PV module parameters . Chouder, Aissa, et al. (2012), Simulation Modelling Practice and Theory 20, pp. 46– 58.
[7]. Selecting a suitable model for characterizing photovoltaic devices. Blas, M.A. de, et al. (2002), Renewable Energy 25, pp. 371–38
[8]. Simple parameter extraction method for illuminated solar cells . Chegaar, M., Azzouzi, G. et Mialhe, P. 1234–1237, Solid-State Electronics 50 , p. (2006) . [9]. MATLABbasedmodelingtostudytheperform
anceofdifferent MPPT techniquesusedforsolarPVsystemundervario us operating conditions. ParimitaMohanty, et al. (2014), RenewableandSustainableEnergyReviews3 8, pp. 581–593.
Engineering Research and Applications, Vol. 4, pp. pp.67-72.
[11]. A MATLAB /Simulink Modal of Triple-Junction Solar Cell and MPPT Based on Incremental Conductance Algorithm for PV System. Thakur, Mamta et Singh, Baljit. 9, September 2015, Int. Journal of Engineering Research and Applications, Vol. 5, pp. pp.92-95
[12]. evaluating mppt converter topologies using a matlab pv model . walker, geoff. xxx, dept of computer science and electrical engineering,university of queensland, australia , p. xxx.
[13]. A Proposed Model of Photovoltaic Module in Matlab/Simulink for Distance Education. ERDEM, Zekiye et ERDEM, M.Bilgehan. 2013, Procedia - Social and Behavioral Sciences 103, pp. 55 – 62.
[14]. Evaluation of performance of MPPT devices in PV systems with storage batteries. Chen, Wei, et al. (2007), Renewable Energy 32, pp. 1611–1622. [15]. model of photovoltaic module in matlab. m,
francisco et longatt, gonzález.2005, 2do congreso iberoamericano de estudiantes de ingeniería eléctrica, electrónica y computación (ii cibelec 2005), p. xxx. [16]. Effect of Partial shading on characteristics
of PV panel using Simscape. Amardeep Chaudhary*, et al. 10, October 2015, Int. Journal of Engineering Research and Applications, Vol. 5, pp. pp.85-89..