ISSN 0104-6632 Printed in Brazil
www.abeq.org.br/bjche
Vol. 24, No. 03, pp. 461 - 469, July - September, 2007
Brazilian Journal
of Chemical
Engineering
EXERGETIC AND ECONOMIC ANALYSIS OF AN
INDUSTRIAL DISTILLATION COLUMN
A. C. B. Araújo
1, L. G. S. Vasconcelos
2, M. F. Fossy
2, and R. P. Brito
2*1
Braskem, Av Assis Chateaubriand 5260, CEP 57010-800, Pontal da Barra, Maceió - AL, Brazil E-mail: [email protected]
2
Department of Chemical Engineering, Federal University of Campina Grande, Av Aprígio Veloso 882, Bodocongó, CEP 58109-970, Campina Grande - PB, Brazil
E-mail: [email protected], E-mail: [email protected], [email protected]
(Received: January 20, 2006 ; Accepted: April 11, 2007)
Abstract - In this work, applications of exergy and economic concepts to compression, heat exchange, and separation processes were used for calculation of the irreversibility rate, thermodynamic efficiency, and internal rate of return (IRR) of the profitability. A case study based on a real process, the purification of 1,2-dichloroethane (DCE) in a high-purity distillation column, is presented. This column has the highest steam flow rate in any vinyl chloride monomer (VCM) plant. A configuration using a vapor compression heat pump is proposed for improvement of the energy efficiency without having to make important process modifications. Existing and proposed configurations were implemented using the Aspen Plus™ commercial simulator; the results of the existing configuration were validated with data extracted from the plant. The objective of this work was to compare the existing configuration with the proposed one, using a thermodynamic and an economic approach.
Keywords: Exergy; Economic; Cost; Thermodynamic; Efficiency; Distillation.
INTRODUCTION
The calculation of performance criteria is very important in evaluation of the level of thermodynamic efficiency of a process; however, a consistent standard of analysis is necessary to avoid incomplete or inadequate information.
Traditional techniques to evaluate the effective use of energy in a process basically involve energetic balances and calculations of performance criteria. The energetic balances do not distinguish between the different types of energies involved in a specific process and also reveal nothing about useful energy losses within the system. These traditional methods to evaluate process efficiencies are mainly based on the first law of thermodynamics. On the other hand, more precise methods, which consider the quality of energy, are based on the second law in addition to the first law.
According to Kotas (1995), the concept of exergy establishes a universal standard for the quality of energy in a certain environment. An exergetic balance provides information about the loss of the useful energy supplied to the process. This means that exergetic losses, also known as irreversibility, can be stated as a degradation of energy.
But does the tracing of inefficiencies in a process allow improvements in the design? Although this is normally correct, there is not always a direct relationship between thermodynamic efficiency and costs. Therefore, the main objective of this work was to compare the existing configuration with the proposed one, using a thermodynamic and an economical approach.
EXERGETIC AND ECONOMIC ANALYSES
The exergy (E) of a stream can be expressed by Equation (1):
K P PH _ 0
E=E +E +E +E (1)
The kinetic (EK) and potential (EP) exergy
components, as ordered forms of energy, are represented by kinetic and potential energy equations.
The physical exergy (EPH) component is defined
as the maximum quantity of work when a material stream passes reversibly by a physical process from its initial state at P and T to its environmental state (when there is thermal and mechanical equilibrium), at T0 and P0 (condition 0). For a stream going from
T1 and P1 (condition 1) to T0 and P0, it can be stated
that:
(
) (
)
REV PH 1 0 1 0 0 0
W =E = H −T S − H −T S (2)
In Equation (2), H represents enthalpy and S, entropy.
The chemical exergy (E_0) component is defined as the maximum work of a stream of material passing reversibly from its environmental state to its dead state (where there are all kinds of equilibrium, including chemical equilibrium) at T0 and P0, by a
process that only involves mass transfer with the environment. To calculate the chemical exergy component, Hinderink et. al. (1996) proposed a division of the term into a chemical term and a mixture term. The chemical exergy term is defined as
n n
o,l o
0 0 0,i 0,i 0 0,i 0,i
i l i l
E L x E V y E ν
= −
=
∑
+∑
(3)where L0 and V0 represent the liquid and vapor molar
flow; x0,i and y0,i, the molar fractions in the liquid
and in the vapor phase; E0,io, the standard exergy;
and n, any component in the stream.
The mixture term of exergy (EMIX) is calculated by
MIX MIX 0 MIX
E = ∆ H− ∆T S (4)
where
n
l l
MIX i i
i l
n
i i
i l
M L M x M
V M y M
=
ν ν
=
∆ = ⋅ − ⋅ +
+ ⋅ − ⋅
∑
∑
(5)
In Equation (5), M is any thermodynamic state function. In this case, M can be enthalpy or entropy.
To calculate the thermodynamic efficiency (ψ) of the process, Kotas (1995) proposed Equation (6):
out
in E
E
∆ Ψ =
∆
∑
∑
(6)Equation (6) is characterized by considering the desired output of the process and the input that’s necessary to perform the desired output.
From an economical point of view, according to Douglas (1988), there are two methods to evaluate the costs of investments: to quote the costs of equipment and installations based on vendor quotes and to use empirical equations that consider the quotations of several vendors. Douglas (1988) mentioned Guthrie’s correlations, which calculate the purchase costs of process equipment including installations very precisely. A lot of factors are used to calculate the installation costs, such as piping requirements, kind of steel for structural supports, conventional instrumentation and controllers, installation of the auxiliary electrical equipment, insulation, painting, labor, freight, insurance, taxes, and other overhead expenses.
The proposed configuration includes a compressor and possibly a new reboiler, so in this case study, the investment costs are related to cost of the compressor and reboiler. The compressor considered is centrifugal and driven by electricity and the reboiler is a shell and tube. Both pieces of equipment are made of carbon steel.
According to Douglas (1988), Guthrie’s equations, (7) and (8), are adequate to calculate the purchase costs of the compressor and reboiler:
0.82
comp c
M & S
C (US$) 517.5 W F
280
= ⋅ ⋅ ⋅
0.65
rec c
M & S
C (US$) 101.3 A F
280
= ⋅ ⋅ ⋅
(8)
In Equation (7) W varies from 30 to 10,000 hp and in Equation (8) A varies from 200 to 5,000 ft². Fc is the correction factor for material, pressure
level, etc., which depends on the type of equipment. In this case, the Fc of the compressor is
1 (one) and the Fc of the reboiler is 1.35. The
Marshall and Swift Equipment Cost Index called the M&S index, is updated monthly in the Chemical Engineering Magazine. In this work its value was 1,096.7.
Equations (9) and (10) present Guthrie’s correlations for the total costs of the installed equipment for the compressor and reboiler.
(
)
Inst
0.82
comp c
M & S
C (US$) 517.5 W 2.11 F
280
= ⋅ ⋅ ⋅ +
(9)
(
)
Inst
0.65
rec c
M & S
C (US$) 101.3 A 2.29 F
280
= ⋅ ⋅ ⋅ +
(10)
The ratio of the total costs of the installed equipment to the purchase costs of the equipment is 3.11 for the compressor and 2.69 for the reboiler.
The proposal which uses the existing reboiler only accounts for the compressor costs.
INDUSTRIAL CASE
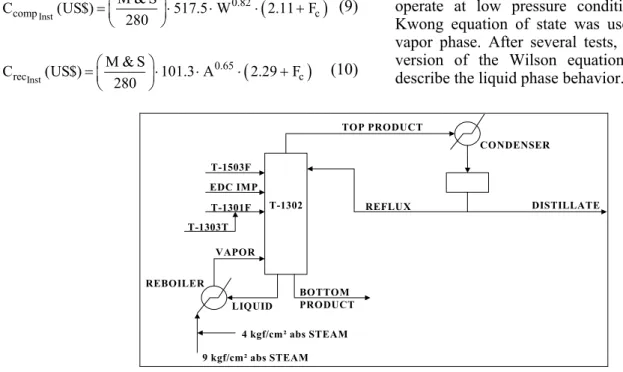
A case study involving the process of DCE purification in a distillation column currently operating in a VCM plant of the Braskem Company in Brazil is presented. This column has the highest steam flow rate in the plant, and Figure 1 describes the existing system.
The Aspen Plus™ commercial simulator was used to simulate the existing configuration. For more real results, its internal routine, RateFrac, was used to calculate nonequilibrium stages, even though to operate at low pressure conditions, the Redlich-Kwong equation of state was used to describe the vapor phase. After several tests, the two-parameter version of the Wilson equation was selected to describe the liquid phase behavior.
T-1503F
EDC IMP
T-1301F
T-1303T
DISTILLATE CONDENSER
REBOILER
T-1302 REFLUX
9 kgf/cm² abs STEAM 4 kgf/cm² abs STEAM
TOP PRODUCT
VAPOR
LIQUID
BOTTOM PRODUCT
Figure 1: Existing configuration of the distillation system.
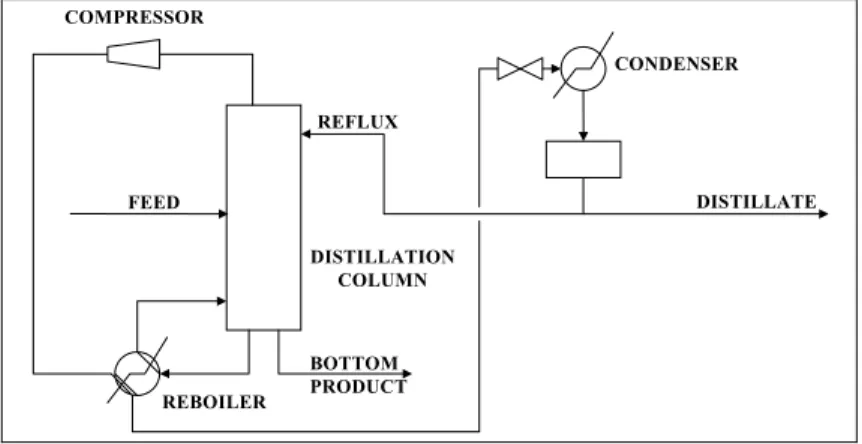
In accordance with the literature, Badger Pan America (1982) presented a report to Braskem Company suggesting some improvements of the main processes in the VCM plant. For the DCE purification area they suggested the use of a heat pump at the top of the column. There were two suggestions: a vapor compression heat pump and a heat pump that flashes the bottom product in the column. In this work, a vapor compression heat pump was used as the proposed configuration, as shown in Figure 2. This proposed configuration was also implemented by using the Aspen Plus™ simulator, as well as the same thermodynamic
The condenseralready being used was adopted for the proposed configuration, which means that the same area was used in the simulations.
It is important to note that in the proposed configuration only two streams did not have a constant temperature and pressure: the stream leaving the compressor and the stream leaving the reboiler for the condenser. All streams had the same composition as the existing configuration.
The procedure to simulate the proposed configuration consisted of simulating five subconfigurations in order to eliminate the use of steam in the existing reboiler. Four of these subconfigurations were based on four differences in temperatures in the reboiler: 1, 10, 20, and 30 °C. The fifth subconfiguration used the existing reboiler. In this case the temperature gradient in the reboiler was 2.82 °C.
BOTTOM PRODUCT
DISTILLATE COMPRESSOR
REFLUX
REBOILER
CONDENSER
DISTILLATION COLUMN FEED
Figure 2: Vapor mechanical compression configuration.
STREAM FROM COMPRESSOR (1a)
STREAM TO CONDENSER (2a)
MIXED STREAM
TO BOIL-UP STREAM (2b)
LIQUID FROM THE BOTTOM (1b)
Figure 3: Reboiler with the proposed configuration.
RESULTS AND DISCUSSION
The results of the existing configuration were validated with data extracted from the plant, and the excellent agreement between the real and the simulated data, as shown in Table 1, was considered satisfactory for validation of the simulation.
Irreversibility rate and efficiency of the equipments involved in both configurations were calculated based on the equations described in Araújo (2003). As described earlier, efficiencies were calculated in accordance with the procedure proposed by Kotas (1995) and stream exergy, in accordance with the procedure proposed by
Hinderink et al. (1996).
There are some peculiar characteristics in this case study:
Almost all chemical exergy was due to DCE;
Exergy of the mixture was very low compared to the
other forms of calculated exergies;
Exergy changes in the system were almost totally
due to physical exergy.
Table 1: Main results for the simulated column.
Real Simulation
Unit Distillate Bottom Distillate Bottom
Temperature °C 55.00 93.79 55.00 95.89
DCE % 99.618 94.291 99.606 96.312
Tetrachloroethylene ppm 140.566 7,541.007 133.340 7,528.010 1,1,2-Trichloroethane ppm 14.799 21,394.996 12.668 23,502.150
Table 2: Calculated stream exergy of the existing configuration.
Stream Exchem (kW) Exphys (kW) Exmix (kW) Extotal (kW)
Reflux 169,219.17 24.44 -9.41 169,234.20
Distillate 310,476.91 44.84 -17.27 310,504.47
Column bottom to reboiler 2,480,398.42 1,968.61 -388.16 2,481,979.98
Top vapor 479,696.07 2,172.59 -28.33 481,840.32
Boil-up stream 2,480,398.42 4,223.39 -388.16 2,484,233.65
T-1303T feed 86,406.16 5.77 -14.19 86,397.75
T-1301F feed 89,432.90 66.01 -11.59 89,487.32
T-1503F feed 129,487.02 105.67 -9.82 129,582.86
DCE IMP feed 70,100.84 27.41 -1.13 70,127.11
Bottom product 64,950.41 52.02 -17.25 64,985.18
Table 3: Thermodynamic evaluation results for the existing configuration.
Equipment/Process Irreversibility (kW) Efficiency (%)
Reboiler 887.00 71.76
Condenser 1,731.97 17.59
Column 242.45 99.68
Global 2,861.42 2.16
The low irreversibility rates (242 kW) and high efficiency (99.68 %) of the column are due to the high concentration of DCE in all streams that comprise the control volume. In other words, the physical exergy is what really causes the difference because of the high physical exergy of the boil-up stream.
However, when the whole system, i.e., including the reboiler and condenser is considered the thermodynamic efficiency is 2.16 %, mainly due to the high exergy of the utilities as inputs in the computation of efficiency.
As presented, there is a great possibility to improve heat exchange processes, particularly in the condenser where the highest exergetic loss (irreversibility rate) and the lowest efficiency are observed.
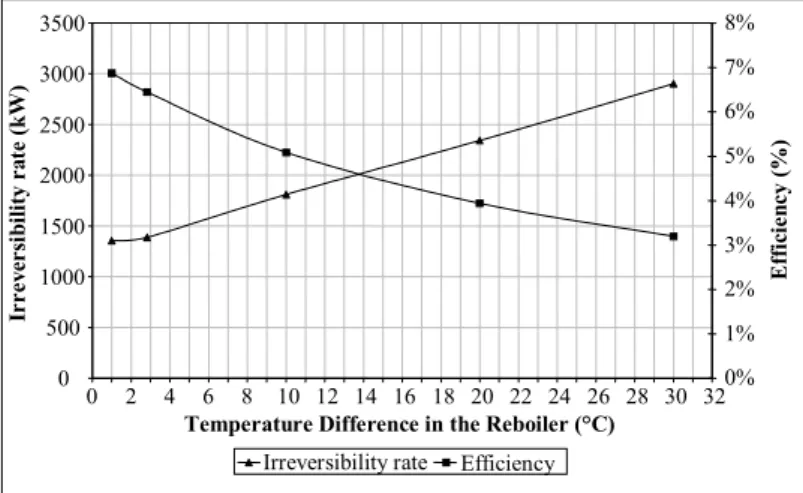
In Figure 4 the overall irreversibility rate and efficiency for the proposed configuration are shown. The equipment with the greatest influence on these results were the reboiler and the condenser. It can be clearly observed that the best subconfigurations are those in which the temperature differences are the smallest.
0 500 1000 1500 2000 2500 3000 3500
0 2 4 6 8 10 12 14 16 18 20 22 24 26 28 30 32
Temperature Difference in the Reboiler (°C)
Ir
r
e
v
ers
ib
il
it
y
ra
te
(
k
W)
0% 1% 2% 3% 4% 5% 6% 7% 8%
Effi
ci
e
n
c
y
(%)
Irreversibility rate Efficiency
Figure 5 is a diagram in which the irreversibility rate distribution for the existing and the proposed configurations are presented. Due to the decrease in heat exchange in this equipment, the irreversibility rate of the condenser in the existing configuration was less than that in the proposed subconfigurations. This is because all the latent heat is exchanged in the reboiler. It can be observed that for temperature differences greater than 10 °C, the reboiler irreversibility rate increases more than that of the
existing configuration. For temperature differences smaller than 10 °C, the total irreversibility of the proposed configuration is more than 50 % lower than that of the existing configuration. At a temperature difference of approximately 30 °C, proposed and existing configurations have similar irreversibility rates. From this point on, the irreversibility rate of the proposed configuration increases more than that of the existing configuration because of the influence of the reboiler.
0 500 1000 1500 2000 2500 3000
Existing 1°C 2.82°C 10°C 20°C 30°C Configuration
T
o
ta
l I
r
re
v
ers
ib
il
ity
(k
W
)
Column Compressor Reboiler Condenser
Figure 5: Irreversibility rate distribution of the configurations studied.
In Figure 6 it can be observed that the compressor costs increase due to the increase in power requirements. The reboiler costs always decrease because of the reduction of its heat exchange area. The subconfiguration where the existing reboiler is used has the lowest capital costs of the system. The increase in capital costs of the system is based almost exclusively on the compressor costs because the reboiler costs tend to decrease slowly.
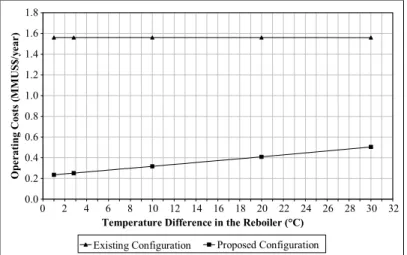
In Figure 7 the operating costs of the system in the existing and proposed configurations are shown. Operating costs are considered those costs related to energetic utilities. Therefore, in the existing case
these costs are due to steam for the reboiler and in the proposed configuration, due to electricity for the compressor. The increase in operating costs of the proposed configuration is due to the increase in power required by the compressor. The big difference between these two costs is because of the appropriate use of energy in the proposed configuration; the large amount of energy from the top stream of the column (12,900 kW) is used to exchange heat at the bottom of the column. Hence, there is a need for only a small amount of energy, which is provided by the compressor to increase the temperature of this stream.
0 1 2 3 4 5 6
0 2 4 6 8 10 12 14 16 18 20 22 24 26 28 30 32 Temperature Difference in the Reboiler (°C)
Compressor Reboiler System
C
a
p
it
a
l Co
st
s (
M
M
US
$
)
Profit obtained by implementing the proposed configuration were calculated based on:
Profit = [Existing operating cost (steam consumption)] -[Proposed operating cost (electricity consumption)] - [Depreciation]
The specific prices used for steam and electricity were the following:
Electricity (high price) = 0.030163 US$/kWh.
Electricity (low price) = 0.020780 US$/kWh.
Steam at 15 kgf/cm²g = 12.53 US$/t.
The time established for equipment depreciation
was for 15 years. It was also assumed that profit would begin to appear in the first year that the proposed configuration was implemented.
The reduction in the profit shown in Figure 8 is due to the increase in the operating costs of the proposed configuration caused by the higher consumption of electricity in the compressor and the increase in its depreciation. IRR was used to measure the profitability of the proposed configuration. In order to consider the implementation of a proposed configuration economically advantageous, the IRR must be higher than 30 % per year.
0.0 0.2 0.4 0.6 0.8 1.0 1.2 1.4 1.6 1.8
0 2 4 6 8 10 12 14 16 18 20 22 24 26 28 30 32 Temperature Difference in the Reboiler (°C)
O
p
er
a
tin
g
C
o
st
s (
M
MU
S
$
/y
ea
r)
Existing Configuration Proposed Configuration
Figure 7: Operating costs of the existing and proposed configurations.
0.80 0.85 0.90 0.95 1.00 1.05 1.10 1.15 1.20 1.25 1.30
0 2 4 6 8 10 12 14 16 18 20 22 24 26 28 30 32 Temperature Difference in the Reboiler (°C)
Pro
fit (M
MU
S
$
/y
ea
r)
Figure 8: Annual profit of the proposed configuration.
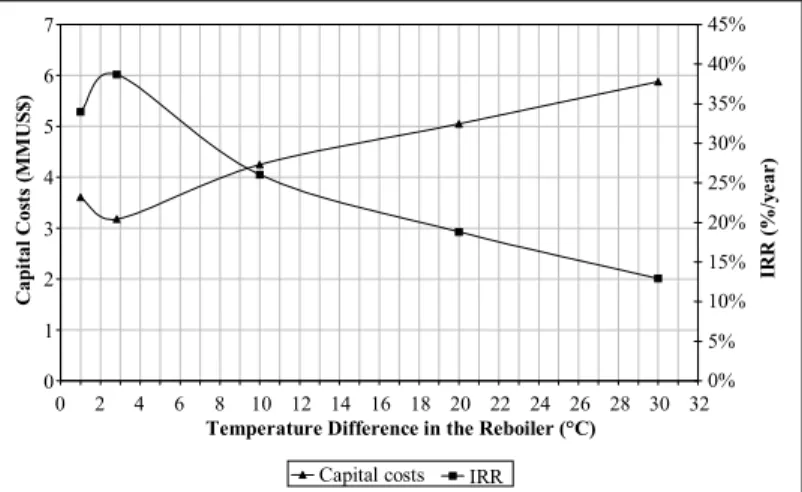
A comparison between the installed capital costs and the IRR for the proposed subconfigurations is presented in Figure 9. It can be seen that the subconfiguration which uses the existing reboiler is the most attractive economically. Moreover, for temperature differences in the reboiler higher than 7 °C, the IRR is lower than the minimum attractive rate, 30 %.
0 1 2 3 4 5 6 7
0 2 4 6 8 10 12 14 16 18 20 22 24 26 28 30 32 Temperature Difference in the Reboiler (°C)
0% 5% 10% 15% 20% 25% 30% 35% 40% 45%
Ca
p
it
a
l C
o
st
s (
M
M
U
S$
)
IR
R (%/
y
ea
r)
Capital costs IRR
Figure 9: Relation between cost of installation and IRR for the proposed configuration.
0% 1% 2% 3% 4% 5% 6% 7% 8% 9% 10%
0 2 4 6 8 10 12 14 16 18 20 22 24 26 28 30 32
Temperature Difference in the Reboiler (°C)
0% 5% 10% 15% 20% 25% 30% 35% 40%
IRR (
%
/y
e
a
r)
Efficiency by Kotas IRR
Effi
ci
e
n
c
y
(%
)
Figure 10: Relation between rational efficiency and IRR of the proposed configuration.
CONCLUSIONS
A comparison between the real and the simulated data for the existing configuration shows good agreement, which leads us to conclude that the selection of the thermodynamic and column models was correct. In the thermodynamic approach, the high efficiency of the column is due to the high concentration of DCE present in all streams. However, for the whole system the thermodynamic efficiency is very low. The major possibility to improve efficiency is the heat exchange process.
In agreement with the literature, a vapor compression heat pump improves the thermodynamic performance of a distillation column. The substantially lower condenser irreversibility rate in the proposed sub-configurations is the principal reason for the improvement in thermodynamic efficiency. Furthermore, the most appropriate subconfiguration proposed is the one in which the temperature difference in the reboiler tends
to zero.
The big difference between the operating costs of the existing configuration and those of the proposed configuration results from the appropriate use of energy in the latter. However, contrary to an exergetic point of view, low temperature differences in the reboiler will not be a benefit, due to the need for large areas. For temperature differences in the reboiler higher than 7 °C, the IRR is lower than the minimum attractive rate (30 %).
Based on the exergetic and economic evaluations of the proposed subconfigurations, the most attractive subconfiguration is that in which the existing reboiler is used together with a suitable compressor.
ACKNOWLEDGMENTS
REFERENCES
Araújo, A. C. B., Exergetic Analysis as a Tool for Optimization of Distillation Processes. Master’s Thesis, Federal University of Campina Grande, Brazil (2003).
Badger Pan America, Inc., Modification Studies: Vinyl Chloride Monomer Plant, Companhia Petroquímica Camaçari, Alagoas – Brazil (1982). Douglas, J. M., Conceptual Design of Chemical
Processes. McGraw-Hill Book Company, New York (1988).
Fonyo, Z., Kurrat, R., Rippin, D. W. T., and Meszaros, I., Comparative Analysis of Various Heat Pump Schemes Applied to C4 Splitters, Computers Chemical Engineering, 19, S1-S6 (1995).
Henley, E. J. and Seader, J. D., Equilibrium-Stage Separation Operations in Chemical Engineering. John Wiley and Sons Inc., New York (1981).
Hinderink, A. P., Kerkhof, F. P. J. M., Lie, A. B. K., De Swaan Arons, J., and Van Der Kooi, H. J., Exergy Analysis with a Flowsheeting Simulator – I. Theory; Calculating Exergies of Material Streams, Chemical Engineering Science. No. 51, 4693-4700 (1996).
King, C. J., Separation Process. McGraw-Hill Book Company, New York (1971).
Kotas, T. J., The Exergy Method of Thermal Plant Analysis. Krieger Publishing Company, Florida (1995).
Null, H. R., Heat Pump in Distillation, Chemical Engineering Process, 7, No 72, 58-64 (1976). Smith, J. M., Van Ness, H. C., and Abbott, M. M.,
Introduction to Chemical Engineering Thermodynamics. McGraw-Hill Book Company, New York (1996).