www.ramb.org.br
Revista da
ASSOCIAÇÃO MÉDICA BRASILEIRA
Original article
Correlation between indicators of abdominal obesity and
serum lipids in the elderly
☆
Fabiana Lucena Rocha*, Tarciana Nobre de Menezes, Rômulo Lustosa Pimenteira de Melo,
Dixis Figueroa Pedraza
Universidade Estadual da Paraíba (UFPB), Campina Grande, PB, Brazil
A R T I C L E I N F O
Article history:
Received 29 May 2012 Accepted 14 September 2012
Keywords:
Elderly
Abdominal obesity Dyslipidemias
A B S T R A C T
Objective: To verify the correlation between anthropometric indicators of abdominal obesity and serum lipids in the elderly.
Methods: Cross-sectional, descriptive, and analytical study conducted with elderly individuals of both genders enrolled in the Family Health Strategy Program of Campina Grande/PB. Abdominal obesity was assessed by waist circumference (WC), abdominal circumference (AC), and waist/hip ratio (WHR). Lipid profile was verified by levels of triglycerides (TG), total cholesterol (TC), high-density lipoprotein (HDL), low-density lipoprotein (LDL), and non-high density lipoprotein (non-HDL).
Results: A total of 321 elderly patients were evaluated (67.6% women). There were significant correlations between abdominal obesity indicators and lipid levels only in the group of women. WC, AC, and WHR correlated with TG and HDL. Only WHR showed correlation with non-HDL. The highest correlations were observed between WHR and TG (r = 0.292, p < 0.01) and between WC and HDL (r = -0.281, p < 0.01). WC was a predictor of 9.2% of the variation in HDL, and WHR was a predictor of 7.3% of the variation in TG.
Conclusion: The indicators of abdominal obesity that best correlated with serum lipids in elderly women were WC and WHR. They were predictors of alterations in HDL and TG levels in women, respectively
© 2013 Elsevier Editora Ltda. All rights reserved.
☆Study conducted at the Epidemiological Research and Study Center, Postgraduate Program in Public Health of Universidade
Estadual da Paraíba, Campina Grande, PB, Brazil
*Corresponding author at: Rua Arruda Câmara, 112, Santo Antonio, Campina Grande, PB, 58406-000, Brazil E-mail address: [email protected] (F.L. Rocha)
0104-4230/$ – see front matter © 2013 Elsevier Editora Ltda. All rights reserved.
Palavras-chave:
Idoso
Obesidade abdominal Dislipidemias
Correlação entre indicadores de obesidade abdominal e lipídeos séricos em idosos
R E S U M O
Objetivo: Verificar a correlação entre os indicadores antropométricos de obesidade abdominal e lipídeos séricos em idosos.
Introduction
The elderly represent the fastest growing population
in Brazil in recent years.1 The marked and accelerated
aging of the population is associated with increased prevalence of chronic non-transmissible diseases, such as
cardiovascular disease.2 In the last three decades, there has
been a decrease in mortality from cardiovascular disease in developed countries. However, in developing countries such as Brazil, the picture of cardiovascular disease tends to increase and persist, with an impact on the country’s
morbidity and mortality profile.3 This is due mainly to
sedentary lifestyles and hypercaloric diets, which result in a metabolic overload, increasing the incidence of several
diseases such as obesity and dyslipidemia.4,5
The accumulation of fat in the abdominal region or abdominal obesity is an important risk factor for several diseases, and represents a differentiated risk when
compared to other forms of body fat distribution.6 Rezende
et al.7 observed that abdominal obesity in adults and in the
elderly correlated with most cardiovascular risk factors, especially high levels of triglycerides (TG) and reduced levels of high-density lipoproteins (HDL), with an impact on blood pressure levels.
Similar to abdominal obesity, serum lipid concentrations are important risk factors for cardiovascular diseases. Cardiovascular mortality in the elderly is associated with reduced HDL and high levels of triglycerides. Moreover, dyslipidemia and obesity are common in
this age range.8 When investigating the lipid profile, in
addition to commonly assessed lipid fractions, non-HDL fraction assessment has been recently recommended, as it encompasses other atherogenic particles and thus is better than low-density lipoprotein (LDL) to assess
cardiovascular risk.3
Considering these aspects, the importance of the topic, as well as the impact of chronic diseases in Brazil and worldwide, there is an increasing need for studies in the
Northeast region of Brazil, which could be used as basis for comparison with studies conducted in other regions, considering the differences among them and the needs of each population. Therefore, the present study was conducted to verify the influence of abdominal obesity on serum lipid profile in the elderly.
Methods
This was a cross-sectional, home-based study, which was part of a larger study that aimed to assess the health of an elderly population enrolled at the Family Health Strategy (FHS) program, using a multidimensional approach, as well as the degree of satisfaction with the healthcare services offered in the city of Campina Grande, state of Paraiba, Brazil.
The sample was calculated with an estimated prevalence of outcomes of at least 25% (Menezes TN, unpublished results), a confidence level of 95%, and a margin of error of 6% . The sampling procedure was performed by clusters. The primary sampling units were the six Health Districts of the city, which were divided into six Basic Family Health Units (UBSF). In each UBSF chosen by drawing lots, the number of elderly individuals enrolled at the unit was verified and the individuals were systematically selected through proportional drawings, which resulted in a sample of 420 elderly individuals. To perform the random selection, a list was made including the names of all elderly enrolled in each UBSF. The number of individuals to be skipped until the next individual on the list to be interviewed was defined as the ratio between the total number of enrolled elderly and the number of elderly set to be interviewed at that UBSF, which was 5:1. Thus, for each selected elderly, four individuals on the list were skipped. This procedure was used in order to achieve better distribution and guarantee that the entire list would be covered.
foi verificada por meio da circunferência da cintura (CC), circunferência do abdome (CA) e razão cintura/quadril (RCQ). O perfil lipídico foi verificado por meio das frações triglicerídeo (TG), colesterol total (CT), lipoproteína de alta densidade (HDL), lipoproteína de baixa densidade (LDL) e lipoproteína de não alta densidade (não HDL).
Resultados: Foram avaliados 321 idosos (67,6% mulheres). Verificaram-se correlações significativas entre os indicadores de obesidade abdominal e as frações lipídicas apenas no grupo das mulheres. A CC, CA e RCQ se correlacionaram com TG e HDL. Apenas a RCQ apresentou correlação com não HDL. Os maiores coeficientes foram entre RCQ e TG (r = 0,292; p < 0,01) e entre CC e HDL (r = -0,281; p < 0,01). A CC foi preditora de 9,2% da variação do HDL e a RCQ de 7,3 % da variação do TG.
Conclusão: Os indicadores de obesidade abdominal que melhor se correlacionaram com lipídeos séricos em mulheres idosas foram CC e RCQ. Os mesmos foram preditores de alterações nos níveis de HDL e TG das mulheres, respectivamente.
The study included individuals of both genders, aged 60 or older, who were selected for the study. Exclusion criteria were: individuals with end-stage diseases, or those with severe clinical weakness that made it difficult to perform the research protocol; those receiving antihyperlipidemic agents; individuals who were bedridden or needed a wheelchair; those who did not have a caregiver, if it was necessary; and those who were not in the city at the time of study fieldwork in the area covered by the UBSF where they were enrolled, who were replaced by the subsequent elderly in the systematic selection.
Data collection was performed from August, 2009 to May, 2010, by three pairs of interviewers, trained by one of the authors, who is a nutritionist and has experience in anthropometric assessment of the elderly. Subjects were interviewed at home, and the elder was asked to come to the UBSF for blood collection after a 12-hour fast, at a pre-established date and time.
Abdominal obesity was assessed by waist circumference (WC), abdominal circumference (AC), and waist/hip ratio (WHR). Hip circumference (HC) was measured to calculate the WHR. Circumferences were measured based on the
techniques of Callaway et al.9
Lipid profile was determined by the values of total cholesterol (TC), HDL, TG, LDL, and non-high-density lipoprotein (non-HDL). TC, TG, and HDL levels were determined by enzymatic colorimetric method
(KIT BIOTÉCNICA®). Non-HDL and LDL levels were determined
according to the recommendations of the IV Brazilian
guidelines on dyslipidemia and atherosclerosis prevention.3
The database was developed using Microsoft Office Excel, version 7.0. Data were entered twice in order to check for possible inconsistencies and ensure quality of information. Statistical information was obtained with the Statistical Package for Social Science (SPSS 16.0) software. A significance level of 5% was established for all analyses.
The Kolmogorov-Smirnov test was performed to verify
the normality of variable distribution. Student’s t-test
and one-way analysis of variance (ANOVA) with post-hoc LSD test were used to compare the means of parametric variables. Kruskal-Wallis and Mann-Whitney tests were used for nonparametric variables. Pearson’s or Spearman’s correlation coefficients were used for correlation analysis. The criteria used to determine the correlation strength
were proposed by Dancey and Reidy.10 Two multiple
linear regressions were performed to verify the influence of variables WC, AC, and WHR on TG and HDL variability, respectively. The stepwise method was used to include the variables in the multiple linear regression equations.
The project was approved by the Ethics Committee of the Universidade Estadual da Paraíba (CAAE: 0228.0.133.000-08). Data collection occurred after the informed consent was signed by all study subjects. The research was funded by the National Council for Scientific and Technological Development (Conselho Nacional de Desenvolvimento Científico e Tecnológico – CNPq) and the Ministry of Science and Technology (Ministério da Ciência e Tecnologia – MCT) (Universal Resolution MCT/CNPq 15/2007 – Protocol No. 479579/2007-5).
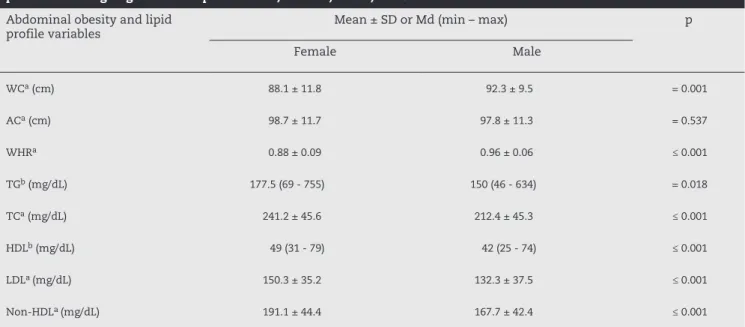
Table 1 – Mean and standard deviation or median. and range of variables indicative of abdominal obesity and lipid profile according to gender. Campina Grande, Paraíba, Brazil, 2009-2010.
Abdominal obesity and lipid
profile variables Mean ± SD or Md (min – max) p
Female Male
WCa (cm) 88.1 ± 11.8 92.3 ± 9.5 = 0.001
ACa (cm) 98.7 ± 11.7 97.8 ± 11.3 = 0.537
WHRa 0.88 ± 0.09 0.96 ± 0.06 ≤ 0.001
TGb (mg/dL) 177.5 (69 - 755) 150 (46 - 634) = 0.018
TCa (mg/dL) 241.2 ± 45.6 212.4 ± 45.3 ≤ 0.001
HDLb (mg/dL) 49 (31 - 79) 42 (25 - 74) ≤ 0.001
LDLa (mg/dL) 150.3 ± 35.2 132.3 ± 37.5 ≤ 0.001
Non-HDLa (mg/dL) 191.1 ± 44.4 167.7 ± 42.4 ≤ 0.001
SD, standard deviation; Md, median; Min, minimum value; Max, maximum value; WC, waist circumference; AC, abdominal circumference; WHR, waist-to-hip ratio; TG, triglycerides; TC, total cholesterol; HDL, high-density lipoprotein; LDL, low-density lipoprotein; non-HDL, non-high density lipoprotein.
a Student’s t-est;
Results
Of the 420 elderly patients studied, 363 participated in both phases of the research. Of these, 42 were excluded to avoid interference in the correlations, as they were using antihyperlipidemic drugs. Thus, 321 elderly individuals were evaluated in this study (67.6% women). The age ranged from 60 to 104 years; the mean age in women was 71.04 years (SD = 9.08) and 71.15 years in men (SD = 8.1). Most elderly individuals belonged to the age range of 60 to 69 years (50.8%).
The mean values of WC and WHR in men were significantly higher than those in women. Only the AC was not significantly different between groups. Regarding the biochemical variables, lipid levels were significantly higher in women than in men for all variables (Table 1).
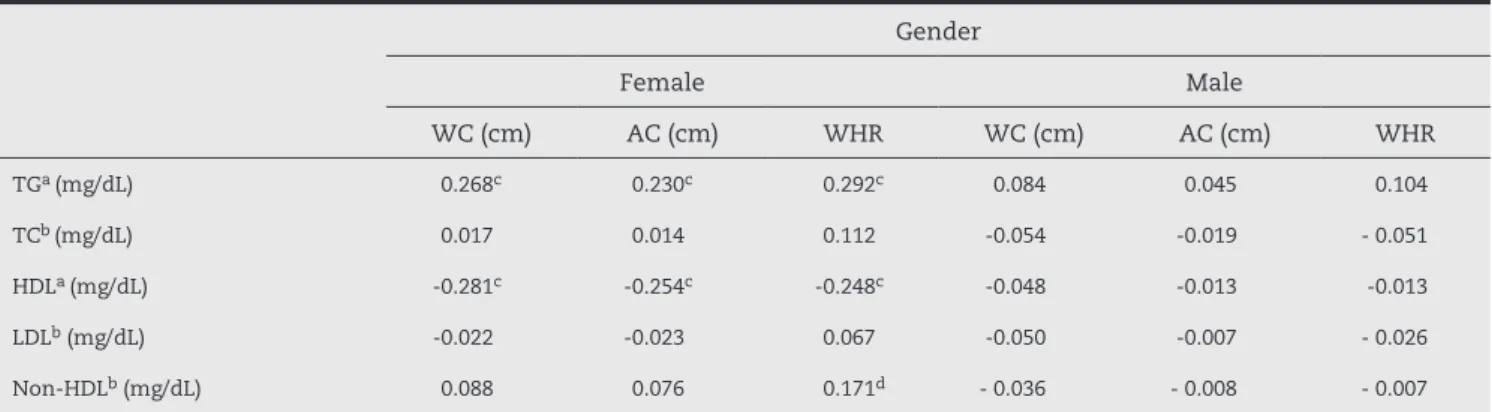
Table 2 shows the results of the bivariate analysis between lipid variables and abdominal obesity. There were no significant correlations among variables for the
male gender. However, there were weak, but significant correlations in females. TG levels were directly correlated with all the variables of abdominal obesity, but the highest correlation coefficient was observed with WHR (r = 0.292, p < 0.01). HDL showed inverse correlations with all abdominal obesity variables, and WC showed the highest correlation coefficient with HDL (r = - 0.281, p < 0.01). Non-HDL was directly correlated with WHR (r = 0.171, p < 0.05).
Multivariate analysis using multiple linear regression was performed only in the group of women, as the men did not present statistically significant correlations. After testing all the variables that presented significant correlations, the multiple linear regression results showed that, among the independent variables, only WHR and WC significantly influenced the variability of TG and HDL levels, respectively.
WHR explained 7.3% of the variation in TG levels (R2 = 0.073)
and WC explained 9.2% of variation in HDL levels in the
studied elderly women (R2 = 0.092). The other variables were
excluded from the model due to strong collinearity (Table 3).
Table 2 – Correlation between the variables indicative of abdominal obesity and lipid profile variables, according to gender. Campina Grande, Paraíba, Brazil, 2009-2010.
Gender
Female Male
WC (cm) AC (cm) WHR WC (cm) AC (cm) WHR
TGa (mg/dL) 0.268c 0.230c 0.292c 0.084 0.045 0.104
TCb (mg/dL) 0.017 0.014 0.112 -0.054 -0.019 - 0.051
HDLa (mg/dL) -0.281c -0.254c -0.248c -0.048 -0.013 -0.013
LDLb (mg/dL) -0.022 -0.023 0.067 -0.050 -0.007 - 0.026
Non-HDLb (mg/dL) 0.088 0.076 0.171d - 0.036 - 0.008 - 0.007
WC, waist circumference; AC, abdominal circumference; WHR, waist-to-hip ratio; TG, triglycerides; TC, total cholesterol; HDL, high-density lipoprotein; LDL, low-density lipoprotein; non-HDL, non-high density lipoprotein.
a Spearman’s correlation; b Pearson’s correlation; cp< 0.01; dp< 0.05.
Table 3 – Analyses of multiple linear regressions performed to estimate the prediction of markers of abdominal obesity based on lipid levels in women. Campina Grande, Paraíba, Brazil, 2009-2010.
TG (mg/dL)
R R2 Coefficient of error β t F p
WHR 0.270 0.073 103.015 0.27 4.064 16.5 0.001
HDL (mg/dL)
R R2 Coefficient of error β t F p
WC (cm) 0.303 0.092 9.884 - 0.303 - 4.599 21.1 0.001
Discussion
Regarding the assessment of abdominal obesity, all studies herein reported were assessed regarding the anatomical point used to measure the waist and abdominal circumferences. For comparison and interpretation of results, the WC cases were those where the authors of the studies used the same anatomical point adopted in this methodology, even when the author called it AC. The same applies to the AC.
Abdominal obesity, as well as lipid profile in the elderly, is a subject that has been studied in various countries and including Brazil. It is noteworthy that abdominal obesity has been consistently associated with certain diseases, such as cardiovascular disease, as reported by
longitudinal11,12 and cross-sectional studies.7,13 Lipid
profile is also the subject of research in this age range; however, research addressing this issue in certain areas of Brazil is still needed, as demonstrated by the lack of isolated studies in the literature performed in the Northern region, and only one study in the Northeastern region of
Brazil.14 Two multicenter studies reported the participation
of these two regions.15,16
The results found in this study for AC corroborate those
found by Girotto et al.,17 who studied hypertensive adults
and elderly individuals and have also found higher mean AC
among women. The II cardiogeriatrics guideline18 suggests
suitable AC values < 88 cm for women and < 102 cm for men. Based on these recommendations, it appears that the mean AC in women in this study is higher than desirable. The only study in the literature performed with elderly individuals, using the same anatomical landmarks herein to measure WC
and AC, was also performed in Campina Grande/PB.14 The
authors used the same risk classification proposed by the abovementioned guideline and observed that women were at increased risk for cardiovascular disease when evaluated by the WC and AC, but the risk was slightly higher when evaluated by the AC. The opposite situation was observed
in men.14
In spite of the slight difference found between the mean values of WC and AC, the results of this study suggest that the anatomical point used to measure the circumferences can influence the evaluation of individual and abdominal obesity. The variation in the techniques used in the studies makes the
comparison of results difficult. Wang et al.19 observed this
variation in both genders when comparing different points of measurement, with the variation being higher among women. When assessing the difference between the mean values of WC and AC, the authors found a difference of 10 cm in women and 4 cm in men. Thus, in the present study, the authors decided to standardize the circumference nomenclature according to
the protocol used by the aforementioned studies.14,17,18
A significant difference was observed between the mean values of WHR in elderly men and women in Campina Grande,
PB, Brazil.14 In Joinville, state of Santa Catarina, in Southern
Brazil, higher mean values of WHR were found among elderly
men, but with no statistical significance.20 The recommended
standard for WHR values in elderly individuals is ≤ 0.99
cm for men and ≤ 0.97 for women.18 When comparing the
present results with this recommendation, it appears that the elderly individuals showed mean values of WHR below those recommended as the threshold limit value for metabolic risk. WHR is an indicator that involves the hip region, where there are large muscle groups involved with increased insulin
resistance.14 Compared to WC, WHR is not the best indicator
of metabolic risk.21 A recent review reported the superiority
of WC when estimating the increase in visceral adipose tissue
that occurs with the aging process.6
Moreover, even with changes in body fat, WHR may not be altered, as the index results from a ratio between two circumferences, of which values can vary correspondingly, without modifying the final ratio. However, WHR is considered a better indicator of fat mass in the elderly compared to body
mass index (BMI).11
In this study, the highest lipid levels were found in the group of women, dissimilar from the results of the study
by Souza et al.22 regarding TG and HDL. That study found
levels of TG and HDL in males that were higher than those in females. However, regarding TC and LDL, the results found agree with those in the present study, which found higher levels in women compared to men.
Overall, the differences between men and women regarding lipid levels can be explained by hormonal differences between the genders. After menopause, the end of estrogen production by the ovaries causes alterations in lipid levels, with high levels of TC, LDL and TG, which may put women at risk for certain diseases, when compared to men. Concerning cardiovascular disease, women present signs and symptoms of CVD between ten and 15 years later than men. It has not been clarified whether there is a protective effect of estrogen until menopause or male
sexual hormones are more associated with atherogenesis.18
The influence of hypertriglyceridemia on coronary heart disease development remains unclear, but it is known that TG values > 150 mg/dL can lead to metabolic disorders; the
recommended ideal value for TC is < 200 mg/dL.3 Therefore,
it appears that the elderly of both genders in this study have mean serum concentrations of TG and TC above the desirable levels. Regarding HDL, the recommended values
are ≥ 50 mg/dL for women and ≥ 40 mg/dL for men.3
The reduced median value of HDL found among women in this study emphasizes the need for risk factor surveillance, considering that serum HDL ≤ 50 mg/dL (in women) and triglycerides ≥ 150 mg/dL are components of dyslipidemia, which characterizes metabolic syndrome, with a greater impact on the incidence of cardiovascular disease in women, especially menopausal ones, than
in men.18
The LDL values found for the elderly in this study were
higher when compared with those found by Souza et al.,22
but the values are within the desirable range, compared with those recommended by the IV Brazilian guideline
though LDL is related to the formation of atherosclerotic plaque, there is no consensus on whether the elderly are more vulnerable than young people; several risk factors accumulated over the years may be associated and
influence the onset of atherosclerosis.23
There have been few studies that used non-HDL when analyzing lipid fractions, especially in Brazil, making it difficult to compare the data from this study with data from other Brazilian studies. However, international studies show the importance of using this lipid fraction in the investigation of risk factors for diseases, especially
in the elderly.24,25 Kawamoto et al.,24 studying Japanese
elderly individuals, found significantly higher serum concentrations of non-HDL cholesterol in women when compared to men, which is consistent with the data from this study. The authors observed that the non-HDL level is a potential predictor of risk for carotid atherosclerosis in the elderly.
The ideal value of non-HDL should be up to 30
mg/dL above the LDL value.3 When comparing this
recommendation with the mean serum concentrations of non-HDL found in this sample, slightly high values were observed, stressing the importance of using this fraction more often in lipid profile assessment.
The association between abdominal obesity and dyslipidemia was observed in a study of hypertensive elderly individuals, where subjects with higher serum levels of TC, TG, and low HDL levels were those who had
abdominal obesity.14 This may be due to the high metabolic
activity of the abdominal adipose tissue.22 Shimano et
al.25 found that patients with high serum concentrations
of non-HDL cholesterol values were significantly higher waist circumference of serum TC, LDL, TG, and lower concentrations of HDL, confirming the influence of abdominal obesity on lipid concentrations. In elderly subjects, dyslipidemia represents a risk factor for coronary heart disease, but this risk decreases with increasing age. The prevalence of hypercholesterolemia in the elderly is higher among women and more frequent between 65 and
74 years; after that age, it begins to decline.26
The correlations found in this study show a weak but significant association between the variables in the elderly group. Results of this study were similar to those found by
Krause et al.27 who studied older women and found that
WC and WHR were directly associated with TG levels and inversely associated with HDL levels. Corroborating these results, a weak, but significant association between WC and WHR with TG, and an inverse association between WC and WHR with HDL were observed in adults with and without metabolic syndrome. However, WHR was the variable that showed the highest correlation coefficient with TG, confirming the relevance of this lipid fraction in relation to the “hypertriglyceridemic waist”, associated
with metabolic syndrome and cardiovascular risk.28
Regarding the associations found, the results of this
study are similar to those of Willis et al.,13 who also
found a higher association between HDL and WC, when
compared to AC. Although they did not show that in their study, the authors reported that TG, TC, and LDL showed no significant correlations with WC among women.
In this study, as in that by Willis et al.,13 no significant
correlations were found in men, but a correlation was
found between TG and WC in women. Nagatsuyu et al.,8
when studying elderly individuals in Ribeirão Preto, state of São Paulo, Brazil, found significant positive associations between TG and AC in the total sample. However, when assessing by gender, this association was present only in the group of women. The authors also observed a negative correlation between HDL and AC, but when assessing by
gender, they found no statistical significance,8 suggesting
that the strength of the association between the variables was due to the presence of the women, reinforcing the idea of the influence of gender on the association between anthropometric variables and lipid levels.
In the present study, the association between the variables in males was weak and not statistically
significant. However, studies28,29 have shown that the
association between the same variables, when found in young or middle-aged individuals, are strong or, when weak, they are statistically significant, suggesting the influence of age on the strength of correlations.
The results of the linear regressions in this study show that the contribution of WHR and WC on TG and HDL variability, respectively, is small in women. WHR was the variable that best explained the variation in serum TG in women. WHR was predictive of total mortality in a longitudinal study carried out with elderly individuals treated in outpatient geriatric clinics, where WHR ≥ 0.97 represented a higher risk of total mortality, different from
those who had higher AC.30 This association is explained by
the fact that abdominal obesity is an indicator of metabolic alterations, whose consequences are hypertension, insulin resistance, glucose intolerance, increased levels of LDL and
TG, as well as reduced levels of HDL.3,27
In this study, WC influenced the variation in serum concentrations of HDL. There are few studies using WC as a predictor of lipid abnormality in the elderly, making it difficult to compare results with this variable. However, the longitudinal study “The Nurses’ Health Study” showed that AC was a predictor of coronary heart disease in adult and elderly women, but among the elderly the association
between AC and mortality was lower.12 The predictive
value of metabolic complication of this variable seems to decrease in the elderly. No studies were retrieved in the literature that had assessed the influence of these variables on the variability of lipid levels. However, the strength of the observed correlations suggests little influence of these indicators of abdominal obesity. It is noteworthy that cross-sectional studies are limited to verify prediction and, therefore, methodological differences must be considered when comparing the results.
model can guide future studies when investigating other variables relevant to the alterations in TG and HDL, considering the existence of unexplained variability. This study was one of the few in Brazil that employed both WC and AC in the elderly, making it difficult to compare findings. Thus, the standardization of the nomenclature adopted in this study is a differential, as no study was found in the literature referring the nomenclature standardization of WC and AC anatomical points for comparison of results.
Conclusion
WC and WHR were the obesity indicators that best correlated with serum lipids. Gender influenced the correlations and therefore should be considered in the investigations, as well as variations between the age groups.
It is suggested that non-HDL should be investigated more often, considering it is a good marker of cardiovascular risk. AC should be studied together with the WC through longitudinal studies, to define the best measurement technique and specific cutoffs for elderly individuals. It is necessary to standardize the measurement of WC, referred to by some researchers as AC, due to discrepancies regarding the anatomical point used to measure these variables.
The use of non-HDL to evaluate the lipid profile in the elderly in Brazil has not been reported in the literature; the present results are thus relevant to introduce the discussion of data from a study addressing this issue, carried out in an elderly population from a city in Northeast Brazil. Thus, the study draws attention to the surveillance of risk factors for chronic non-transmissible diseases in the elderly and raises important questions about some aspects little investigated in this population.
Conflict of interest
All authors declare to have no conflict of interest.
R E F E R E N C E S
1. IBGE. Projeção da População do Brasil/ IBGE: População Brasileira envelhece em ritmo acelerado. [cited 2011 jul 10]. Available from: http://www.ibge.gov.br/home/presidencia/ noticias/noticia_visualiza.php?id_noticia=1272.
2. Gottlieb MGV, Schwanke CHA, Gomes I, Cruz
IBM. Envelhecimento e longevidade no Rio Grande do Sul: um perfil histórico, étnico e de morbi-mortalidade dos idosos. Rev Bras Geriatr Gerontol. 2011;14(2):365-80. 3. Sposito AC, Caramelli B, Fonseca FAH, Bertolami MC. IV
diretriz brasileira sobre dislipidemias e prevenção da aterosclerose. Arq Bras Cardiol. 2007;88(Supl 1):2-19.
4. Martinez TLR, Santos RD, Armaganijan D, Torres KP, Loures-Vale A, Magalhães ME, et al. Campanha nacional de alerta sobre o colesterol elevado – determinação do nível de colesterol elevado de 81.262 brasileiros. Arq Bras Cardiol. 2003;80(6):631-4.
5. Silva AGM, Zogaib FG, Amorim LAC, Fernandes Filho J, Fortes MSR, Dantas EHM. Estudo de associação entre o padrão de distribuição de gordura corporal e o perfil lipídico de mulheres adultas praticantes de atividade aquática. Fit Perf J. 2006;5(3):161-7.
6. Vasques ACJ, Priori SE, Rosado LEFPL, Franceschini SCC. Utilização de medidas antropométricas para a avaliação do acúmulo de gordura visceral. Rev Nutr. 2010;23(1):107-18. 7. Rezende FAC, Rosado LEFPL, Ribeiro RCL, Vidigal FC,
Vasques ACJ, Bonard IS, et al.Índice de massa corporal e circunferência abdominal: associação com fatores de risco cardiovascular. Arq Bras Cardiol. 2006;87(6):728-34. 8. Nagatsuyu DT, Moriguti EKU, Pfrimer K, Formighieri
PF, Lima NKC, Ferriolli E, et al. O impacto da obesidade abdominal sobre os níveis plasmáticos de lípides nos idosos. Medicina (Ribeirão Preto). 2009;42(2):141-7. 9. Callaway CW, Chumlea WC, Bouchard C, Himes JH,
Lohman TG, Martin AD, et al. Circumferences. In: Lohman TG, Roche AF, Martorell R. Anthropometric standardization reference manual. Champaign, Illinois: Human Kinetics Books; 1988.
10. Dancey CP, Reidy J. Análise de correlação: o r de Pearson. In: Dancey CP, Reidy J. Estatística sem matemática para psicologia. Porto Alegre: Artmed; 2006. p. 178-216. 11. Cabrera MAS, WajngartenM, Gebara OCE, Diament J.
Relação do índice de massa corporal, da relação cintura-quadril e da circunferência abdominal com a mortalidade em mulheres idosas: seguimento de 5 anos. Cad Saúde Pública. 2005;21(3):767-5.
12. Rexrode KM, Carey VJ, Hennekens CH, Walters EE, Colditz GA, Stampfer MJ, et al. Abdominal adiposity and coronary heart disease in women. JAMA. 1998;280(21):1843-8. 13. Willis LH, Slentz CA, Houmard JA, Johnson JL, Duscha
BD, Aiken LB, et al. Minimal versus umbilical waist circumference measures as indicators of cardiovascular disease risk. Obesity. 2007;15(3):753-9.
14. Montenegro Neto NA, Simões MOS, Medeiros ACD, Portela AS, Dantas PMS, Knackfuss MY. Estado nutricional alterado e sua associação com perfil lipídico e hábitos de vida em idosos hipertensos. Arch Latinoam Nutr. 2008;58(4):350-6. 15. Pereira JC, Barreto SM, Passos VMA. O perfil da saúde
cardiovascular dos idosos brasileiros precisa melhorar: estudo de base populacional. Arq Bras Cardiol. 2008;91(1):1-10.
16. Taddei CFG, Ramos LR, Moraes JC, Wajngarten M, Libberman A, Santos SC, et al. Estudo multicêntrico de idosos atendidos em ambulatórios de cardiologia e geriatria de instituições brasileiras. Arq Bras Cardiol. 1997;69(5):327-33.
17. Girotto E, Andrade SM, Cabrera MAS. Prevalência de obesidade abdominal em hipertensos cadastrados em uma unidade de saúde da família. Arq Bras Cardiol. 2010;94(6):754-62.
18. Gravina CF, Rosa RF, Franken RA, Freitas EV, Liberman A, et al. Sociedade Brasileira de Cardiologia. II Diretrizes Brasileiras em Cardiogeriatria. Arq Bras Cardiol. 2010;95(3 supl 2):1-112.
measured at 4 sites. Am J Clin Nutr. 2003;77(3):379-84. 20. Mastroeni MF, Mastroeni SSBS, Erzinger GS, Marucci
MFN. Antropometria de idosos residentes no município de Joinville-SC, Brasil. Rev Bras Geriatr Gerontol. 2010;13(1):29-40.
21. Lean M, Han TS, Seidell JC. Impairment of health and quality of life in people with large waist circumference. Lancet. 1998;351(9106):853-6.
22. Souza JL, Souto Filho JTD, Souza TF, Reis AFF, Gicovate Neto C, Bastos DA, et al. Prevalência de dislipidemia e fatores de risco em Campos dos Goytacazes – RJ. Arq Bras Cardiol. 2003;81(3):249-56.
23. Lima J, Fonollosa V, Vilardell M. Aterogénesis. Factores de riesgo cardiovascular en el anciano. Rev Mult Gerontol. 2003;13(3):166-80.
24. Kawamoto R, Oka Y, Tomita H, Kodama A. Non-HDL cholesterol as a predictor of carotid atherosclerosis in the elderly. J Atheroscler Thromb. 2005;12(3):143-8.
25. Shimano H, Arai H, Harada-Shiba M, Ueshima H, Ohta T, Yamashita S, et al. Proposed guidelines for hypertriglyceridemia in Japan with non-HDL cholesterol as the Second Target. J Atheroscler Thromb. 2008;15(3):116-21.
26. Moriguchi EH, Michelson E, Vieira JLC. Dislipidemia em idosos. In: Freitas E, Py L, editors. Tratado de geriatria e gerontologia. Rio de Janeiro: Guanabara Koogan; 2002. p. 239-48.
27. Krause MP, Hallage T, Gama MPR, Sasaki JE, Miculis CP, Buzzachera CF, et al. Associação entre perfil lipídico e adiposidade corporal em mulheres com mais de 60 anos de idade. Arq Bras Cardiol. 2007;89(3):163-6.
28. Rocha NP, Siqueira-Catania A, Barros CR, Pires MM, Folchetti LD, Ferreira SRG. Análise de diferentes medidas antropométricas na identificação de síndrome metabólica, com ou sem alteração do metabolismo glicídico. Arq Bras Endocrinol Metab. 2010;54(7):636-43.
29. Oliveira MAM, Fagundes RLM, Moreira EAM, Trindade EBSM, Carvalho T. Relação de indicadores antropométricos com fatores de risco para doença cardiovascular. Arq Bras Cardiol. 2010;94(4):478-85.
30. Cabrera MAS, Jacob Filho W. Obesidade em idosos: prevalência, distribuição e associação com hábitos e co-morbidades. Arq Bras Endocrinol Metab.