Objective: To examine the association between quality of life and health self‑perception of children with poor school performance, considering sociodemographic factors.
Methods: An analytical, observational, cross‑sectional study was conducted with 99 children aged 7 to 12 years receiving specialized educational assistance. Parents and legal guardians answered questions concerning the sociodemographic proile. For an assessment of the quality of life and proposed domains (autonomy, functioning, leisure, and family), the children completed the Autoquestionnarie Qualité de Vie Enfant Imagé(AUQEI) and answered a question concerning their self‑perceived health. Data were analyzed using multiple linear regression, considering a 5% signiicance level.
Results: Among the evaluated children, 69 (69.7%) male participants with mean age of 8.7±1.5, 27% self‑assessed their health status as poor/very poor, and 36.4% of the children reported having impaired quality of life. As for the domains assessed by AUQEI, there was statistical signiicance in the associations between family with age, autonomy with economic classiication, and leisure and functioning with self‑perceived health.
Conclusions: The quality of life of children with academic underachievement is associated with their health self‑perception and sociodemographic characteristics.
Keywords: Quality of life; Underachievement; Self‑concept; Child; Speech‑language pathology.
Objetivo: Verificar a associação entre qualidade de vida e autopercepção de saúde em crianças com mau desempenho escolar, considerando fatores sociodemográicos.
Métodos: Estudo observacional analítico transversal com 99 crianças de 7 a 12 anos, participantes dos Atendimentos Educacionais Especializados. Os responsáveis responderam a questões sobre aspectos sociodemográicos. Para a avaliar a qualidade de vida e os domínios propostos (autonomia, funções, lazer e família) as crianças responderam ao Autoquestionnarie Qualité de Vie Enfant Imagé(AUQEI) e a uma questão referente à autopercepção de saúde. A análise de dados foi realizada por meio da regressão linear múltipla, considerando nível de signiicância de 5%.
Resultados: Das crianças avaliadas, 69 (69,7%) eram do sexo masculino, com média de idade de 8,7±1,5. Do total, 27% delas autoavaliaram a saúde como ruim/muito ruim e 36,4% referiram ter qualidade de vida prejudicada. Quanto aos domínios avaliados pelo AUQEI, houve signiicância estatística dos domínios família e idade, autonomia e classiicação econômica, lazer e funções em relação à autopercepção de saúde.
Conclusões: A qualidade de vida de crianças com mau desempenho escolar está associada à autopercepção de saúde e a características sociodemográicas.
Palavras‑chave: Qualidade de vida; Baixo rendimento escolar; Autoimagem; Criança; Fonoaudiologia.
ABSTRACT
RESUMO
*Corresponding author. E‑mail: [email protected] (B.A. Rezende). aUniversidade Federal de Minas Gerais, Belo Horizonte, MG, Brazil.
QUALITY OF LIFE AND HEALTH SELF‑PERCEPTION
IN CHILDREN WITH POOR SCHOOL PERFORMANCE
Qualidade de vida e autopercepção de saúde
de crianças com mau desempenho escolar
INTRODUCTION
Poor school performance can be deined as academic achieve‑ ment below the expected for a child’s chronological age, cog‑ nitive skills, and level of education.1 It can be one of the man‑
ifestations of a learning disorder or diiculty.2
Underachievement in school gives rise to limitations that could lead to low self‑esteem and problems with acceptance by peers. Being less competent increases the feeling of incapacity and, in turn, contributes to continuing underachievement.3 Poor aca‑
demic performance related to language impairment are possi‑ ble contributing factors to the risk of social exclusion.4 In this
context, children with poor academic performance are exposed to a number of factors that could impact their quality of life.
he term “quality of life” (QoL) is subjective and involves personal concepts of values, competencies, satisfaction, and well‑being. he construct includes a variety of conditions that could afect the individuals’ perception, feelings and behaviors related to their daily‑life functioning, including — but not lim‑ ited to — their health status. he major characteristics linked to that concept are subjectivity and multi‑dimensionality.5,6
Studies addressing the QoL of children have been more frequent in recent years, including those concerning disorders marked by functional impairment.7‑9 he interest in investi‑
gating the QoL of children diagnosed with a learning disorder has been noted in other countries, such as Austria, India, and Greece.10‑13 In Brazil, however, the knowledge on the QoL of
children with academic underachievement is still scarce. As from 1947, the deinition of health according to the World Health Organization has expanded from absence of dis‑ ease alone to a broad concept that can change in consonance with life’s perspectives and be related to the individuals’ sense of well‑being.14 Health self‑perception is considered a global
index of health and encompasses physical, cognitive, and emotional dimensions. In addition, such perception relies on knowledge of health and disease that changes with life experi‑ ence and social and cultural norms.15,16 Because such data are
easily obtainable (typically elicited with a single question) and highly relevant, the assessment of children’s self‑perception of health has received increasing attention in scientiic studies. In light of the above, the aim of the present study was to inves‑ tigate the association between QoL and health self‑perception considering sociodemographic factors of children aged 7 to 12 years with poor school performance.
METHOD
his analytical, observational, cross‑sectional study investi‑ gated a probability sample (simple random sampling method) in children aged 7 to 12 years with poor school performance.
All the children were participants of the specialized educational care in a country town in the state of Minas Gerais, Southeast Brazil.17 his specialized educational care was established by
the Ministry of Education in order to complement or supple‑ ment the student’s training according to the speciic needs of the children.17
he schoolchildren and their parents or guardians were invited to participate in the study; those who agreed provided a written informed consent. Participants were excluded if they did not complete the evaluation or had evidence or history of neurological, cognitive, and/or psychiatric alterations.
No estimates for expected percentages of impact on QoL, either general or domain‑speciic, were available to allow for sample size calculation. In view of that, the percentage was assumed to be 50% — number that maximizes the sample size. For the current study, 9% of sampling error and a 95% confidence interval were considered. A final sample of 90 children was estimated, considering the sampling universe of 617 students who were assisted by the specialized educational service in 2013.
his project was reviewed and approved by the UFMG Research Ethics Committee under No. CAAE 18683013.6.0000.5149.
he parents or legal guardians were interviewed and answered sociodemographic questions, including the socioeconomic proile according to the Brazilian Economic Classiication Criteria (BECC).18 his classiication considers the possession
of goods and the level of education of the head of the house‑ hold. he classes range from A1 to E, being A the class with the greatest purchasing power, and E, the lowest.
For assessing the children’s QoL, they completed the
Autoquestionnarie Qualité de Vie Enfant Imagé (AUQEI) devel‑ oped by Maniicat and Dozartin199719 and validated for
the Portuguese language by Assumpção Jr. et al. in 2000.20
his tool was chosen due to the fact that, in addition to being validated for Brazilian children, it presents the option of visual response, since the sample consisted of children with low aca‑ demic achievement with possible impairment in reading and in comprehension skills.
he AUQEI is intended to assess an individual’s subjec‑ tive well‑being on the premise that developing individuals are capable of expressing themselves with regard to their sub‑ jectivity. he questionnaire relies on the perspective of the child’s satisfaction as identiied in pictures (faces expressing diferent moods) associated with various domains of living, and comprises 26 questions that comprehend family rela‑ tions, social relations, school activities, and health status.20
In the Portuguese validation study,20 children read the sen‑
asked each child to indicate the face expressing the feeling evoked by each situation presented. Previously, the child was requested to talk about one of his/her life experiences related to each answer chosen.
he questions were categorized into four domains:
1. Functioning – questions relating to activities in school, during meals, when going to bed, and visiting the doc‑ tor’s oice (questions 1, 2, 4, 5, and 8) – Example: “(5) Tell me how you feel in the classroom”;
2. Family – questions addressing the child’s concept of his/ her parents and of self (questions 3, 10, 13, 16, and 18) – Example: “(10) Tell me how you feel when you think of your father”;
3. Leisure – questions related to vacations, birthday, and relationship with the grandparents (questions 11, 21, and 25) – Example: “(21) Tell me how you feel during the holidays”;
4. Autonomy – questions concerning the child’s indepen‑ dence, relationship with peers, and academic perfor‑ mance (questions 15, 19, 23, and 24) – Example “(15) Tell me how you feel when you play alone”.
Questions 6, 7, 9, 12, 14, 17, 20, 22, and 26 were not included among the four domains; they have individual rel‑ evance as they represent separate domains. This division of domains was based on the original study for the design of the questionnaire.19 Scoring was established as follows: very
unhappy = 0; unhappy = 1 point; happy = 2 points, and very happy = 3 points, with a maximum score of 78 points. he higher the score, the better the child’s judgment of his/ her QoL. he instrument suggests a cutof point of 48 points, meaning that those kids with total score lower than 48 have impaired QoL.20
After questionnaire completion, children’s overall health was assessed as follows: “In general, would you say that your health is: very good, good, fair, poor, or very poor?”.
For data analysis, the responses obtained with the instru‑ ments were organized, entered in a database and re‑checked. First, a descriptive analysis was performed and reported by frequency, for categorical variables, central tendency mea‑ sures and dispersion for continuous variables. Univariate and multiple linear regression analyses were conducted to determine the association between the total QoL score with the domains assessed by the instrument (autonomy, leisure, functioning, and family) and with health self‑perception, adjusted for age, sex, and economic class. Statistical signif‑ icance was set at 5%. he analyses were performed using the STATA software (Stata Corporation, College Station, Texas), version 13.0.
RESULTS
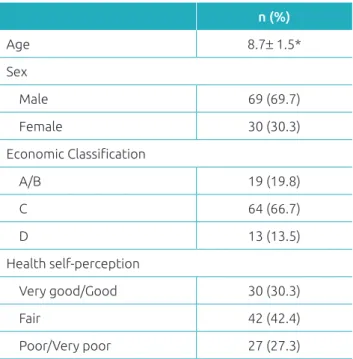
In total, 99 children participated in the study, with 69 (69.7%) male participants and mean age of 8.7±1.5. Most participants were ranked in economic class C (64.6%) and 27% self‑assessed their health status as poor/very poor (Table 1). he average total AUQEI score was 50.4 points, and 36.4% of the children reported having impaired quality of life.
An individual analysis of each instrument domain showed the highest mean scores for leisure, family, and function‑ ing (7.7±1.2; 11.1±2.1; 9.6±2.3, respectively). Considering that the higher the mean, the better the QoL evaluation, the leisure and family domains were the ones most positively judged, whereas autonomy had the most negative evalua‑ tion (Table 2).
Table 3 presents the univariate linear regression model, being possible to observe statistically signiicant association (p≤0.05) between health self‑perception and the following areas: leisure, functions and family. Also, there was signiicant association between age and the family domain; between the economic classiication with the autonomy domain and with the total score of the quality‑of‑life instrument.
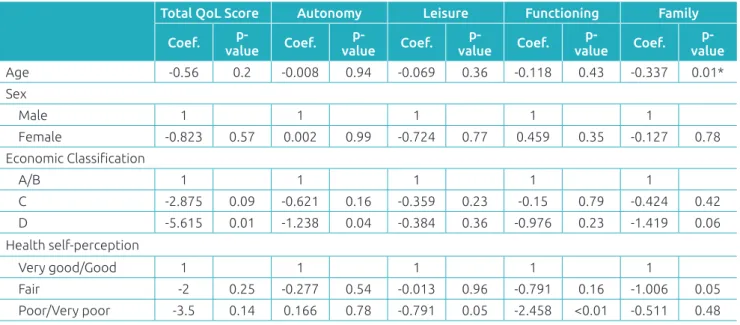
he multiple linear regression model outcomes are shown in Table 4. hey reveal statistically signiicant associations of leisure and functioning with self‑perception of health; family domain with age; and autonomy domain with eco‑ nomic classiication.
n (%)
Age 8.7± 1.5*
Sex
Male 69 (69.7)
Female 30 (30.3)
Economic Classiication
A/B 19 (19.8)
C 64 (66.7)
D 13 (13.5)
Health self‑perception
Very good/Good 30 (30.3)
Fair 42 (42.4)
Poor/Very poor 27 (27.3)
Table 1 Descriptive analysis of sociodemographic
characteristics of children with poor school performance.
Table 2 Distribution of scores overall and by domain according to the AUQEI.
Characteristics Minimum Maximum Range Median Mean Standard Deviation
Quality of life 34 69 0–78 50 50.4 6.7
Autonomy 2 11 0–12 5 5.1 1.7
Leisure 4 9 0–9 8 7.7 1.2
Functioning 4 15 0–15 10 9.6 2.3
Family 6 15 0–15 11 11.1 2.1
Table 3 Univariate linear regression model for the AUQEI domains versus sociodemographic characteristics of children with poor school performance.
Total QoL Score Autonomy Leisure Functioning Family
Coef. p‑
value Coef.
p‑
value Coef.
p‑
value Coef.
p‑
value Coef.
p‑ value
Age ‑0.56 0.2 ‑0.008 0.94 ‑0.069 0.36 ‑0.118 0.43 ‑0.337 0.01*
Sex
Male 1 1 1 1 1
Female ‑0.823 0.57 0.002 0.99 ‑0.724 0.77 0.459 0.35 ‑0.127 0.78
Economic Classiication
A/B 1 1 1 1 1
C ‑2.875 0.09 ‑0.621 0.16 ‑0.359 0.23 ‑0.15 0.79 ‑0.424 0.42
D ‑5.615 0.01 ‑1.238 0.04 ‑0.384 0.36 ‑0.976 0.23 ‑1.419 0.06
Health self‑perception
Very good/Good 1 1 1 1 1
Fair ‑2 0.25 ‑0.277 0.54 ‑0.013 0.96 ‑0.791 0.16 ‑1.006 0.05
Poor/Very poor ‑3.5 0.14 0.166 0.78 ‑0.791 0.05 ‑2.458 <0.01 ‑0.511 0.48
QoL: quality of life; Coef.: coeicient.
Table 4 Multiple linear regression model for the AUQEI domains versus sociodemographic characteristics of children with poor school performance.
Total QoL score Autonomy Leisure Functioning Family
Coef. p‑
value R2 Coef. p‑
value R2 Coef. p‑
value R2 Coef. p‑
value R2 Coef. p‑ value R2
Age ‑0.558 0.23 0.1 0.06 0.62 0.05 ‑0.107 0.19 0.07 ‑0.203 0.19 0.14 ‑0.33 0.02* 0.1
Sex
Male 1 1 1 1 1
Female ‑0.386 0.79 0.087 0.82 ‑0.024 0.92 ‑0.63 0.2 0.007 0.98
Economic Classiication
A/B 1 1 1 1 1
C ‑2.586 0.13 ‑0.687 0.13 ‑0.274 0.36 0.004 0.99 ‑0.273 0.6
D ‑4.418 0.07 ‑1.357 0.04 ‑0.155 0.72 ‑0.564 0.48 ‑0.909 0.23
Health self‑perception
Very good/Good 1 1 1 1 1
Fair ‑2.347 0.2 ‑0.321 0.5 ‑0.074 0.81 ‑0.652 0.28 ‑1.039 0.06
DISCUSSION
his study showed that poor school performance have a neg‑ ative impact on quality of life and health perception for chil‑ dren. Studies with children who have had a recent diagnosis of learning disabilities found similar results, but using other tools to assess the quality of life.11,12 here are no studies about
quality of life of children with poor school performance using the AUQEI. However, studies were found evaluating children with leukemia21 and cystic ibrosis with AUQUEI,22 and the
prevalence of impaired quality of life was 15% and 25%. It is plausible to assume that children who have passed or have experienced serious diseases value situations and areas investi‑ gated by the AUQEI, which justify a better evaluation of the construct “quality of life”.
he analysis of the AUQEI instrument by domains showed that children had greater satisfaction with tasks related to leisure and family relationships, whereas situations demanding auton‑ omy were the least satisfying ones. As cited before, no studies were found in the literature using the AUQEI to investigate the QoL of children with poor academic performance. However, the AUQEI was used to evaluate children with neoplasms23 and sto‑
mas,24 and showed that the autonomy domain was judged more
negatively by children, whereas family had the most favorable assessment, which corroborates the indings of the present study. he multiple linear regression analysis showed statistical signiicance in the association between the family domain and age. As age increases, the means for a child’s perception of fam‑ ily relations decrease, indicating a QoL deterioration in that domain. he literature indicates that family is a very relevant social institution, with the potential to inluence the subjective well‑being of children.25 However, a study from India evaluated
150 children with mean age of 12.2 years who had poor aca‑ demic achievement and found no such association.11 he ind‑
ings of the current research support the hypothesis that older children can better characterize their social and family context, which corroborates a Brazilian study in which older institu‑ tionalized children with low academic achievement had infe‑ rior means on the Multi‑Dimensional Life Satisfaction Scale.26
he sex variable showed no statistically signiicant associa‑ tion with the domains investigated. he literature corroborates this inding,11 although one study found that girls had worse
scores for “social exclusion” and “overall health”.12
he autonomy domain was signiicantly associated with economic classiication, as children in economic class D scored lower in the autonomy domain compared to those in classes A to C. he correlation coeicient demonstrated a tendency toward lower means in the autonomy domain with lower rank‑ ing in the BECC. Socioeconomic status is known to afect an individual’s perception of the social setting. A review study
showed that parents in lower socioeconomic classes prioritize conformity values; as a result, they tend to apply more coer‑ cive parenting practices, including the use of force and power assertion, whereas those in a higher socioeconomic class value autonomy and self‑control, and typically use inductive disci‑ pline methods that favor the children’s relection on the situ‑ ations. However, this should be regarded with caution, since not only families with low socioeconomic status adopt coer‑ cive practices.27 Besides, these factors were not measured in this
study and cannot be compared.
A study using the PedsQL questionnaire found that chil‑ dren from families with low socioeconomic status had poor QoL, including the psychosocial health scale and the dimen‑ sions of emotional, social, and academic functioning.10 Another
study showed that autonomy, as assessed by the DISABKIDS instrument, was also associated with lower economic status.12
It should be noted that both studies were conducted with children who had poor academic achievement, which sug‑ gests that the independence of those children could relect on their perception of QoL. he children from households with lower purchasing power are likely faced with fewer situations demanding greater autonomy, and may, therefore, have little power of decision. In addition, they tend to spend more time alone. hus, it would be logical to have better results; however, the efect may be contrary, because the kids in this situation may feel pressed, which justiies the worst results.
he leisure and functioning domains — which relate to activ‑ ities that promote the children’s well‑being and to the degree of satisfaction about their functional capacity, respectively — were signiicantly associated with self‑perceived health. When self‑per‑ ception was compared across the range from “very good” to “very poor” in the multiple linear regression model, mean reduc‑ tions of 0.9 to 2.7 were found for the leisure and functioning domains, respectively; this shows a greater downward trend in satisfaction with the activities of daily living (functioning). he prevalence of a negative health self‑perception was similar to that observed in a study conducted in a Southern Brazilian city: 25.7% of 1,134 students aged 14 to 19 years had negative health self‑perception.28 he authors of a study that included
Brazilian, Canadian, Chinese, and Italian children investigated the self‑perception of competencies of 1,534 schoolchildren with mean age of 12 years using the Self‑Perception Proile for Children. he authors identiied signiicant diferences across the countries in the social and academic domains, and they demon‑ strated that negative perceptions of competencies may be asso‑ ciated with academic underachievement.16
self‑perception and their QoL. It is known that children with poor academic achievement may have a high risk of devel‑ oping a negative self‑concept.29 A Brazilian study evaluated
1,070 schoolchildren with the aim of investigating the self‑per‑ ception of students in development areas connected to school performance; the results were statistically signiicant for the cor‑ relations between grade failure and parental level of education.30
he coeicient of determination was higher in the multiple linear regression model for the functioning domain: approx‑ imately 14% of the functional impairment can be explained by poorer health self‑perception. he present study demon‑ strated that the children’s self‑perceived health is related to their QoL, and that these concepts are likely formulated from the socioeconomic and cultural contexts in which those chil‑ dren are inserted. hus, health and education professionals should evaluate children globally, in addition to their aca‑ demic diiculties.
Importantly, caution is required when analyzing the results of this study, since the questionnaires assessing the QoL of
children with poor school performance available in the litera‑ ture are diferent from that administered in the present study, which complicates comparisons. Also, the perception of the parents on the QoL of their children should be addressed in further investigations. Due to the cross‑sectional design of the present study, it is not possible to establish a causal relationship between the AUQEI domains and the aspects investigated.
In conclusion, the scores of QoL domains for children with poor performance at school are associated with worse health self‑perception and sociodemographic characteristics. Children’s health, as perceived from their own perspective, can be an important index of their socio‑cultural setting and value systems in relation to their goals, expectations, and interests.
Funding
his study did not receive funding.
Conflict of interests
he authors declare no conlict of interests.
REFERENCES
1. Siqueira CM, Gurgel‑Giannetti J. [Poor school performance: an updated review]. Rev Assoc Med Bras. 2001;57:78‑87.
2. Sisto FF. Avaliação de diiculdade de aprendizagem: Uma questão em aberto. In: Sisto FF, Dobránszky EA, Monteiro A, editors. Cotidiano escolar:Questões de leitura, matemática e aprendizagem. Petrópolis: Vozes; 2002. p.121‑41.
3. Ferreira AA, Conte KM, Marturano EM. [Boys with complaints about school: self‑perception, achievement, and behavior]. Estud Psicol. 2011;28:443‑51.
4. Cross M [homepage on the Internet]. Language and Social Exclusion. I CAN Talk series – Issue 4. London: I CAN; 2007. [cited 2014 Mar 14]. Available from: http://www.ican.org. uk
5. Dantas RA, Sawada NO, Malerbo MB. [Research on quality of life: review on the scientific production of public universities in São Paulo State]. Rev Latino‑Am Enferm. 2013;11:532‑8.
6. Seidl EM, Zannon CM. [Quality of life and health: conceptual and methodological issues]. Cad Saúde Pública. 2004;20:580‑8.
7. Akin Sari B, Demiroğullari B, Ozen O, Iseri E, Kale N, Başaklar C. Quality of life and anxiety in Turkish patients with anorectal malformation. J Paediatr Child Health. 2014;50:107‑11.
8. Sundaram SS, Alonso EM, Haber B, Magee JC, Fredericks E, Kamath B, et al. Health related quality of life in patients with biliary atresia surviving with their native liver. J Pediatr. 2013;163:1052‑7.
9. Skjerning H, Mahony RO, Husby S, DunnGalvin A. Health‑related quality of life in children and adolescents with celiac disease: patient‑driven data from focus group interviews. Qual Life Res. 2014;23:1883‑94.
10. Felder‑Puig R, Baumgartner M, Topf R, Gadner H, Formann AK. Health‑related quality of life in Austrian elementary school children. Med Care. 2008;46:432‑9.
11. Karande S, Bhosrekar K, Kulkarni M, Thakker A. Heath‑related quality of life of children with newly diagnosed speciic learning disability. J Trop Pediatr. 2009;55:160‑9.
12. Karande S, Venkataraman R. Self‑perceived health‑related quality of life of Indian children with specific learning disability. J Postgrad Med. 2012;58:246‑54.
13. Rotsika V, Coccossis M, Vlassopoulos M, Papaeleftheriou E, Sakellariou K, Anagnostopoulos DC, et al. Does the subjective quality of life of children with speciic learning disabilities (SpLD) agree with their parents’ proxy reports? Qual Life Res. 2011;20:1271‑8.
14. Segre M, Ferraz FC. [The health’s concept]. Rev Saúde Pública. 1997;31:538‑42.
15. Mendonça G, Farias Júnior JC. [Self‑perceived health and associated factors in adolescents]. Rev Bras Ativ Fis Saúde. 2012;17:174‑80.
16. Chen X, Zappulla C, Lo Coco A, Schneider B, Kaspar V, Oliveira AM, et al. Self‑perceptions of competence in Brazilian, Canadian, Chinese and Italian children: Relations with social and school adjustment. Int J Behav Dev. 2004;28:129‑38.
© 2017 Sociedade de Pediatria de São Paulo. Published by Zeppelini Publishers. This is an open access article under the CC BY license (http://creativecommons.org/licenses/by/4.0/).
18. Associação Brasileira de Empresas de pesquisa [homepage on the Internet]. Critério de Classiicação Econômica Brasil [cited 2013 May 26]. Available from: http://www.abep.org/ novo/Content.aspx?SectionID=84
19. Maniicat S, Dazord A. Évaluation de la qualité de vie de l’enfant: validation d’un questionnaire, premiers résultats. Neuropsychiatr Enfance Adolesc. 1997;45:106‑14.
20. Assumpção FB, Kuczynski E, Sprovieri MH, Aranha EM. [Quality of life evaluation scale (AUQEI): validity and reliability of a quality of life scale for children from 4 to 12 years‑old]. Arq Neuropsiquiatr. 2000;58:119‑27.
21. Sommerfeld CE, Calmon CM, Sperandio F, Machado A , Beltrame T. Qualidade de vida de crianças em tratamento clínico de leucemia. Brasília Med. 2011; 48:129‑37.
22. Pfeifer LI, Silva MA. Avaliação da qualidade de vida em crianças com ibrose cística. Rev Nufen: Phenom Interd. 2009;2:118‑30.
23. Araújo PC. Percepção de estigma e qualidade de vida em crianças com neoplasia [master’s thesis]. Natal (RN): UFRN; 2012.
24. Barreire SG, Oliveira AO, Kazamal W, Kimura M, Santos VL. [Quality of life of children with stomas: the children and mothers’ point of view]. J Pediatr (Rio J). 2003;79:55‑62.
25. Elias AV, Assumpção FB. [Quality of life and autism]. Arq Neuropsiquiatr. 2006;64:295‑99.
26. Siqueira AC, Dell’Aglio DD. Crianças e adolescentes institucionalizados: desempenho escolar, satisfação de vida e rede de apoio social. Psic: Teor e Pesq. 2010;26:407‑15.
27. Bem LA, Wagner A. [Relexions on parenthood and educative strategies in families with low socioeconomic status]. Psicol Estud. 2006;11:63‑71.
28. Cureau FV, Duarte PM, Santos DL, Reichert FF. [Self‑rated health in adolescents: prevalence and association with cardiovascular risk factors]. Rev Bras Ativ Fis Saude. 2013;18:750‑60.
29. Elbaum, B, Vaughn S. School‑based interventions to enhance the self‑concept of students with learning disabilities: a meta‑analysis. The Elementary School Journal. 2001;10:303‑29.