_____________________________________
1 Engo Civil, Prof. Adjunto, Departamento de Computação, UFOP, Ouro Preto - MG.
2 Engo Agrícola, Professor Associado, Departamento de Engenharia Agrícola, UFV, Viçosa - MG. 3 Engo Agrônomo, Professor Associado, Departamento de Engenharia Agrícola, UFV, Viçosa - MG. 4 Engo Eletricista, Professor Titular, Departamento de Informática, UFV, Viçosa - MG.
5 Engo Agrônomo, Professor Adjunto, Departamento de Estatística, UFV, Viçosa - MG.
NON-REDUCING SUGARS ON COFFEE QUALITY WITH USE OF ARTIFICIAL
NEURAL NETWORK
JOSÉ A. T. MESSIAS
1, EVANDRO DE C. MELO
2, ADÍLIO F. DE LACERDA FILHO
3,
JOSÉ L. BRAGA
4, PAULO R. CECON
5ABSTRACT:
The present study aimed at evaluating the use of Artificial Neural Network to
correlate the values resulting from chemical analyses of samples of coffee with the values of their
sensory analyses. The coffee samples used were from the
Coffea arabica
L., cultivars Acaiá do
Cerrado, Topázio, Acaiá 474-19 and Bourbon, collected in the southern region of the state of Minas
Gerais. The chemical analyses were carried out for reducing and non-reducing sugars. The quality
of the beverage was evaluated by sensory analysis. The Artificial Neural Network method used
values from chemical analyses as input variables and values from sensory analysis as output values.
The multiple linear regression of sensory analysis values, according to the values from chemical
analyses, presented a determination coefficient of 0.3106, while the Artificial Neural Network
achieved a level of 80.00% of success in the classification of values from the sensory analysis.
KEYWORDS: coffee quality, chemical analysis, classification, computer systems.
DETERMINAÇÃO DA INFLUÊNCIA DA VARIAÇÃO DE AÇÚCAR REDUTOR E NÃO
REDUTOR NA QUALIDADE DA BEBIDA DO CAFÉ COM UTILIZAÇÃO DE REDE
NEURAL ARTIFICIAL
RESUMO:
Este trabalho teve como objetivo avaliar a utilização de Rede Neural Artificial para
correlacionar os valores resultantes de análises químicas de amostras de café com os valores de sua
análise sensorial. As amostras de café utilizadas foram referentes ao café
Coffea arabica
L., cultivar
Acaiá do Cerrado, Topázio, Acaiá 474-19 e Bourbon, coletados na região sul de Minas Gerais. As
análises químicas foram de açúcar não redutor e açúcar redutor, sendo a qualidade da bebida
avaliada pela análise sensorial. O método de Rede Neural Artificial utilizou os valores das análises
químicas como variáveis de entrada e os valores da análise sensorial como valores de saída. A
regressão linear múltipla dos valores de análise sensorial, em função dos valores das análises
químicas, teve coeficiente de determinação de 0,3106, enquanto o método de Rede Neural Artificial
empregado obteve um nível de acerto na classificação dos valores da análise sensorial de 80,00%.
PALAVRAS-CHAVE: qualidade de café, análises químicas, classificação, sistemas de
computação.
INTRODUCTION
The question analyzed in this study was to establish the correlation between characteristic
variations, as determined by chemical analyses, presented by the coffee beans due to crop
management practices, harvesting, post-harvest processing and storage, as a result of beverage
quality.
The objective was to propose a method using Artificial Neural Network (ANN), which, from
experimental data, may establish a model able to correlate the input and output variables and
generate classes according to output variable values. In this particular case, the input values are the
results of chemical analysis of coffee samples and the output value, the quality of the beverage,
according to sensory analysis of beverage samples.
Due to its modeling characteristics, the use of ANN enables the establishment and recognition
of classes according to their characteristics. The use of ANN involves the solution of the problem
under study, namely to establish a method that determines the correspondence between the
variations of sensory analysis values and the variations of chemical analyzes values.
The ANN is used today in various areas of knowledge, and this broad spectrum is increasing
ANN research and development. In the studies by CHERKASSKY & MA (2009) and
KHOSHGOFTAAR & GAO (2007), target function in regression problems and classification were
studied, while studies by HERVÁS-MARTÍNEZ et al. (2008), CIURANA et al. (2008), SOUSA et
al. (2007), and VERLINDEN et al. (2008) compared the performance between ANN and MLR.
RECAMALES et al. (2007) established a correlation process between wine color stored with
different wooden barrels, DUTTA et al. (2003) established the process for determining tea quality,
and PARDO et al. (2006), KERMANI et al. (2005) and CHARUMPORN et al. (2003) developed
study to identify volatile chemicals with the use of "electronic nose".
SUCHACZ & WESOLOWSKI (2006) analyzed the concentrations of zinc, copper, lead and
cadmium in medicine, using them as input variables for neural network models to recognize the
taxonomy of plants used in their composition. Research developed by ANDERSON & SMITH
(2002) demonstrated the feasibility of a method to distinguish coffee from different geographic
regions. Elemental analyzes of K, Mg, Ca, Na, Al, V, Cr, Mn, Fe, Co, Ni, Cu, Zn, Mo, S, Cd, Pb
and P from coffee bean samples served as input in the system using methods of statistical pattern
recognition, including principal component analysis, discriminant function, as well as analysis and
modeling of neural networks, to determine the geographical origin of food.
When verifying the influence of the drying process, in different types of patios, on the coffee
quality during storage, REINATO et al. (2007) used the analysis of total sugars, among other
compounds, and reported the decrease of total sugars in coffee dried in a thick layer, that provided
the best conditions for microorganisms, which utilize sugar as a major substrate for development.
In order to determine the coffee quality at different temperatures, airflow and period of
pre-drying, BORÉM et al. (2006) used sensory analysis and chemical analyzes of total and reducing
sugars. The highest values of total and reducing sugars were indicators of better quality of coffee
beverage. These sugars specified flavor and aroma of roasted coffee.
MATERIAL AND METHODS
The data used in this study were provided by the team of the Professor Flavio Meira Borém,
from the Department of Engineering, at the Federal University of Lavras, State of Minas Gerais,
Brazil, whose data are characterized in the references: ISQUIERDO (2008), 30 sets; RIBEIRO
(2009), 84 sets; NOBRE (2009), 70 sets, FIGUEIREDO (2009), 115 sets, and FERNANDES
(2008), 96 sets. In total, 395 sets of data were used for implementation of the ANN. These data are
from
Coffea arabica
L.; cultivars Acaiá do Cerrado, Topázio, Acaiá 474-19, and Bourbon group.
appropriate for the purposes of each experiment, but the chemical analyses of non-reducing sugars
were common to all. The sensory analysis, either BSCA or SCAA methods, were also common to
all experiments.
The linear regression analysis was performed with the SAEG program (2007). The linear
regression of the sensory analysis results was carried out as a function of the results from the
chemical analyses.
The ANN was successfully implemented, trained and tested using MATLAB
®, version 6,
Math Works Inc., with the neural networks tool kit, to create a network object in MATLAB
®.
Theoretically, the value of sensory evaluation is between 0 and 100. For implementation of
the method, values of the sensory analysis were grouped as follows: class 1 for values greater than
79; class 2 to values less than or equal to 79 and greater than 74; class 3 to less than or equal to 74
and greater than 69; and class 4 to less than or equal to 69. In the 395 data sets, chemical
composition and sensory analysis used to implement the ANN were divided randomly into three
groups: the first one, used for training the network (around 80% of data), a second group for
validation during a network training (around 10% of the data), and a third group to test the network
generated (around 10% of the data).
The network performance was verified by comparing the expected result for the third data
group, with the ANN results. Each data set used results of chemical composition data as input for
the ANN, and the results of sensory analysis as output values. The use of the sensory analysis
results was done during the training phase to determine the error to be used in the measurement of
training, and in the testing phase, to determine the ANN performance.
After all initial tests had been performed, a set of parameters were defined for routine in the
ANN implementation during the performance tests, with the use of:
• Multilayer Progressive N
eural Network (feed forward) with back propagation learning
algorithm for the error.
• Six input values, one for each associated variable
of the chemical analysis value.
• Two interm
ediate layers, the first with 5; 7 or 9 neurons and the second with 5; 7; 9 or 13
neurons.
• Output layer with a neuron associated with the value of sensory analysis.
•
Logsig
function as activation function of hidden layers and
purelin
as last layer.
• Learning algorithm
trainlm;
• 300 cycles (epocs) for each execution.
• Acc
uracy of the mean squared error for stop criterion to 0.0001.
•
20 executions for each network configuration by selecting the configuration with best
performance.
RESULTS AND DISCUSSION
Data analysis was executed in order to verify the influence of data variation of chemical
analysis values and sensory analysis values of coffee. Data analysis was performed using statistical
analysis and ANN. Initially, interference of variation was observed for each chemical analysis in the
sensory analysis, and then the aggregate interference of two chemical analyses in the sensory
analysis.
Analysis of reducing sugar
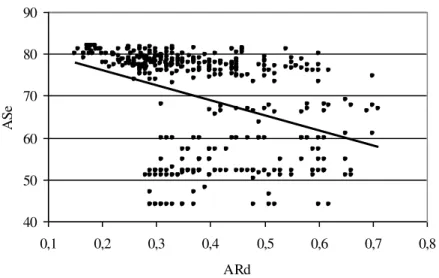
Results of reducing sugar analyses showed the lowest value: 0.15, highest value: 0.71,
average value: 0.3819, and standard deviation: 0.1254.
Linear regression of the results for reducing sugar (ARd) and sensory analysis (ASe) of the
395 sets of experimental data resulted in eq.(1), which coefficient of determination r
2was 0.1400.
Figure 1 represents the results of linear regression.
A
Se
ˆ
=
83.3774
-
36.1581
´
ARd
(1)
40 50 60 70 80 90
0,1 0,2 0,3 0,4 0,5 0,6 0,7 0,8
ARd
A
Se
FIGURE 1. Linear Regression Ase = f(ARd).
The ANN implemented with the results from the reducing sugar analysis and sensory analysis
presented the best accuracy classification for the value of 42.50% in the configuration of (7; 13; 1)
neurons per layer.
The ANN performed better than linear regression, since the coefficient of determination
indicates that only 14% of the results of sensory analysis are explained by the regression. The
network performance, despite indicating a small success rate, with less than half of the cases, was
still better than the linear regression.
Analysis of Non-Reducing Sugar
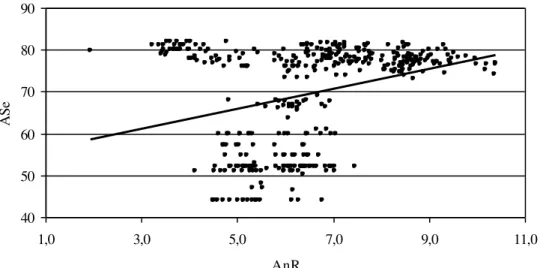
Data analyses of non-reducing sugar showed the following values: lowest value of 1.95;
highest value of 10.38; average values of 6.5498, and standard deviation of 1.6184.
Linear regression analysis results for non-reducing sugar (AnR) and sensory analysis (ASe) of
the 395 sets of experimental data resulted in equation 2, which coefficient of determination r
2was
0.1016. In Figure 2, the results of linear regression are shown.
40 50 60 70 80 90
1,0 3,0 5,0 7,0 9,0 11,0
AnR
A
Se
FIGURE 2. Linear Regression ASe = f(AnR).
The ANN implemented with the results of analysis of non-reducing sugar and sensory
analysis presented the best accuracy classification for the value of 62.50% in the configuration of
(7; 7; 1) and (9; 7; 1) neurons per layer.
In this case also, the ANN performed better than the linear regression, since the coefficient of
determination indicated that only 10.16% of sensory evaluation results were explained by the
regression.
Analysis of Reducing and Non-Reducing Sugars
The variation of sensory analysis values as a function of variations in the values of reducing
and non-reducing sugar analyses assessed by use of multiple linear regression analysis in the 395
sets of experimental data, resulted in the equation 3, which coefficient of determination R
2was
0.3106.
AnR ARd
e S
Aˆ 66.092345.3181 3.17312