HIV Protease Inhibitors in Children: A Clinical Application
of MALDI Mass Spectrometry
Jeroen J. A. van Kampen1,2,3, Mariska L. Reedijk3, Peter C. Burgers1, Lennard J. M. Dekker1, Nico G. Hartwig2, Ineke E. van der Ende4, Ronald de Groot5, Albert D. M. E. Osterhaus3, David M. Burger6, Theo M. Luider1*., Rob A. Gruters3.
1Department of Neurology, Erasmus MC, Rotterdam, The Netherlands,2Department of Paediatrics, Erasmus MC – Sophia, Rotterdam, The Netherlands,3Department of Virology, Erasmus MC, Rotterdam, The Netherlands,4Department of Internal Medicine, Erasmus MC, Rotterdam, The Netherlands,5Department of Paediatrics, University Medical Centre Nijmegen, Nijmegen, The Netherlands,6Department of Clinical Pharmacy, University Medical Centre Nijmegen, Nijmegen, The Netherlands
Abstract
HIV protease inhibitors must penetrate into cells to exert their action. Differences in the intracellular pharmacokinetics of these drugs may explain why some patients fail on therapy or suffer from drug toxicity. Yet, there is no information available on the intracellular levels of HIV protease inhibitors in HIV infected children, which is in part due to the large amount of sample that is normally required to measure the intracellular concentrations of these drugs. Therefore, we developed an ultra-fast and sensitive assay to measure the intracellular concentrations of HIV protease inhibitors in small amounts of peripheral blood mononuclear cells (PBMCs), and determined the intracellular concentrations of lopinavir and ritonavir in HIV infected children. An assay based on matrix-assisted laser desorption/ionization (MALDI) - triple quadrupole mass spectrometry was developed to determine the concentrations of HIV protease inhibitors in 10mL plasma and 16106PBMCs.
Precisions and accuracies were within the values set by the FDA for bioanalytical method validation. Lopinavir and ritonavir did not accumulate in PBMCs of HIV infected children. In addition, the intracellular concentrations of lopinavir and ritonavir correlated poorly to the plasma concentrations of these drugs. MALDI-triple quadrupole mass spectrometry is a new tool for ultra-fast and sensitive determination of drug concentrations which can be used, for example, to assess the intracellular pharmacokinetics of HIV protease inhibitors in HIV infected children.
Citation:van Kampen JJA, Reedijk ML, Burgers PC, Dekker LJM, Hartwig NG, et al. (2010) Ultra-Fast Analysis of Plasma and Intracellular Levels of HIV Protease Inhibitors in Children: A Clinical Application of MALDI Mass Spectrometry. PLoS ONE 5(7): e11409. doi:10.1371/journal.pone.0011409
Editor:Cheryl A. Stoddart, University of California, San Francisco, United States of America
ReceivedNovember 23, 2009;AcceptedMay 11, 2010;PublishedJuly 1, 2010
Copyright:ß2010 van Kampen et al. This is an open-access article distributed under the terms of the Creative Commons Attribution License, which permits unrestricted use, distribution, and reproduction in any medium, provided the original author and source are credited.
Funding:This work was supported by a grant from Top Institute Pharma (project T4-212). The consortium of project T4-212 consists of the departments of Neurology and Virology of the Erasmus MC (Rotterdam, the Netherlands), the departments of Pediatrics and Clinical Pharmacy of the UMC St. Radboud (Nijmegen, the Netherlands), TNO Quality-of-Life (Zeist, the Netherlands), and GlaxoSmithKline (Zeist, the Netherlands). Jeroen van Kampen is supported by a grant from Aids Fonds, the Netherlands (project 2004051), and Rob Gruters is supported by VIRGO. The funders had no role in study design, data collection and analysis, decision to publish, or preparation of the manuscript.
Competing Interests: In this project (T4-212), GlaxoSmithKline is the commercial partner of the public-private-partnership Top Institute Pharma. GlaxoSmithKline was not involved in study design, collection, analysis and interpretation of the data, writing of the manuscript or the decision to publish the manuscript. GlaxoSmithKline was not involved in employment, consultancy, patents, and we did not use products in development or marketing products from GlaxoSmithKline in this project. We adhere to all the PLoS ONE policies on sharing data and materials.
* E-mail: t.luider@erasmusmc.nl
.These authors contributed equally to this work.
Introduction
HIV protease inhibitors exert their action inside cells that are susceptible to HIV infection. The intracellular pharmacokinetics of these drugs, its relation to the plasma pharmacokinetics, and its relation to drug efficacy and toxicity is therefore an active area of research [1–10]. However, determination of the intracellular levels of antiretroviral drugs is an analytical challenge, because of the small amount of target cells, e.g. peripheral blood mononuclear cells (PBMCs), which can be obtained from a patient’s blood sample. Approximately one million PBMCs can be obtained from 1–2 mL blood. This amount of PBMCs has a total intracellular volume of ,0.4mL, while 500 – 1000mL plasma can be obtained from that
same blood sample. As a consequence, much is known about the plasma pharmacokinetics of HIV protease inhibitors in HIV
infected children, but no information is available on the intracellular levels of HIV protease inhibitors in this group of patients [11–14]. Here, we describe a new assay for fast and sensitive determination of HIV protease inhibitor levels in one million PBMCs and 10mL plasma, and its application in HIV infected children treated with Kaletra, a co-formulation of the HIV protease inhibitors lopinavir and ritonavir. To this end we used the novel matrix-assisted laser desorption/ionization (MALDI) – triple quadrupole mass spectrometry technique [15–23].
Materials and Methods
Ethics Statement
Written informed consent was obtained from the patients’ parents or legal guardians.
Chemicals and solvents
Methotrexate (Emthexate PF for parenteral administration, PharmaChemie BV, Haarlem, the Netherlands), saquinavir (donated by F.Hoffmann La-Roche, Basel, Switzerland), indinavir (donated by Merck, Rahway, NJ, USA), nelfinavir (donated by Pfizer, Groton, CT, USA), lopinavir and ritonavir (donated by Abbott Laboratories, Illinois, IL, USA), Kaletra oral solution (80 mg/mL lopinavir and 20 mg/mL ritonavir; Abbott; obtained from dept. Pharmacy, Erasmus MC, Rotterdam, the Netherlands), nevirapine and tipranavir (donated by Boehringer Ingelheim, Ingelheim am Rhein, Germany), efavirenz (Moravek, Brea, CA, USA), metronidazole, metoprolol, piroxicam, amoxicillin, and carbamazepine (all from Sigma-Aldrich, Zwijndrecht, the Nether-lands). a-cyano-4-hydroxycinnamic acid solution (Agilent
Tech-nologies; 6.2 mg/mL in methanol/acetonitrile/water 36/56/8 v/ v/v, pH = 2.5). Sodium iodide (purity .99.99%, Sigma-Aldrich, Zwijndrecht, the Netherlands). Methanol (ULC/MS grade, Biosolve, Valkenswaard, the Netherlands). Phosphate-Buffered Saline (PBS; 1x; pH = 7.4; CaCl2 and MgCl2; product number 10010) was obtained from Invitrogen. Red blood cell lysis buffer was obtained from Roche Diagnostics (Mannheim, Germany, Cat. No. 11814389001).
Stock solutions
All stock solutions for MALDI-triple quadrupole MS analysis were prepared in methanol by serial dilution. As internal standards we used: 20mM nelfinavir (quantitation of lopinavir and ritonavir in plasma), 5mM methotrexate (quantitation of saquinavir, nelfinavir, and indinavir in plasma), 2mM nelfinavir (quantitation
of lopinavir and ritonavir in 16106 PBMCs). To investigate the
effect of co-medication on the quantitation performance, the following drug mixtures were added to the quality control samples: drug mixture A: 10mM carbamazepine, metoprolol, metronida-zole, amoxicillin, piroxicam, nevirapine, saquinavir, efavirenz, indinavir, and tipranavir (quantitation of lopinavir and ritonavir in plasma). Drug mixture B: 10mM carbamazepine, metoprolol, metronidazole, amoxicillin, piroxicam, nevirapine, lopinavir, efavirenz, ritonavir, and tipranavir (quantitation of saquinavir, indinavir, and nelfinavir in plasma).
Matrix preparation
For simultaneous quantitation of lopinavir and ritonavir, 10mL 100 mM NaI in MeOH was added to 990mL matrix solution (a
-cyano-4-hydroxycinnamic acid). For simultaneous quantitation of saquinavir, indinavir, and nelfinavir, the matrix solution was diluted 1:1 v/v in nanopure water.
MALDI-triple quadrupole mass spectrometry
A FlashQuant Workstation equipped with a 4000 QTRAP mass analyzer (MDS Analytical Technologies, Concord, Ontario, Canada) was used for automated measurements of the samples. The spots were measured in the selected reaction monitoring mode (unit resolution) by moving the target plate in a straight horizontal line at a speed of 1 mm per second while firing of the laser at 1,000 Hz, which corresponds to an analysis time of 4.5 seconds per spot. For specific setting see Table 1. Analyst 1.4.2. and FlashQuant 1.0 software (MDS Analytical Technologies, Concord, Ontario, Canada) were used to operate the instrument and for automated data analysis. A calibration curve was constructed by plotting the analyte-to-internal standard area ratios against the concentrations spiked using a 1/concentration2 weighed linear curve. Quality controls were used to check the validity of the calibration curves. The absolute lower limit of quantification was set at the mean analyte area in the zero samples
+10 times the standard deviation. Samples were spotted onto Opti-TOF 384 well stainless steel target plates (123681 mm; MDS Analytical Technologies, Concord, Ontario, Canada).
Plasma sample preparation for MALDI-triple quadrupole MS
Plasma samples were prepared in 1.5 mL Eppendorf safe-lock tubes: 10mL plasma were added to methanol, mixed using a
pipette, and spiked with internal standard, analytes, and additional drugs, depending on the type of sample. Calibrators: 70mL
MeOH+10mL plasma+10mL internal standard+10mL analytes.
Quality controls: 60mL MeOH+10mL plasma +10mL internal standard +10mL analytes +10mL drug mixture. Unknowns: 80mL MeOH+10mL plasma+10mL internal standard. Blank: 90mL MeOH +10mL plasma. Zero: 70mL MeOH +10mL plasma +10mL internal standard +10mL drug mixture. For quantitation of lopinavir and ritonavir, nelfinavir (20mM solution) was used as internal standard. For quantitation of saquinavir, indinavir, and nelfinavir, methotrexate (5mM solution) was used
as internal standard. To the quality control samples for lopinavir and ritonavir quantitation, drug mixture ‘‘A’’ was spiked containing carbamazepine, metoprolol, metronidazole, amoxicil-lin, piroxicam, nevirapine, saquinavir, efavirenz, indinavir, and tipranavir (10mM each). To the quality control samples for saquinavir, indinavir, and nelfinavir, drug mixture ‘‘B’’ was spiked
Table 1.Instrument settings for quantitative analysis of HIV protease inhibitors.
compound form ion transition CE (V) CXP (V) plate (V) laser power (%)
lopinavir sodiated 651.4R439.3 52 10 60 40
ritonavir sodiated 743.3R573.3 50 10 60 40
nelfinavir sodiated 590.4R338.2 50 10 60 40
saquinavir protonated 671.4R570.4 44 8 65 35
indinavir protonated 614.4R421.2 44 12 50 35
nelfinavir protonated 568.4R330.2 45 8 50 35
methotrexate protonated 455.2R308.2 30 8 50 35
The skimmer was set at 0 V, CAD gas at 6, source gas at 10. CE = collision energy. CXP = collision cell exit potential. Plate = target plate containing the samples. Dwell time for each ion transition was 10 ms.
containing carbamazepine, metoprolol, metronidazole, amoxicil-lin, piroxicam, nevirapine, lopinavir, efavirenz, ritonavir, and tipranavir (10mM each). Samples were extracted for at least one hour at 5uC and were then centrifuged at 14,000 rpm at room temperature for 5 minutes. Subsequently, supernatants were mixed with matrix solution (1:2, v/v; for matrix see Section ‘‘matrix preparation’’), 0.75mL matrix/sample mixture was deposited on three positions on the target plate and was dried at room temperature. MALDI-triple quadrupole MS measurements were carried out at the dept. Neurology (Erasmus MC, Rotterdam, the Netherlands).
HPLC-UV
Lopinavir and ritonavir concentrations in plasma were determined using a validated HPLC-UV assay as described previously [24]. HPLC-UV measurements were performed at the dept. Clinical Pharmacy (UMC St. Radboud, Nijmegen, the Netherlands). For the cross-validation, the samples were prepared independently at the two sites, and analytes and internal standards were not exchanged between the laboratories.
Patients and sampling
HIV-1 infected children included were from the outpatient clinic of the Erasmus MC – Sophia, Rotterdam, the Netherlands. Venous blood was drawn at a single time point during their routine 3-month visits at the outpatient clinic. For quantitation of lopinavir and ritonavir in plasma, blood was collected in lithium-heparinised tubes. Single time point plasma concentrations of lopinavir and ritonavir were determined during each visit at our outpatient clinic, which is part of the routine clinical care (HPLC-UV assay, dept Clinical Pharmacy UMC St. Radboud). Samples used for cross validation were obtained from an HIV-1 infected child who was admitted to our paediatric ward for determination of lopinavir and ritonavir plasma concentrations over a 12 hour time interval after observed intake of Kaletra. For quantitation of lopinavir and ritonavir in PBMCs, venous blood was collected in one or two Vacutainer CPT tubes (BD, NJ, USA). The Vacutainer CPT tubes were transported to the laboratory immediately after drawing of the blood sample.
For PBMCs treated with red blood cell lysis buffer (see below), PBMCs (and plasma) were collected from 16 HIV-1 infected children during one outpatient visit, and from one HIV-1 infected child PBMCs (and plasma) were collected during two consecutive visits at our outpatient clinic, i.e. a total of 17 PBMC samples were treated with red blood cell lysis buffer. Median age of the patients was 10.5 years old (25th – 75th percentile: 8.6 – 13.7). Eight patients were male, and nine were female. Fifteen patients received Kaletra + lamivudine + abacavir once daily and one patient received Kaletra+ emtricitabine+tenofovir once daily. Samples were drawn at a median of 16 hours after Kaletra intake (25th– 75thpercentile: 14.8 – 17.3). PBMC processing time (time between drawing of the blood sample and storage at -80uC) was 80 minutes (25th– 75thpercentile: 75 – 90). For PBMCs not treated with red blood cell lysis buffer, PBMCs (and plasma) were collected from eight HIV-1 infected children during one outpatient clinic visit, i.e. eight PBMC samples were not treated with red blood cell lysis buffer. Median age of the patients was 10.5 years old (25th– 75th percentile: 8.9 – 13.0). Three patients were male, and five were female. Seven patients received Kaletra+lamivudine +abacavir once daily and one patient received Kaletra + emtricitabine +
tenofovir once daily. Samples were drawn at a median of 14.5 hours after Kaletra intake (25th – 75th percentile: 13.3 – 16.5). PBMC processing time (time between drawing of the blood
sample and storage at 280uC) was 78 minutes (25th – 75th percentile: 72 – 83).
Isolation of PBMCs from HIV infected patients
The Vacutainer CPT tubes were processed immediately upon arrival in the laboratory. Tubes were centrifuged at 1750 g, brake 5, at room temperature for 15 minutes. The plasma layer containing the PBMCs was transferred to 15 mL polypropylene tubes (Falcon conical tubes; BD, NJ, USA) and ice-cold PBS was added until a volume of 12 mL was reached. Samples were centrifuged at 650 g with brake 9, at 4uC for 6 minutes. The supernatant was discarded and the cell pellet was loosened by gently ticking against the tube. Two mL of red blood cell lysis buffer (room temperature) was added, and cells were incubated for 1–2 minutes while gently swirling the cells. Ice-cold PBS was added until a volume of 12 mL was reached. For part of the samples, the red blood cell lysis buffer was not used. In that case, ice-cold PBS was directly added after loosening of the cell pellet. Samples were centrifuged at 350 g with brake 9, at 4uC for 6 minutes. The supernatant was discarded and ice-cold PBS was added until a volume of 12 mL was reached. Samples were centrifuged at 350 g, brake 9, at 4uC for 6 minutes. For part of the samples, 1 mL of supernatant was collected to investigate the amount of drugs present in the final wash step, and the remaining supernatants were discarded. We estimated that,20mL washing fluid remained on top of the cell pellet after discarding the supernatant. Cells were then suspended in a small volume of ice-cold PBS, typically 200 – 400mL depending on the estimated amount of cells isolated. Nucleated cells were counted by trypan blue dye exclusion and/or Tu¨rks using a Burker-Tu¨rk counting chamber and a light microscope. Cell viability was over 95%. Subsequently, ice-cold PBS was added until a concentration was reached of one million PBMC per 100mL PBS. Cell suspensions
were aliquoted as one million nucleated cells, i.e. PBMCs, in 100mL per 1.5 mL polypropylene tube, and were stored at – 80uC.
Isolation of PBMC from buffy coat
For preparation of the calibrators, quality controls, blanks, and zeros, PBMCs were isolated from a buffy coat (Sanquin, Rotterdam, the Netherlands) using a standard Ficoll density gradient. Nucleated cells were counted by trypan blue dye exclusion using a Burker-Tu¨rk cell chamber and a light microscope. Cell viability was over 95%. PBMCs were aliquoted in 1.5 mL polypropylene tubes at a concentration of 10 million cells in 500mL PBS, and were subsequently stored at – 80uC.
Preparation of PBMC from HIV infected patients
PBMC samples were thawed to room temperature. Subse-quently, 300mL MeOH was added and 20mL internal standard
(2mM nelfinavir in MeOH). Samples were extracted for at least one hour at 5uC. Samples were then sonicated at 70% amplitude at 27uC for 10 seconds (Branson Digital Sonifier), and then further extracted at 5uC overnight. The next day, samples were centrifuged at 14,000 rpm at room temperature for 5 minutes, supernatants were collected and transferred to a 96-wells polypropylene plate. Nanopure water (800mL) was added to each sample and the samples were processed using a 96-wells solid phase extraction (SPE) plate (Oasis HLB melution plate, Waters
Corporation, Milford, Massachusetts, USA). SPE wells were conditioned with 200mL MeOH, and equilibrated with 200mL nanopure water. Subsequently, the samples were loaded on to the SPE wells (600mL twice). The wells were washed twice with
eluted from SPE wells with 50mL MeOH twice. The eluates were collected in a polypropylene microtiter plate, and dried using a SpeedVac (,1 hour using a heated mantle at 45uC). Samples were then reconstituted in 10mL matrix solution, 0.75mL matrix/
sample mixture was deposited on three positions on the target plate and dried at room temperature.
Preparation of PBMCs obtained from buffy coat
PBMC samples (10 million PBMC in 500mL PBS per vial) were thawed to room temperature, and 500mL MeOH was added to each vial. Subsequently, samples were spiked with 20mL internal
standard (20mM nelfinavir) and 20mL analytes (Kaletra oral solution diluted in MeOH). Samples were then sonicated at 70% amplitude at27uC for 10 seconds (Branson Digital Sonifier). The equivalent of one million PBMCs (104mL) was transferred to a
clean 1.5 mL polypropylene vial and 300mL MeOH/PBS (5/1, v/v) was added. Samples were extracted at 5uC overnight and further processed as described above for the PBMC samples of HIV infected patients.
Safety statement
Blood samples of HIV infected patients were transported in closed containers and were processed in a biosafety level 2 laboratory. Extraction of the plasma and PBMC samples in methanol for one hour inactivated infectious HIV as reported previously [24–26]. Further sample preparation steps and measurements were performed under less stringent safety conditions.
Results
Plasma
First we tested the MALDI-triple quadrupole MS approach on plasma samples, which is currently the standard type of sample for drug monitoring.
Protein precipitation of plasma with methanol provided sufficiently clean extracts for precise, accurate, and sensitive quantitative analysis of HIV protease inhibitors by MALDI-triple quadrupole MS (see below), and further preparation of the plasma samples with solid phase extraction was therefore not needed.
Simultaneous quantification of lopinavir and ritonavir was achieved using nelfinavir as internal standard, and SRMs were performed on the sodium adducts of these drugs. For these analyses, sodium iodide (NaI) was added to the matrix solution to increase the intensity of the sodium adducts of the drugs. For the simultaneous quantification of saquinavir, indinavir, and nelfina-vir, we used methotrexate as internal standard and SRMs were performed on the protonated forms of the drugs (for instrument settings see Table 1). The lower limits of quantification (LLOQ) obtained in plasma were 167 nM for lopinavir, 14.5 nM for ritonavir, 16 nM for nelfinavir, 16 nM for indinavir, and 3.2 nM for saquinavir, and the precisions and accuracies were within the criteria set by the FDA for bioanalysis [27]. Co-medication did not affect the performance of the assays, as shown by spiking of the quality control samples with an additional ten drugs at a plasma concentration of 10mM each (see Table S1). The MALDI-triple
quadrupole MS assay was used to determine a pharmacokinetic curve of lopinavir and ritonavir in an HIV-1 infected child receiving Kaletra and two nucleoside reverse transcriptase inhibitors (NRTI) twice daily per os. Samples were also measured using a validated HPLC-UV assay (International Quality Control Program for Therapeutic Drug Monitoring in HIV infection, Department of Clinical Pharmacy, University Medical Center Nijmegen, the Netherlands) [24]. The two assays yielded similar
results. For the MALDI-triple quadrupole MS assay, spiking of the patient’s samples with an additional ten drugs (10mM each) did not affect the results (see Figure 1 and Table S2).
PBMCs
We developed a MALDI-triple quadrupole MS assay for simultaneous quantification of lopinavir and ritonavir in one million peripheral blood mononuclear cells (PBMC). The LLOQ was 834 nM for lopinavir and 73 nM for ritonavir, and the precisions and accuracies were within the criteria set by the FDA for bioanalysis (see Table S3). Storage of the sample on the target plate in a closed container at ambient conditions for up to one month analyzed did not affect the precisions, accuracies, or LLOQs (data not shown).
The intracellular concentrations were determined by taking into account that one averaged PBMC has an intracellular volume of 4610213L. To assess the effect of solid phase extraction on the precisions and accuracies, we processed one set of plasma samples that were used for cross-validation with HPLC-UV using the solid phase extraction protocol for PBMCs, and we found that this step did not affect the precisions or the accuracies for lopinavir and ritonavir (data not shown). Shown in Table 2 are the precisions for biological replicates, i.e. analysis of multiple PBMC aliquots from HIV infected children (three aliquots per child).
Assessment of the purity of the cells aliquoted showed that 4.66105erythrocytes (sd 3.46105, n = 5) were present per aliquot of 16106 PBMC. Treatment of the cells isolated with red blood cell lysis buffer (2 minutes, room temperature) during the washing procedure resulted in .2 Log reduction in the number of erythrocytes per million PBMC (mean 3.86103 erythrocytes, sd 5.96103, n = 5). For eight HIV-1 infected children receiving Kaletra and 2 NRTIs once daily, we determined the concentra-tions of lopinavir and ritonavir in the final wash step and found that these constitute less than 4.5% (lopinavir) and less than 8.7% (ritonavir) of the amount measured in one aliquot of one million PBMC.
Application
The MALDI-triple quadrupole MS assay was used to determine the intracellular concentrations of lopinavir and ritonavir in PBMC obtained from HIV-1 infected children receiving Kaletra (lopinavir + ritonavir) and two NRTIs once daily. Part of the samples was processed with red blood cell lysis buffer and part without to further investigate the effect of using this buffer on the concentrations determined. Plasma concentrations of lopinavir and ritonavir were determined by HPLC-UV, which is part of the routine clinical care in our setting. Blood samples were drawn at a single time point after medication intake. Plasma and intracellular concentrations of lopinavir and ritonavir are shown in Table 3, and the correlations are shown in Table 4.
Discussion
spectrometry, because MALDI suffers less from ion suppression than ESI [23,28]. The analysis time using MALDI-based assays is considerably shorter than using LC-based assays; in this case samples were measured at a speed of 13.5 seconds per sample (triplicate analysis), which is approximately 25 – 100 times faster than the LC-based approaches [2,29–31]. The LLOQs in PBMCs for our MALDI-MS assay were 25 femtomole per spot for lopinavir and 2.2 femtomole per spot for ritonavir, which is comparable to the LLOQs in PBMCs of 6 femtomole on column for lopinavir and 5 femtomole on column for ritonavir for the LC-ESI-MS assay described by Colombo et al. [2]. Runtime of that
assay was 20 minutes, and accuracies were still below the recommended 15% when a variable amount of input material, i.e. between 1.46106PBMCs and 9.66106PBMCs, was used for the assay. Pe`lerin et al. described an LC-ESI-MS assay with an LLOQ of 70 femtomole permL intracellular volume for ritonavir and 80 femtomole permL intracellular volume for lopinavir [30]. The amount of PBMCs isolated from 7 mL blood was used as input material for the assay. Runtime of the assay was 20 minutes. Ter Heine et al. described an LC-ESI-MS assay with LLOQ of 1.9 femtomole/36106 PBMCs for lopinavir and an LLOQ of 1.7 femtomole/36106PBMCs for ritonavir [31]. Runtime of the assay
Table 2.Repeat analysis of PBMC aliquots obtained from HIV-1 infected children.
aliquot 1 (mM) aliquot 2 (mM) aliquot 3 (mM) mean (mM) %CV
patient drug spot 1 spot 2 spot 3 spot 1 spot 2 spot 3 spot 1 spot 2 spot 3
1 LPV 2.61 2.70 2.70 2.71 2.84 2.73 2.80 3.14 2.90 2.79 5.6
2 LPV 4.66 5.34 5.01 3.97 4.22 4.01 4.48 4.00 4.88 4.51 11.1
3 LPV 2.11 2.05 2.08 2.43 2.48 2.47 2.13 2.24 2.65 2.29 9.5
1 RTV 0.299 0.279 0.322 0.290 0.278 0.277 0.340 0.313 0.309 0.301 7.3
2 RTV 0.495 0.478 0.469 0.401 0.427 0.396 0.427 0.443 0.459 0.444 7.7
3 RTV 0.336 0.351 0.346 0.336 0.347 0.359 0.375 0.354 0.369 0.352 3.8
For three HIV-1 infected children receiving Kaletra once daily, three aliquots of one million PBMC each were processed as described in the text (solid phase extraction followed by methanol extraction, and spotting in triplicate) to determine the overall precisions (%CV) of PBMC processing and sample measurements. Shown are the concentrations of lopinavir (LPV) and ritonavir (RTV) inmM as determined in a single spot on the target plate.
doi:10.1371/journal.pone.0011409.t002
Figure 1. Lopinavir and ritonavir concentrations in an HIV infected child determined by HPLC-UV and by MALDI-triple quadrupole MS.Pharmacokinetic curve of lopinavir and ritonavir in one HIV infected child determined by HPLC-UV (triangles for lopinavir and crosses for ritonavir), MALDI-triple quadrupole MS (diamonds for lopinavir and circles for ritonavir), and MALDI-triple quadrupole MS when ten additional drugs (10mM per drug) were spiked to the patient’s samples (squares for lopinavir and pluses for ritonavir).
was 10 minutes. For clinical samples, an aliquot of 36106PBMCs
was extracted in a volume of 200mL, and 30mL extract was used for LC-ESI-MS analysis. Ehrardt et al. described an LC-ESI-MS method with an LLOQ of 139 fmol/36106PBMCs for ritonavir and 159 fmol/36106PBMCs for lopinavir [29]. Runtime of the assay was 6 minutes. After sample preparation of 36106PBMCs, the dried extracts were reconstituted in 200mL LC mobile phase and 40mL were used for LC-ESI-MS measurements. LC-ESI-MS methods published thusfar have not been validated specifically for quantification of lopinavir and ritonavir in 16106PBMCs. Yet, the sensitivities of the assays described in literature are likely to be sufficient for that purpose. In this study, we specifically validated
our assay for quantification of lopinavir and ritonavir in 16106
PBMCs, because of our interest in pharmacokinetics of antitre-troviral drugs in children. For the same reason, we specifically validated our assay for quantification of HIV protease inhibitors in 10mL plasma.
We used the Selected Reaction Monitoring (SRM) mode of the MALDI – triple quadrupole mass spectrometer to circumvent background signals derived from the biological sample and from the matrix. In the SRM-mode of a triple quadrupole mass analyzer, only ions with masses corresponding to the mass of the compound of interest are able to pass the first quadrupole, in the second quadrupole the ions collide with a gas resulting in fragmentation, and in the third quadrupole only the fragment ions are able to pass whose masses correspond with the mass of a specific fragment of the drug of interest. The fragmentation pattern of an ion is highly structure specific, and isobaric ions derived from the matrix or from the biological sample are not able to pass through the triple quadrupole mass analyzer and are thus not detected. In addition, the SRM-mode enhances the sensitivity of the measurements and extends the linear dynamic range [17]. We have previously shown that MALDI-triple quadrupole is a suitable technique to quantify HIV protease inhibitors in PBMC extracts [20]. In this study, we show clinical application as well as quantitative analysis of HIV protease inhibitors in plasma including a cross-validation, and we used a different matrix, i.e.
a-cyano-4-hydroxycinnamic acid, which resulted in better
preci-sions and higher sensitivities. Furthermore, we show that the MALDI-triple quadrupole MS approach allows for multi-target quantification using a chemical analogue as internal standard, and that samples co-crystallized with matrix are stable at ambient conditions for up to a month. Thus, samples can be stored and measured multiple times with the same or a different type of MALDI mass spectrometer. In this study, we used HIV protease inhibitors as model compounds, but the approach is also applicable to other drugs. For example, we were able to quantify methotrexate down to 5 nM in plasma (data not shown).
The sample preparation techniques used prior to MALDI-triple quadrupole MS analysis allow for fast and automated processing of large numbers of samples, e.g. in 96-wells plate format [23]. Normally, these sample preparation techniques are also used for subsequent analysis by LC-based assays. Plasma and cells were extracted in methanol, which simultaneously inactivates infectious HIV [25,26]. For plasma, no further sample preparation steps were needed, i.e. the lysates were mixed with matrix solution and deposited on a target plate. Drying of the plasma lysates after protein precipitation and subsequent reconstitution in a small Table 3.Plasma and intracellular concentrations of lopinavir
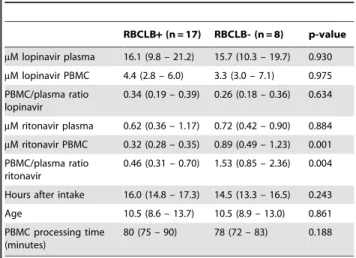
and ritonavir in HIV-1 infected children.
RBCLB+(n = 17) RBCLB- (n = 8) p-value
mM lopinavir plasma 16.1 (9.8 – 21.2) 15.7 (10.3 – 19.7) 0.930
mM lopinavir PBMC 4.4 (2.8 – 6.0) 3.3 (3.0 – 7.1) 0.975
PBMC/plasma ratio lopinavir
0.34 (0.19 – 0.39) 0.26 (0.18 – 0.36) 0.634
mM ritonavir plasma 0.62 (0.36 – 1.17) 0.72 (0.42 – 0.90) 0.884
mM ritonavir PBMC 0.32 (0.28 – 0.35) 0.89 (0.49 – 1.23) 0.001
PBMC/plasma ratio ritonavir
0.46 (0.31 – 0.70) 1.53 (0.85 – 2.36) 0.004
Hours after intake 16.0 (14.8 – 17.3) 14.5 (13.3 – 16.5) 0.243
Age 10.5 (8.6 – 13.7) 10.5 (8.9 – 13.0) 0.861 PBMC processing time
(minutes)
80 (75 – 90) 78 (72 – 83) 0.188
Values between brackets are expressed as medians (25thpercentile – 75th
percentile). P values were determined using a Mann Whitney U test. All patients administered Kaletra (lopinavir+ritonavir)+2 NRTIs once daily.
RBCLB+= PBMCs treated with red blood cell lysis buffer. RBCLB- = PBMCs not treated with red blood cell lysis buffer. The RBCLB+group consisted of 16 HIV-1 infected children. For one child, concentrations were determined during two separate visits at the outpatient clinic. RBCLB- group consisted of 8 HIV-1 infected children. Three children were included in both the RBCLB+group and RBCLB- group as for these patients samples were processed with and without RBCLB. Plasma concentrations were determined by HPLC-UV and intracellular concentrations by MALDI-triple quadrupole MS. For one patient in the RBCLB-group, intracellular concentration of lopinavir was below the LLOQ while the intracellular concentration of ritonavir was above the LLOQ. Hours after intake = time difference in hours between medication intake and drawing of the blood sample. PBMC processing time = time difference between drawing of the blood sample and aliquoting of the PBMC.
doi:10.1371/journal.pone.0011409.t003
Table 4.Correlations between plasma and intracellular levels, and correlations between the concentrations of the two drugs in HIV-1 infected children.
RBCLB+(n = 17) RBCLB- (n = 8)
lopinavir and ritonavir in plasma 0.973 (0.01) 0.952 (0.01)
lopinavir and ritonavir in PBMC 0.613 (0.01) 0.757 (0.05)
lopinavir in plasma and in PBMC 0.475 (NS) 0.613 (NS)
Ritonavir in plasma and in PBMC 0.510 (0.05) 0.500 (NS)
PBMC/plasma ratio lopinavir and PBMC/plasma ratio ritonavir 0.604 (0.05) 0.464 (NS)
lopinavir in plasma and in PBMC 0.531 (0.01) (RBCLB+and RBCLB- combined) lopinavir and ritonavir in plasma 0.965 (0.01) (RBCLB+and RBCLB- combined)
volume of matrix solution resulted in poor crystallization of the samples and severe loss in sensitivity, which is in agreement with two previous reports [16,22]. In our approach, the plasma samples are simply diluted 30 times, which results in good crystallization and highly sensitive measurements. For PBMC samples, we found that this methanol dilution step did not result in the sensitivity needed for intracellular quantitative analysis of HIV protease inhibitors in clinical samples, and therefore samples were further processed with solid phase extraction.
The MALDI-triple quadrupole MS assay was used to investigate the intracellular concentrations of lopinavir and ritonavir in relation to their plasma concentrations in HIV-1 infected children receiving Kaletra, a co-formulation of the HIV protease inhibitors lopinavir and ritonavir (4:1, w/w), once daily. Both drugs are metabolized in the liver by CYP3A4 isoenzymes. Ritonavir inhibits the CYP3A4-mediated metabolism, thereby enhancing the pharmacokinetic properties of lopinavir [32]. This is in agreement with the strong correlation (r= 0.97, p = 0.01) that we found between the plasma concentrations of lopinavir and the plasma concentrations of ritonavir in HIV-1 infected children. Ribera et al. also found a correlation between the plasma AUC of lopinavir and ritonavir in HIV-1 infected adults, although this correlation was less pronounced (r = 0.63, p,0.001) [33].
Whether lopinavir and ritonavir enter the cellular compartment in blood by passive diffusion, active transport, or a combination of both, is currently unknown. Passive diffusion is likely to occur as lopinavir and ritonavir are both lipophilic drugs with an octanol/ saline partition coefficient of 214 and 22.2, respectively, and are thus able to cross the plasma membrane and enter the cells. Active transport into cells has not been reported yet. On the other hand, lopinavir and ritonavir are substrates for drug efflux pumps, although no correlation has been found between drug efflux pumps and intracellular concentrations of HIV protease inhibitors in HIV infected patients [5,10]. It should be noted that only unbound non-ionized drugs can cross the cell membrane by passive diffusion. In vivo, the unbound concentrations of lopinavir and ritonavir are only 1–2% of the total amount in plasma. In vitro studies have already shown that the high protein binding significantly affects the accumulation of protease inhibitors [34,35]. It is expected that lopinavir and ritonavir are also highly bound to proteins within cells. To which proteins and to what extent is currently unknown.
Disposition studies of lopinavir and ritonavir in rats showed that both HIV protease inhibitors penetrate poorly into the cellular fraction of blood. Literature indicates a whole blood/plasma ratio of 0.5 for lopinavir and a whole blood/plasma ratio of 0.26 to 0.68 for ritonavir [36,37]. Koal et al. also reported lower concentrations of HIV protease inhibitors in whole blood compared to plasma in HIV infected patients [38]. This shows that lopinavir and ritonavir penetrate poorly into the cellular fraction of blood. It should be noted that the cellular fraction of whole blood consists for.99% of erythrocytes, and that differences may exist between penetration in erythrocytes and in PBMC.
Accumulation of lopinavir [1,4] and ritonavir [4] in PBMC has been reported in HIV-1 infected adults receiving Kaletra BID: Breilh et al. reported a PBMC/plasma ratio of lopinavir of 3.2 (month 1) and 2.4 (month 6) in patients who responded to therapy, and 2.3 (month 1) and 1.4 (month 6) in patients who failed on therapy [1]. Ritonavir concentrations were not determined in this study. Crommentuyn et al. reported a PBMC/plasma ratio of 1.18 for lopinavir and 4.59 for ritonavir in HIV-1 infected adults receiving Kaletra BID [4]. Ritonavir accumulation was also reported by Khoo et al. They observed a PBMC/plasma ratio of 1 when ritonavir is administered as sole protease inhibitor, 1.25
using ritonavir-boosted saquinavir, and 1.8 using ritonavir-boosted indinavir [39]. On the other hand, Colombo et al. reported a PBMC/plasma ratio of 0.55 for lopinavir in HIV infected adults [2,3]. Ehrhardt et al. showed in one healthy volunteer that, after a single dose of Kaletra, lopinavir concentrations were lower in PBMC than in plasma, but ritonavir concentrations were higher in PBMC than in plasma [29].
In this study, we found lower lopinavir concentrations in PBMC than in plasma in HIV-1 infected children receiving Kaletra once daily. For ritonavir, accumulation in PBMC was highly dependent on the sample preparation used. When erythrocytes were removed by RBCLB no accumulation was found, while accumulation was found when not using RBCLB. This shows that sample preparation can have a major influence on the concentrations measured. This step was included in the sample preparation protocol because of the erythrocytes present in cell suspensions after Ficoll density gradient centrifugation and subsequent thorough washing of the cells. Although cells were incubated for only two minutes in this buffer, we cannot exclude efflux of ritonavir because this incubation occurred at room temperature. However, this does not explain the lower PBMC concentrations compared to plasma for lopinavir as there were no significant differences in the PBMC/plasma ratio when PBMC were prepared with RBCLB or without RBCLB.
In our opinion, the higher PBMC/plasma ratios when RBCLB is not used is not due to high intracellular concentrations of ritonavir in erythrocytes. Previous studies have already shown poor penetration of this drug in blood cells (see above). In addition, when RBCLB was not used, the erythrocyte/PBMC ratio in the cell preparation was ,1:2 (count/count), and the intracellular volume of an erythrocyte is lower (,80 fL) compared to that of an average PBMC (,400 fL). An explanation might be that, due to erythrocyte lysis, proteins are released into the lysis buffer and that ritonavir bound to proteins on the outside of the plasma membrane now bind to the erythrocyte-derived proteins in the buffer. On the other hand, this effect was not observed for lopinavir. Ritonavir but also lopinavir are highly bound in plasma to albumin anda1-acid glycoprotein [32]. In vitro studies have
already shown that higher protein concentrations in cell cultures result in significantly lower intracellular concentrations [34,35].
In conclusion, we have developed a novel assay for the fast and sensitive quantification of compounds that can be applied to monitor drugs in plasma and intracellularly in treatment of various illnesses including antiviral treatment.
Supporting Information
Table S1 Quantitative analysis of HIV protease inhibitors in
plasma. The first column shows the specific drug and the second column shows the concentration of the drug spiked in plasma in
mM. The third column shows the actual amount of drug in femtomoles (fmol) in a single spot on the target plate. The fourth column shows the accuracies, expressed as % deviation, for samples used to construct the calibration curve (calibrators), and the fifth column show the accuracies for samples used to test the validity of the calibration curve (quality controls). Precisions, expressed as %CV, are reported between brackets (n = 9 spots on the target plate). For the analysis of lopinavir and ritonavir, quality controls were spiked with carbamazepine, metoprolol, metroni-dazol, amoxicillin, piroxicam, nevirapine, saquinavir, efavirenz, indinavir, and tipranavir at a plasma concentration of 10mM each. For analysis of nelfinavir, saquinavir, and indinavir, quality controls were spiked with efavirenz, tipranavir, lopinavir, ritona-vir, carbamazepine, metoprolol, metronidazol, amoxicillin, priox-icam, and nevirapine at a plasma concentration of 10mM each. These drugs were not added to the calibrators. The calibrators were prepared in plasma from a different healthy donor than the quality controls were.
Found at: doi:10.1371/journal.pone.0011409.s001 (0.06 MB DOC)
Table S2 Lopinavir and ritonavir concentrations in plasma in an
HIV-1 infected child. The first column shows the time points in hours at which blood samples were collected from one HIV-1 infected child after observed intake of Kaletra. The second column shows the components of Kaletra, i.e. lopinavir and ritonavir. The third column shows the concentration of the compounds inmM
determined by HPLC-UV. The fourth and fifth columns show the
concentration of the compounds inmM determined by
MALDI-triple quadrupole MS. Three technical replicates were measured for each sample, i.e. three spots on the target plate. The precisions (%CV) are reported between brackets. The sixth and seventh columns show the deviations in percentage between the concen-tration of the compounds determined by MALDI-triple quadru-pole MS and by HPLC-UV. For the MALDI-triple quadruquadru-pole MS analyses, one set of samples was spiked with an additional ten drugs (‘‘drugs added’’) and one set was not (‘‘no drugs added’’). The additional ten drugs spiked were carbamazepine, metoprolol, metronidazol, amoxicillin, piroxicam, nevirapine, saquinavir, efavirenz, indinavir, and tipranavir at a plasma concentration of 10mM each.
Found at: doi:10.1371/journal.pone.0011409.s002 (0.05 MB DOC)
Table S3 Quantitative analysis of lopinavir and ritonavir in one
million PBMC. The regression coefficient were.0.998.
Found at: doi:10.1371/journal.pone.0011409.s003 (0.04 MB DOC)
Acknowledgments
We would like to thank the patients for participation in this study. We thank Petronette van Jaarsveld – Bakker, Linda van der Knaap, and Gertjan Driessen (Paediatrics, Erasmus MC – Sophia) for their help with the sample collection. We thank Patrick Boers (Virology, Erasmus MC) for his help with the experiments. HIV protease inhibitors were kindly donated by F.Hoffmann La-Roche (saquinavir), Pfizer (nelfinavir), Abbott Labora-tories (lopinavir and ritonavir), Boehringer Ingelheim (nevirapine and tipranavir), and Merck (indinavir).
Author Contributions
Conceived and designed the experiments: JJAvK RdG TML RG. Performed the experiments: JJAvK MLR LJMD. Analyzed the data: JJAvK MLR PCB LJMD DB TML RG. Contributed reagents/materials/ analysis tools: JJAvK NGH IEvdE ADMEO DB TML. Wrote the paper: JJAvK PCB TML RG.
References
1. Breilh D, Pellegrin I, Rouzes A, Berthoin K, Xuereb F, et al. (2004) Virological, intracellular and plasma pharmacological parameters predicting response to lopinavir/ritonavir (KALEPHAR study). Aids 18: 1305–10.
2. Colombo S, Beguin A, Telenti A, Biollaz J, Buclin T, et al. (2005) Intracellular measurements of anti-HIV drugs indinavir, amprenavir, saquinavir, ritonavir, nelfinavir, lopinavir, atazanavir, efavirenz and nevirapine in peripheral blood mononuclear cells by liquid chromatography coupled to tandem mass spectrometry. J Chromatogr B Analyt Technol Biomed Life Sci 819: 259–76. 3. Colombo S, Telenti A, Buclin T, Furrer H, Lee BL, et al. (2006) Are plasma
levels valid surrogates for cellular concentrations of antiretroviral drugs in HIV-infected patients? Ther Drug Monit 28: 332–8.
4. Crommentuyn KM, Mulder JW, Mairuhu AT, van Gorp EC, Meenhorst PL, et al. (2004) The plasma and intracellular steady-state pharmacokinetics of lopinavir/ritonavir in HIV-1-infected patients. Antivir Ther 9: 779–85. 5. Ford J, Boffito M, Wildfire A, Hill A, Back D, et al. (2004) Intracellular and
plasma pharmacokinetics of saquinavir-ritonavir, administered at 1,600/100 milligrams once daily in human immunodeficiency virus-infected patients. Antimicrob Agents Chemother 48: 2388–93.
6. Ford J, Cornforth D, Hoggard PG, Cuthbertson Z, Meaden ER, et al. (2004) Intracellular and plasma pharmacokinetics of nelfinavir and M8 in HIV-infected patients: relationship with P-glycoprotein expression. Antivir Ther 9: 77–84. 7. Ford J, Khoo SH, Back DJ (2004) The intracellular pharmacology of
antiretroviral protease inhibitors. J Antimicrob Chemother 54: 982–90. 8. Hennessy M, Clarke S, Spiers JP, Kelleher D, Mulcahy F, et al. (2004)
Intracellular accumulation of nelfinavir and its relationship to P-glycoprotein expression and function in HIV-infected patients. Antivir Ther 9: 115–22. 9. Hennessy M, Clarke S, Spiers JP, Mulcahy F, Kelleher D, et al. (2003)
Intracellular indinavir pharmacokinetics in HIV-infected patients: comparison with plasma pharmacokinetics. Antivir Ther 8: 191–8.
10. Hoggard PG, Owen A (2003) The mechanisms that control intracellular penetration of the HIV protease inhibitors. J Antimicrob Chemother 51: 493– 6.
11. Bergshoeff AS, Fraaij PL, van Rossum AM, Wolfs TF, Geelen SP, et al. (2003) Pharmacokinetics of nelfinavir in children: influencing factors and dose implications. Antivir Ther 8: 215–22.
12. Fraaij PL, Bergshoeff AS, van Rossum AM, Hartwig NG, Burger DM, et al. (2003) Changes in indinavir exposure over time: a case study in six HIV-1-infected children. J Antimicrob Chemother 52: 727–30.
13. Fraaij PL, Rakhmanina N, Burger DM, de Groot R (2004) Therapeutic drug monitoring in children with HIV/AIDS. Ther Drug Monit 26: 122–6. 14. Fraaij PLA, van Kampen JJA, Burger DM, de Groot R (2005) Pharmacokinetics
of antiretroviral therapy in HIV-1 infected children. Clin Pharmacokinet 44: 935–56.
15. Corr JJ, Kovarik P, Schneider BB, Hendrikse J, Loboda A, et al. (2006) Design considerations for high speed quantitative mass spectrometry with MALDI ionization. J Am Soc Mass Spectrom 17: 1129–41.
16. Gobey J, Cole M, Janiszewski J, Covey T, Chau T, et al. (2005) Characterization and performance of MALDI on a triple quadrupole mass spectrometer for analysis and quantification of small molecules. Anal Chem 77: 5643–54. 17. Hatsis P, Brombacher S, Corr J, Kovarik P, Volmer DA (2003) Quantitative
analysis of small pharmaceutical drugs using a high repetition rate laser matrix-assisted laser/desorption ionization source. Rapid Commun Mass Spectrom 17: 2303–9.
18. Sleno L, Volmer DA (2005) Some fundamental and technical aspects of the quantitative analysis of pharmaceutical drugs by matrix-assisted laser desorp-tion/ionization mass spectrometry. Rapid Commun Mass Spectrom 19: 1928–36.
19. Sleno L, Volmer DA (2005) Toxin screening in phytoplankton: detection and quantitation using MALDI triple quadrupole mass spectrometry. Anal Chem 77: 1509–17.
21. Volmer DA, Sleno L, Bateman K, Sturino C, Oballa R, et al. (2007) Comparison of MALDI to ESI on a Triple Quadrupole Platform for Pharmacokinetic Analyses. Anal Chem 79: 9000–6.
22. Wagner M, Varesio E, Hopfgartner G (2008) Ultra-fast quantitation of saquinavir in human plasma by matrix-assisted laser desorption/ionization and selected reaction monitoring mode detection. J Chromatogr B Analyt Technol Biomed Life Sci 872: 68–76.
23. van kampen JJA, Burgers PC, De Groot R, Gruters RA, Luider TM (2010) Biomedical application of MALDI mass spectrometry for small-molecule analysis. Mass Spectrom Rev: DOI 10.1002/mas.20268.
24. Droste JA, Verweij-Van Wissen CP, Burger DM (2003) Simultaneous determination of the HIV drugs indinavir, amprenavir, saquinavir, ritonavir, lopinavir, nelfinavir, the nelfinavir hydroxymetabolite M8, and nevirapine in human plasma by reversed-phase high-performance liquid chromatography. Ther Drug Monit 25: 393–9.
25. van Bueren J, Larkin DP, Simpson RA (1994) Inactivation of human immunodeficiency virus type 1 by alcohols. J Hosp Infect 28: 137–48. 26. van Kampen JJ, Verschuren EJ, Burgers PC, Luider TM, de Groot R, et al.
(2007) Validation of an HIV-1 inactivation protocol that is compatible with intracellular drug analysis by mass spectrometry. J Chromatogr B Analyt Technol Biomed Life Sci 847: 38–44.
27. Guidance for industry: bioanalytical method validation. FDA 2001 available at http://www.fda.gov/cder/guidance/4252fnl.pdf.
28. Yang Y, Zhang S, Howe K, Wilson DB, Moser F, et al. (2007) A comparison of nLC-ESI-MS/MS and nLC-MALDI-MS/MS for GeLC-based protein identi-fication and iTRAQ-based shotgun quantitative proteomics. J Biomol Tech 18: 226–37.
29. Ehrhardt M, Mock M, Haefeli WE, Mikus G, Burhenne J (2007) Monitoring of lopinavir and ritonavir in peripheral blood mononuclear cells, plasma, and ultrafiltrate using a selective and highly sensitive LC/MS/MS assay. J Chromatogr B Analyt Technol Biomed Life Sci 850: 249–58.
30. Pelerin H, Compain S, Duval X, Gimenez F, Benech H, et al. (2005) Development of an assay method for the detection and quantification of protease and non-nucleoside reverse transcriptase inhibitors in plasma and in peripherical blood mononuclear cells by liquid chromatography coupled with ultraviolet or tandem mass spectrometry detection. J Chromatogr B Analyt Technol Biomed Life Sci 819: 47–57.
31. ter Heine R, Davids M, Rosing H, van Gorp EC, Mulder JW, et al. (2009) Quantification of HIV protease inhibitors and non-nucleoside reverse transcriptase inhibitors in peripheral blood mononuclear cell lysate using liquid chromatography coupled with tandem mass spectrometry. J Chromatogr B Analyt Technol Biomed Life Sci 877: 575–80.
32. Cvetkovic RS, Goa KL (2003) Lopinavir/ritonavir: a review of its use in the management of HIV infection. Drugs 63: 769–802.
33. Ribera E, Lopez RM, Diaz M, Pou L, Ruiz L, et al. (2004) Steady-state pharmacokinetics of a double-boosting regimen of saquinavir soft gel plus lopinavir plus minidose ritonavir in human immunodeficiency virus-infected adults. Antimicrob Agents Chemother 48: 4256–62.
34. Bilello JA, Bilello PA, Stellrecht K, Leonard J, Norbeck DW, et al. (1996) Human serum alpha 1 acid glycoprotein reduces uptake, intracellular concentration, and antiviral activity of A-80987, an inhibitor of the human immunodeficiency virus type 1 protease. Antimicrob Agents Chemother 40: 1491–7.
35. Jones K, Hoggard PG, Khoo S, Maher B, Back DJ (2001) Effect of alpha1-acid glycoprotein on the intracellular accumulation of the HIV protease inhibitors saquinavir, ritonavir and indinavir in vitro. Br J Clin Pharmacol 51: 99–102. 36. Denissen JF, Grabowski BA, Johnson MK, Buko AM, Kempf DJ, et al. (1997)
Metabolism and disposition of the HIV-1 protease inhibitor ritonavir (ABT-538) in rats, dogs, and humans. Drug Metab Dispos 25: 489–501.
37. Kumar GN, Jayanti VK, Johnson MK, Uchic J, Thomas S, et al. (2004) Metabolism and disposition of the HIV-1 protease inhibitor lopinavir (ABT-378) given in combination with ritonavir in rats, dogs, and humans. Pharm Res 21: 1622–30.
38. Koal T, Burhenne H, Romling R, Svoboda M, Resch K, et al. (2005) Quantification of antiretroviral drugs in dried blood spot samples by means of liquid chromatography/tandem mass spectrometry. Rapid Commun Mass Spectrom 19: 2995–3001.
39. Khoo SH, Hoggard PG, Williams I, Meaden ER, Newton P, et al. (2002) Intracellular accumulation of human immunodeficiency virus protease inhibi-tors. Antimicrob Agents Chemother 46: 3228–35.