Article
J. Braz. Chem. Soc., Vol. 22, No. 1, 134-141, 2011. Printed in Brazil - ©2011 Sociedade Brasileira de Química 0103 - 5053 $6.00+0.00
A
*e-mail: [email protected]
Ultra-Performance Liquid Chromatographic Method for Simultaneous
Quantiication of HIV Non-Nucleoside Reverse Transcriptase Inhibitors and
Protease Inhibitors in Human Plasma
Marina V. Antunes,a Júlia Poeta,b Jorge P. Ribeiro,b Eduardo Sprinzb and Rafael Linden*,a
aInstituto de Ciências da Saúde, Universidade Feevale, Rodovia RS 239 No. 2755,
93352-000 Novo Hamburgo-RS, Brazil
bPrograma de Pós-graduação em Ciências Médicas, Universidade Federal do Rio Grande do Sul,
Rua Ramiro Barcelos No. 2350, 90035-903 Porto Alegre-RS, Brazil
Um método rápido para a determinação de seis inibidores de protease (indinavir, amprenavir, saquinavir, atazanavir, lopinavir e ritonavir) e de dois inibidores não-nucleosídicos da transcriptase reversa (efavirenz e nevirapine), empregando cromatograia líquida de ultra-eiciência com detector de arranjo de diodos foi desenvolvido e validado. Após extração liquido-líquido de 0,5 mL de plasma com metil-tert-butil éter, os analitos foram separados em uma coluna ACQUITY UPLC BEH® C18 (2,1 × 150 mm, d.p. 1,7 µm), eluída com um gradiente de tampão fosfato trietilamônio pH 3.0 e acetonitrila. O tempo total de análise cromatográica foi de 9,5 min. As curvas de calibração foram lineares entre 0,1 a 10,0 µg mL-1. O limite inferior de quantiicação foi 0,1 µg mL-1 para todos os fármacos. A exatidão esteve entre 94,9 e 103,5%. Os coeicientes de variação intra e inter-dias foram inferiores a 7,7% para todos os analitos. Os rendimentos de extração foram superiores a 88,2%.
A fast ultra-performance liquid chromatographic with diode-array detection method has been developed and validated for the determination of six protease inhibitors (indinavir, amprenavir, saquinavir, atazanavir, lopinavir, and ritonavir) and two non-nucleoside reverse transcriptase inhibitors (efavirenz and nevirapine). After liquid-liquid extraction of 0.5 mL plasma with methyl-tert-butyl ether, the analytes were separated on a ACQUITY UPLC BEH® C18 column (2.1 × 150 mm, p.d. 1.7 µm) column eluted with a gradient of acetonitrile and triethylammonium phosphate buffer 5 mmol L-1 pH 3.0. The total run time was 9.5 min. Calibration curves were linear in the range 0.1 to to 10.0 µg mL-1. The lower limit of quantitation was 0.1 µg mL-1 for all drugs. Accuracy ranged from 94.9 to 103.5%. Both interday and intraday coeficients of variation were less than 7.7% for all analytes. The extraction yields were greater than 88.2%.
Keywords: antiretroviral drugs, ultra-performance liquid chromatography, therapeutic drug monitoring, UPLC-DAD
Introduction
Antiretroviral therapy for human immunodeiciency virus (HIV) infections usually consists of combinations of nucleoside reverse transcriptase inhibitors (NRTIs), non-nucleoside reverse transcriptase inhibitors (NNRTIs), protease inhibitors (PIs) and, more recently, entry inhibitors and integrase inhibitors.1 The currently approach to the
therapy of HIV infection is the so-called “highly active antiretroviral therapy” (HAART), which is based on the combination of several drugs in the daily dosing
regimen. The usual HAART scheme consists of one or more NRTIs, one or more PIs and one NNRTI.2 Several
reports had demonstrated the relationship between plasma drug concentrations and clinical effects, either toxicity or eficacy, for compounds of the NNRTI and PI groups.3-8
Therefore, these drugs are prone for therapeutic drug monitoring (TDM) programs and, considering the necessity of interlaboratory comparison of results for the use of consensual therapeutic target levels, reliable analytical methods must be employed at their measurements.
or mass spectrometric detection.16-19 Protocols using
spectrophotometric detectors are free from the matrix ionization effects observed in mass spectrometry and can also provide speciic spectral information trough diode array detectors. Besides this advantages, the need of complete chromatographic separation of all compounds been measured usually determines long analytical runs, leading to low throughput and high consumption of solvents, and by consequence a considerably production of chemical waste. An alternative to conventional HPLC methods is ultra-performance liquid chromatography (UPLC) that could render faster and highly resolutive separations, keeping the advantages and robustness of UV detection modes, as has been described by Elens et al.20 for
the measurement of anti-HIV drugs. In the present work we describe a novel validated UPLC assay, with the use of a photodiode array detector, for the measurement of the following anti-HIV drugs in human plasma: nevirapine, indinavir, amprenavir, saquinavir, atazanavir, ritonavir, efavirenz and lopinavir.
Experimental
Chemicals
Amprenavir, atazanavir sulfate, efavirenz, indinavir sulfate, lopinavir, nevirapine, ritonavir and saquinavir were kindly donated by the National Institutes of Health (NIH) AIDS Research and Reference Reagent Program (Germantown, USA). Clomipramine chloridrate was obtained from Purifarma Química e Farmacêutica (São Paulo, Brazil). Triethylammonium phosphate buffer 1 mol L-1 pH 3.0 was purchased from Fluka (Buchs,
Switzerland). Tris(hydroxymethyl)aminomethane was purchased from Nuclear (Diadema, Brazil). Methanol, acetonitrile and methyl-tert-butyl ether (MTBE) were obtained from Merck (Darmstadt, Germany). Ultrapure water was obtained by an Elga Purelab Ultra apparatus from Elga Labwater (High Wycombe, UK).
Preparation of solutions and standards
Individual stock methanolic solutions of amprenavir, atazanavir sulfate, efavirenz, indinavir sulfate, lopinavir, nevirapine, ritonavir, saquinavir, and clomipramine chloridrate (internal standard) were prepared to obtain 1 mg mL-1 concentration of compound at base form.
Working solutions were prepared combining aliquots of each stock solution and proper volumes of methanol to obtain solutions containing 1.0, 1.5, 2.0, 10.0, 20.0, 25.0, 50.0, 80.0 and 100.0 µg mL-1 of each analyte. The working
solution of internal standard (IS) was prepared by dilution of stock with methanol to obtain a 50 µg mL-1 concentration.
Mobile phase A was prepared daily diluting 500 µL of Triethylammonium phosphate buffer 1 mol L-1 to 100 mL
with ultrapure water to obtain a 5 mmol L-1 concentration,
followed by filtration with 0.2 µm cellulose acetate membranes from Sartorius (Göettingen, Germany). The pH of mobile phase A was adjusted to 3.0. Both mobile phases were sonicated for 15 min before use. Tris buffer pH 10.0 was prepared dissolving 2.43 g of Tris(hydroxymethyl) aminomethane em 100 mL of ultrapure water, and the pH was properly adjusted.
Equipment and chromatographic conditions
The UPLC system consisted of an ACQUITY UPLC®
coupled to an ACQUITY UPLC® photodiode array detector,
both from Waters (Milford, USA). The separation was performed on an ACQUITY UPLC BEH® C18 column
(2.1 × 150 mm, particle diameter of 1.7 µm). The system was controlled and data was managed by Empower 2 software, also from Waters. Mobile phase A was triethylammonium phosphate 5 mmol L-1 and mobile phase B was acetonitrile.
At time zero, a mixture of 65% mobile phase A and 35% mobile phase B was pumped through the column at a constant low of 0.45 mL min-1. From zero to 9.5 min, a
linear gradient was set to reach 43% of A and 57% of B. The initial conditions were restored with a 0.1 min linear gradient, and then maintained for 0.9 min. The total run time was 10.5 min. The column temperature was set at 55 °C. Spectra were acquired for all peaks in the range of 205 to 380 nm. Lopinavir was monitored at 215 nm; saquinavir, efavirenz, ritonavir and IS were monitored at 240 nm; indinavir and amprenavir were monitored at 260 nm; and nevirapine and atazanavir were monitored at 280 nm.
Sample preparation
Selectivity
Blank plasma samples from 6 different sources were prepared as described above to check for peaks that might interfere with the detection of the analytes or the IS. Blank plasma samples enriched with other antiretroviral drugs (abacavir, AZT, DDI, emtricitabine, lamivudine and nelinavir; 1.0 µg mL-1 each) were also checked for
interfering peaks.
Stability
For estimation of stability of processed samples under the conditions of analysis, control samples at 0.15 and 8.0 µg mL-1 (n = 5 each) were extracted as described above.
The extracts obtained at each concentration were pooled. Aliquots of these pooled extracts at each concentration were transferred to autosampler vials and injected under the conditions of a regular analytical run at time intervals of 1 h, during 12 h. Stability of the analytes was tested by regression analysis plotting absolute peak areas corresponding to each compound at each concentration
vs. injection time. Using the obtained linear regression, the concentration after 12 h was calculated. A decrease or increase of up to 10% in the measured peak areas was considered as acceptable. For evaluation of freeze-thaw stability, quality control samples at the same levels as in the benchtop stability experiment were analyzed before (control samples, n = 3) and after 3 freeze-thaw cycles (stability samples, n = 9). For each freeze-thaw cycle, the samples were frozen at −20 °C for 48 h, thawed, and kept at ambient temperature for 3 h before extraction. The concentrations of the control and stability samples were calculated from daily calibration curves. For the ratio of the stability sample means vs. the corresponding control sample means, an acceptance interval of 90-110% was applied.
Linearity
Aliquots of blank plasma (450 µL) were enriched with 50 µL of the corresponding working solutions to obtain calibration samples containing 0.1, 0.2, 1.0, 2.5, 5.0, or 10.0 µg mL-1of each analyte. Replicates (n = 6) at each
concentration were analyzed as described above. Calibration curves were constructed by calculating the ratios of the peak area of each compound to the peak area of the internal standard and comparing these ratios with the nominal concentrations of the calibration samples. Homoscedasticity of calibration data was evaluated with F-test at the conidence level of 95%. Curves were itted by least-squares linear regression using several weighting factor (1/x, 1/x0.5,1/x2,
1/y, 1/y0.5, 1/y2). The calibration models were evaluated by
their correlation coeficients (r) and cumulative percentage relative error (∑%RE) according to Almeida et al.21 Daily
calibration curves using the same concentrations (single measurements per concentration) were prepared with each batch of validation and authentic samples.
Accuracy and precision
Aliquots of blank plasma (450 µL) were enriched with 50 µL of the corresponding working solutions to obtain quality control samples containing all analytes at 0.15, 2.0 and 8.0 µg mL-1 (QCL, QCM and QCH, respectively).
The quality control samples were analyzed as described above in triplicate on each of 5 days. The concentrations of all analytes in the quality control samples were calculated from daily calibration curves. Within-assay precision and between-day precision were calculated by one-way ANOVA with the grouping variable “day” and were expressed as CV%. Accuracy was deined as the percentage of the nominal concentration represented by the concentration estimated with the calibration curve. The acceptance criterion for accuracy was mean values within ±15% of the theoretical value and for precision was a maximum CV of 15%.22
Lower limit of quantiication
The lowest point of the calibration curves was 0.1 µg mL-1 for all analytes. An independent quality control
sample at this concentration was included in the accuracy and precision experiments (QCLLOQ) and was tested in triplicate in three different days. The acceptance criteria established for the limit of quantiication was accuracy within 100 ± 20% of the nominal value of the QC samples and a maximum CV of 20%.22
Extraction eficiency
The extraction eficiency was determined by comparing the peak areas of the analytes obtained at the plasma QC samples of the accuracy and precision experiments to those obtained with methanolic solutions at the same levels, measured in triplicate at three different days, in the same analytical batch. Extraction eficiency was expressed as percentage of the concentration of the reference samples.
Method application
infectology service of a Brazilian tertiary hospital, after approval by institution’s Ethics Research Committee. Trough blood samples were collected by venipuncture to EDTA containing tubes. After collection, the tubes were centrifuged within 30 min and plasma was separated. Plasma samples were kept at −70 °C until analysis.
Results and Discussion
Chromatography and sample preparation
Most HPLC-UV methods for TDM of anti-HIV drugs have long run times, reducing their applicability for routine analysis, along with higher cost associated to the usage of solvents and the disposal of the chemical residues. In this study we described the fastest LC-UV method published for the measurement of the most important anti-HIV drugs currently monitored in HAART. Retention times for nevirapine, indinavir, saquinavir, amprenavir, atazanavir, efavirenz, ritonavir and lopinavir were 1.313, 1.781, 3.631, 3.884, 6.261, 7.338, 7.883 and 8.230 min,
respectively (Figure 1). The retention time of the internal standard was 2.996 min. The total run time was 9.5 min, shorter than the 14 min described by Elens et al.20 in
the only previously published UPLC assay for anti-HIV drugs. The longer chromatographic analysis of Elens et al.20 included the measurement of the late eluting protease
inhibitor tipranavir, which was not present in our assay because this drug is not registered in Brazil, being excluded of the recommended therapeutic schemes of the Brazilian Ministry of Health.23,24 However, the retention times of
Elens et al.20 were higher for all drug common for both
assays: 4.844 for nevirapine, 8.033 for indinavir, 9.479 for amprenavir, 9.506 for saquinavir, 10.287 for atazanavir, 10.502 for efavirenz, 10.880 for lopinavir and 10.887 for ritonavir, with only partial resolution of these two analytes. Moreover, these authors employed an internal standard not commercially available, what reduces the practical application of the method. Total consumption of mobile phase in our assay was only 4.73 mL per analysis, far below from other published LC-UV methods, which could reach up to 67.5 mL.15
Figure 1. Chromatograms of blank plasma spiked with all drugs at 5 µg mL-1 and internal standard. A: measurement at 215 nm; B: measurement at 240 nm;
Interfering endogenous plasma peaks were not observed in the blank samples (Figure 2). Retention times of abacavir, AZT, DDI, emtricitabine, lamivudine and nelfinavir were 0.816, 0.932, 0.812, 0.667, 0.752 and 3.804 min, respectively, presenting no inference with the measured drugs. Additionally, all analyte’s peaks were evaluated with respect to their spectral purity and compared with library reference spectra, using the Empower® software.
No spectral impurity was observed in identiied peaks in any patient’s tested sample.
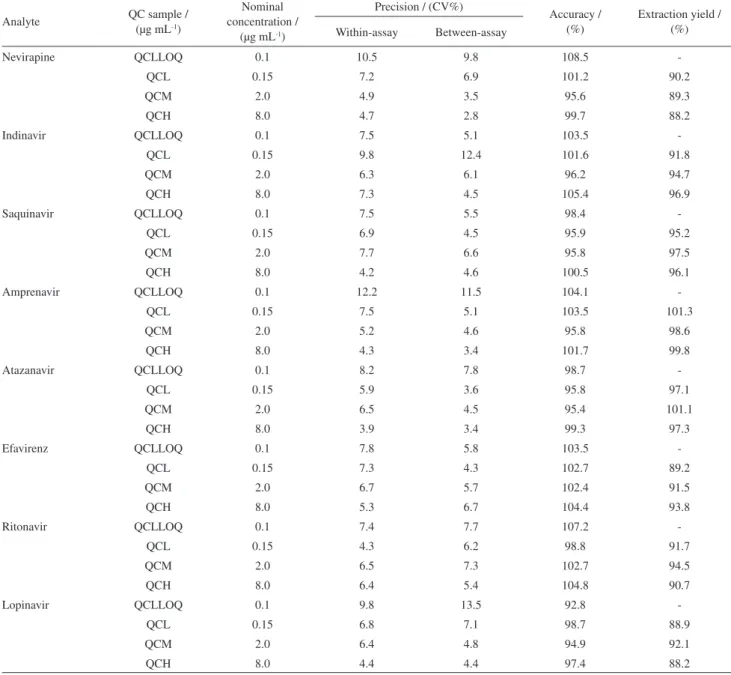
In the present work, for means of simplicity and cost, we choose a liquid-liquid extraction procedure with MTBE to extract the drugs from plasma. This is the irst description of the use of liquid-liquid extraction to the measurement of ARV drugs in plasma by UPLC. The extraction procedure was simple and inexpensive, with consistent yields in the range of 88.2 to 101.3% (Table 3), higher than previously described by solid-phase extraction.20
Method validation
There was no indication of instability of the analytes in any of the tested conditions (Table 1). Regression analysis of absolute peak areas of the analytes plotted vs. injection time indicated no instability of processed samples during a time interval of 12 h, with concentration changes based on liner regression on the range of −3.8 to 6.8%. The time frame of 12 h was determined considering the maximum run time needed for analysis of one batch of 50 samples with the developed method, including the sample preparation. The ratios of means (stability vs. control samples) of the freeze-thaw samples also fulilled the acceptance criteria, with QC concentrations after three cycles on the range of 94.8 to 105.8% of control samples.
Calibration samples were prepared at six concentrations ranging from 0.1 to 10 µg L-1 for each analyte, covering
concentrations that are to be expected for most authentic
Figure 2. A: Blank plasma spiked with internal standard. B: Patient sample with internal standard (IS); atazanavir (ATZ, 1.61 µg mL-1);
efavirenz (EFV, 1.88 µg mL-1) and ritonavir (RTV, 0.11 µg mL-1). Both
chromatograms were monitored at 240 nm.
Table 1. Benchtop stability and freeze and thaw stability
Analyte
Benchtop stability Freeze and thaw stability
Concentration change after 12 h (based on regression) / (%)
Percentage of control concentration after each cycle*
First Second Third
0.15 µg mL-1 8.0 µg mL-1 0.15 µg mL-1 8.0 µg mL-1 0.15 µg mL-1 8.0 µg mL-1 0.15 µg mL-1 8.0 µg mL-1
Nevirapine 4.8 5.5 103.9 102.9 103.1 98.6 105.8 104.1
Indinavir 5.9 4.9 101.5 97.9 105.8 99.4 102.5 103.8
Saquinavir 6.8 2.3 99.8 95.5 99.4 101.8 98.7 102.3
Amprenavir 4.5 3.6 106.4 105.1 96.7 94.1 103.8 100.7
Atazanavir 0.9 2.5 94.7 96.8 105.4 103.7 102.8 97.3
Efavirenz 2.5 3.9 98.7 95.8 101.6 101.4 101.5 104.4
Ritonavir -3.8 4.9 93.5 94.2 100.7 107.1 96.4 96.7
Lopinavir -3.2 3.9 105.4 99.4 93.7 94.8 97.1 102.7
samples. The slopes (b) and y-intercepts (a), including 95% confidence intervals of both variables, as well as the coefficients of correlation (r) and cumulative percentage relative error (∑%RE) for each analyte, as obtained in the linearity experiments, are listed in Table S1 (Supplementary Information). Several weighted regression models were evaluated in order to account to the signiicant heteroscedasticity of the calibration data. The best weighting factor was chosen according to the
∑%RE, deined as the sum of absolute percentage relative error (%RE), which compares the regressed concentration computed from the regression equation obtained for each weighting factor, with the nominal standard concentration.
The inverse of the squared concentration (1/x2) was selected
as the best weighting factor, with a maximum ∑%RE of 0.1210, contrasting to a maximum ∑%RE of 847.89 when unweighted regression was applied. The coeficients of correlation were from 0.9920 to 0.999. The back-calculated concentrations of all calibration samples fulfilled the criteria established by Shah et al.22
QC samples for accuracy and precision experiments were prepared at 3 concentrations (QCL, QCM, and CQH) covering the calibration range. The results of the accuracy and precision experiments are given in Table 2. All accuracy values fulilled the acceptance criteria for this parameter, lying within the range 94.9 to 103.5% of the nominal
Table 2. Precision, accuracy and extraction yield*
Analyte QC sample / (µg mL-1)
Nominal concentration /
(µg mL-1)
Precision / (CV%)
Accuracy / (%)
Extraction yield / (%) Within-assay Between-assay
Nevirapine QCLLOQ 0.1 10.5 9.8 108.5
-QCL 0.15 7.2 6.9 101.2 90.2
QCM 2.0 4.9 3.5 95.6 89.3
QCH 8.0 4.7 2.8 99.7 88.2
Indinavir QCLLOQ 0.1 7.5 5.1 103.5
-QCL 0.15 9.8 12.4 101.6 91.8
QCM 2.0 6.3 6.1 96.2 94.7
QCH 8.0 7.3 4.5 105.4 96.9
Saquinavir QCLLOQ 0.1 7.5 5.5 98.4
-QCL 0.15 6.9 4.5 95.9 95.2
QCM 2.0 7.7 6.6 95.8 97.5
QCH 8.0 4.2 4.6 100.5 96.1
Amprenavir QCLLOQ 0.1 12.2 11.5 104.1
-QCL 0.15 7.5 5.1 103.5 101.3
QCM 2.0 5.2 4.6 95.8 98.6
QCH 8.0 4.3 3.4 101.7 99.8
Atazanavir QCLLOQ 0.1 8.2 7.8 98.7
-QCL 0.15 5.9 3.6 95.8 97.1
QCM 2.0 6.5 4.5 95.4 101.1
QCH 8.0 3.9 3.4 99.3 97.3
Efavirenz QCLLOQ 0.1 7.8 5.8 103.5
-QCL 0.15 7.3 4.3 102.7 89.2
QCM 2.0 6.7 5.7 102.4 91.5
QCH 8.0 5.3 6.7 104.4 93.8
Ritonavir QCLLOQ 0.1 7.4 7.7 107.2
-QCL 0.15 4.3 6.2 98.8 91.7
QCM 2.0 6.5 7.3 102.7 94.5
QCH 8.0 6.4 5.4 104.8 90.7
Lopinavir QCLLOQ 0.1 9.8 13.5 92.8
-QCL 0.15 6.8 7.1 98.7 88.9
QCM 2.0 6.4 4.8 94.9 92.1
QCH 8.0 4.4 4.4 97.4 88.2
concentrations. With-assay assay precision was in the range of 3.9 to 7.7%, where between-assay precision was 3.4 to 7.3%, also being accepted.
Another QC sample containing the analytes at concentrations equal to those of the lowest point of the calibration curve (QCLLOQ) was prepared to determine whether the criteria for analytical recovery and precision were fulfilled even at these concentrations, which corresponded to the practical LLOQ. The QCLLOQ presented accuracy in the range of 92.8 to 108.5, within-assay precision of 6.5 to 12.2%, and between-within-assay of 4.4 to 13.5%, fulilling the acceptance criteria for the lower limit of quantiication.
Method application
In 91 single drug measurements, we found 15 values outside the target ranges for treatment-naïve patients previously published.25 These outlier values were obtained
for efavirenz (range 0.077 to 13.38 µg mL-1, 11 from 40
measurements outside the target range) and lopinavir (range 0.168 to 11.51 µg mL-1, 3 from 11 measurements outside
the target range). As expected, there is a wide variation on the plasma concentration of the measured anti-HIV drugs, even when standardized posology is employed, what corroborates the use of TDM in these patients. Moreover, considering the reported relation of plasma concentration of NNRTI and PI to virological response, the signiicant interindividual pharmacokinetic variation, the numerous potential drug interactions and the possibility to check for compliance, TDM represents an invaluable tool to optimize anti-HIV drug therapy.26
Conclusions
A fast gradient UPLC-PDA method for the simultaneous determination of nevirapine, indinavir, amprenavir, saquinavir, atazanavir, efavirenz, lopinavir and ritonavir in 500 µL of human plasma samples was described. The total run time was 9.5 min, with consumption of only 4.73 mL of mobile phase for each analysis. When compared to usual HPLC methods, the developed method was faster and demanded signiicantly smaller amounts of mobile phase. The sample preparation was based on a simple liquid-liquid extraction with MTBE. This is the irst report of the determination of antiretroviral drugs in biosamples using liquid-liquid extraction associated to UPLC-DAD. The method showed to be precise, accurate and speciic and was applied to 74 patient’s samples, were 15 of 91 single measurements were outside published therapeutic ranges.
Supplementary Information
Supplementary data are available free of charge at http://jbcs.sbq.org.br, as PDF ile.
Acknowledgments
The authors are grateful to the National Institutes of Health (NIH) AIDS Research and Reference Reagent Program (Germantown, USA) for the kind donation of reference samples of anti-HIV drugs and to the Universidade Feevale, for the inancial support.
References
1. http://www.fda.gov/oashi/aids/virals.html, acessed in January 2010.
2. Oxenius, A.; Price, D. A.; Easterbrook, P. A.; O’Callaghan, C. A.; Kelleher, A. D.; Whelan, J. A.; Sontag, G.; Sewell, A. K.; Phillips, R. E.; Proc. Natl. Acad. Sci. 2000, 97, 3382. 3. Wateba, M. I.; Billaud, E.; Dailly, E.; Jolliet, P.; Rafi, F.; HIV
Med. 2006, 7, 197.
4. Gutierrez, F.; Padilla, S.; Navarro, A.; Masiá, M.; Hernández, I.; Ramos, J.; Estéban, A.; Martin-Hidalgo, A.; J. Acquir. Immune Deic. Syndr. 2003, 33, 594.
5. Seminari, E.; Gentilini, G.; Galli, L.; Hasson, H.; Danise, A.; Carini, E.; Dorigatti, F.; Soldarini, A.; Lazzarin, A.; Castagna, A.; J. Antimicrob. Chemother. 2005, 56, 790.
6. van Leth, F. V.; Kappelhoff, B. S.; Johnson, D.; Losso, M. H.; Boron-Kaczmarska, A.; Saag, M. S.; Livrozet, J-M.; Hall, D. B.; Leith, J.; Huitema, A. D. R.; Wit, F. W.; Beijnen, J. H.; Lange, J. M. A.; AIDS Res. Hum. Retroviruses2006, 22, 232.
7. Kappelhoff, B. S.; van Leth, F.; Robinson, P. A.; MacGregor, T. R.; Baraldi, E.; Montella, F.; Uip, D. E.; Thompson, M. A.; Russel, D. B.; Lange, J. M.; Beijnen, J. H.; Huitema, A. D.;
Antivir. Ther. 2005, 10, 489.
8. Back, D.; Gibbons S.; Khoo, S.; Ther. Drug Monit. 2006, 28, 468.
9. Takahashi, M.; Yoshida, M.; Oki, T.; Okumura, N.; Suzuki, T.; Kaneda, T.; Biol. Pharm. Bull.2005, 28, 1286.
10. Poirier, J. M.; Robidou, P.; Jaillon, P.; Ther. Drug Monit. 2005,
27, 186.
11. Rezk, N. L.; Crutchley, R. D.; Yeh, R. F.; Kashuba, A. D. M.;
Ther. Drug Monit. 2006, 28, 517.
12. Colombo, S.; Béguin, A.; Marzolini, C.; Telenti, A.; Biollaz, J.; Decosterd, L. A.; J. Chromatogr., B: Anal. Technol. Biomed. Life Sci.2006, 832, 138.
13. Weller, D. R.; Brundage, R. C.; Balfour, H. H; Vezina, H. E.;
14. Dailly, E.; Reliquet, V.; Victorri-Vigneau, C.; Rafi, F.; Jolliet, P.; J. Chromatogr., B: Anal. Technol. Biomed. Life Sci.2006,
832, 317.
15. Titier, K.; Lagrange, F.; Péhourcq, F.; Edno-Mcheik, L.; Moore, N.; Molimard, M.; Ther. Drug Monit. 2002, 24, 417. 16. Dickinson, L.; Robinson, L.; Tjia, J.; Khoo, S.; Back, D.;
J. Chromatogr., B: Anal. Technol. Biomed. Life Sci. 2005,
829, 82.
17. Rebiere, H.; Mazel, B.; Civade, C.; Bonnet, P. A.;
J. Chromatogr., B: Anal. Technol. Biomed. Life Sci. 2007,
850, 376.
18. D’Avolio, A.; Siccardi, M.; Sciandra, M.; Lorena, B.; Bonora, S.; Trentini, L.; Di Perri, G.; J. Chromatogr., B: Anal. Technol. Biomed. Life Sci.2007, 859, 234.
19. Gehrig, A. K.; Mikus, G.; Haefeli, W. E.; Burhenne, J.; Rapid Commun. Mass Spectrom. 2007, 21, 2704.
20. Elens, L.; Veriter, S.; Di Fazio, V.; Vanbinst, R.; Boesmans, D.; Wallemacq, P.; Haufroid, V.; Clin. Chem.2009, 55, 170. 21. Almeida, A. M.; Castel-Branco, M. M.; Falcão, A. C.; J.
Chromatogr., B: Anal. Technol. Biomed. Life Sci.2002, 774, 215.
22. Shah, V. P.; Midha, K. K., Findlay, J. W. A.; Hill, H. M.; Hulse, J. D.; McGilveray, I. J.; McKay, G.; Miller, K. J.; Patnaik, R. N.; Powell, M. L.; Tonelli, A.; Viswanathan, C. T.; Yacobi, A.;
Pharm. Res.2000, 17, 1551.
23. Brazilian Ministry of Health; Recommendations on Antiretroviral Therapy in HIV-Infected Children and Adolescents. Brasília, 2009. Available at http://www.aids.gov.br/sites/default/iles/ consenso_pediatrico.pdf. Acessed in August 2010.
24. Brazilian Ministry of Health; Recommendations on Antiretroviral Therapy in HIV-Infected Adults. Brasília, 2008. Available at http://www.aids.gov.br/sites/default/iles/ consensoAdulto005c_2008montado.pdfAcessed in August 2010.
25. la Porte, C. J. L.; Back, D. J.; Blaschke, T.; Boucher, C. A. B.; Fletcher, C. V.; Flexner, C.; Gerber, J. G.; Kashuba, A. D. M.; Shapiro, J.; Burger, D. M.; Rev. Antivir. Ther. 2006, 3, 4. 26. van Luin, M.; Kuks, P. F. M.; Burger, D. M.; Curr. Opin. HIV
AIDS2008, 3, 266.
Submitted: January 19, 2010
Supplementary Information
J. Braz. Chem. Soc., Vol. 22, No. 1, S1, 2011. Printed in Brazil - ©2011 Sociedade Brasileira de Química
0103 - 5053 $6.00+0.00
S
I
*e-mail: [email protected]
Ultra-Performance Liquid Chromatographic Method for Simultaneous
Quantiication of HIV Non-Nucleoside Reverse Transcriptase Inhibitors and
Protease Inhibitors in Human Plasma
Marina V. Antunes,a Júlia Poeta,b Jorge P. Ribeiro,b Eduardo Sprinzb and Rafael Linden*,a
aInstituto de Ciências da Saúde, Universidade Feevale, Rodovia RS 239 No. 2755,
93352-000 Novo Hamburgo-RS, Brazil
bPrograma de Pós-graduação em Ciências Médicas, Universidade Federal do Rio Grande do Sul,
Rua Ramiro Barcelos No. 2350, 90035-903 Porto Alegre-RS, Brazil
Table S1. Summary of the evaluation of the calibration models
Weighting factor Regression parameters (± 95% CI)
Analyte
Nevirapine Indinavir Saquinavir Amprenavir Atazanavir Efavirenz Ritonavir Lopinavir
unweighted b 0.2801(±0.0018) 0.0590(±0.0058) 0.5362(±0.0058) 0.3958(±0.0045) 0.1945(±0.0019) 0.3964(±0.0026) 0.1424(±0.0043) 0.3921(±0.0027)
a −0.0046(±0.0034) −0.0032(±0.0117) −0.0360(±0.0111) −0.0232(±0.0086) −0.0069(±0.0036) −0.0171(±0.0051) −0.0084(±0.0083) −0.0045(±0.0053)
r 0.9999 0.9993 0.9982 0.9994 0.9990 0.9970 0.9996 0.9998
∑%RE 282.08 847.89 689.77 749.57 308.97 468.13 602.93 526.48
1/x b 0.2772(±0.0022) 0.0573(±0.0077) 0.5229(±0.0077) 0.3852(±0.0061) 0.1924(±0.0024) 0.3898(±0.0036) 0.1393(±0.0055) 0.3883(±0.0039)
a +0.0043(±0.0043) +0.0024(±0.0148) +0.0057(±0.0148) +0.0102(±0.0116) −0.0001(±0.0048) +0.0039(±0.0071) +0.0013(±0.0105) +0.0118(±0.0074)
r 0.9999 0.9990 0.9993 0.9992 0.9998 0.9996 0.9995 0.9997
∑%RE −9.73x10⁻¹³ 0.5812 −0.0112 −0.1373 −0.0870 −0.0777 −0.0404 180.73
1/x0.5 b 0.2785(±0.0019) 0.0581(±0.0065) 0.5291(±0.0065) 0.3900(±0.0051) 0.1934(±0.0021) 0.3930(±0.0029) 0.1407(±0.0047) 0.3846(±0.0031)
a +0.0022(±0.0037) +0.0009(±0.0125) -0.0055(±0.0124) +0.0018(±0.0097) −0.0021(±0.0039) -0.0021(±0.0057) −0.0012(±0.0091) +0.0119(±0.0059)
r 0.9999 0.9992 0.9995 0.9993 0.9999 0.9998 0.9995 0.9994
∑%RE 60.453 198.18 169.70 172.67 80.032 123.22 140.02 146.40
1/x2 b 0.2753(±0.0028) 0.0551(±0.0137) 0.5033(±0.0137) 0.3751(±0.0122) 0.1880(±0.0061) 0.3764(±0.0095) 0.1353(±0.0097) 0.3661(±0.0126)
a +0.0050(±0.0054) +0.0031(±0.0263) +0.0127(±0.0264) +0.0138(±0.0235) +0.0014(±0.0115) +0.0087(±0.0183) +0.0027(±0.0185) +0.0255(±0.0242)
r 0.9999 0.9980 0.9975 0.9991 0.9987 0.9970 0.9986 0.9920
∑%RE −7.69x10⁻¹³ −0.1124 0.0223 −0.1201 0.1056 −0.0055 −0.2544 0.1210
1/y b 0.2772(±0.0022) 0.0572(±0.0077) 0.5226(±0.0077) 0.3848(±0.0061) 0.1924(±0.0024) 0.3898(±0.0036) 0.1393(±0.0055) 0.3852(±0.0037)
a +0.0043(±0.0043) +0.0022(±0.0149) +0.0045(±0.0149) +0.0009(±0.0117) −0.0003(±0.0046) +0.0029(±0.0069) +0.0011(±0.0106) +0.0160(±0.0071)
r 0.9999 0.9990 0.9993 0.9991 0.9998 0.9997 0.9995 0.9995
∑%RE 2.7721 37.493 24.403 22.223 8.7711 23.953 14.721 68.802
1/y0.5 b 0.2784(±0.0019) 0.0581(±0.0065) 0.5291(±0.0065) 0.3900(±0.0051) 0.1934(±0.0021) 0.3930(±0.0029) 0.1407(±0.0047) 0.3886(±0.0031)
a +0.0021(±0.0037) +0.0007(±0.0124) −0.0066(±0.0124) +0.0006(±0.0097) −0.0021(±0.0039) −0.0028(±0.0056) −0.0014(±0.0091) +0.0099(±0.0058)
r 0.9999 0.9992 0.9995 0.9993 0.9999 0.9998 0.9995 0.9997
∑%RE 65.752 244.04 190.79 206.62 84.691 139.56 153.37 193.47
1/y2 b 0.2751(±0.0029) 0.0552(±0.0134) 0.5035(±0.0133) 0.3742(±0.0122) 0.1879(±0.0061) 0.3770(±0.0093) 0.1354(±0.0096) 0.3709(±0.0099)
a +0.0051(±0.0056) +0.0030(±0.0256) +0.0115(±0.0256) +0.0138(±0.0233) +0.0012(±0.0117) +0.0076(±0.0178) +0.0025(±0.0184) +0.0212(±0.0191)
r 0.9999 0.9984 0.9977 0.9991 0.9986 0.9972 0.9987 0.9943
∑%RE 1.2901 18.121 22.193 8.6132 12.693 21.683 12.273 68.224
Test of homoscedasticity
Fexp 1,376.49 1,405.79 1,454.06 779.97 1,821.94 1,089.13 1,199.08 1,895.21